Housing density: 1,027 houses/condos per square mile
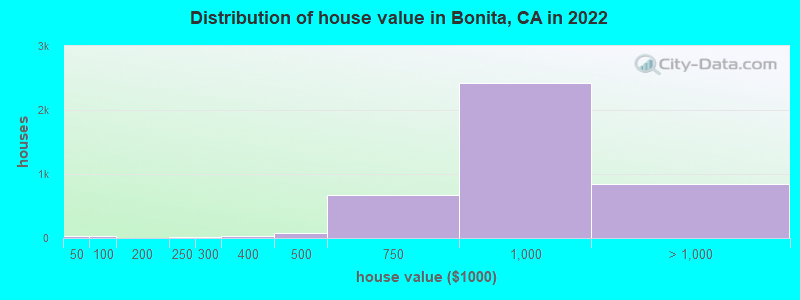
Median price asked for vacant for-sale houses and condos in 2022 in this county: $1,340,665.
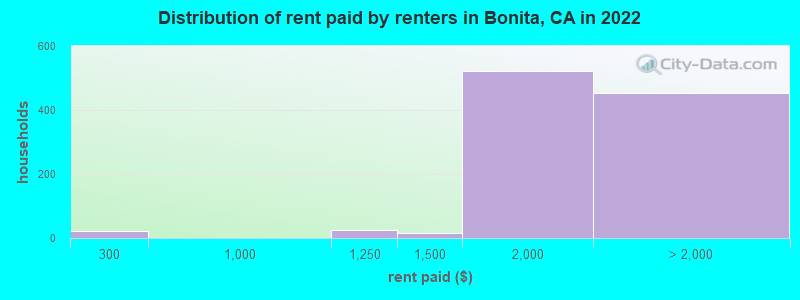
Median contract rent in 2022: $1,920 (lower quartile is $1,687, upper quartile is over $2,000)
Median rent asked for vacant for-rent units in 2022: $1,820
Median gross rent in Bonita, CA in 2022: over $2,000
Housing units in Bonita with a mortgage: 2,609 (235 second mortgage, 10 home equity loan, 177 both second mortgage and home equity loan) Houses without a mortgage: 0
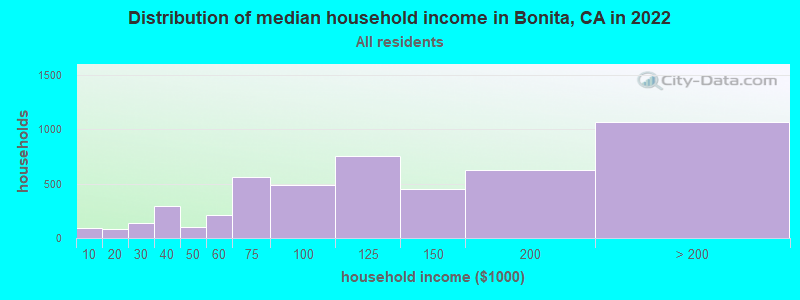
Median household income for houses/condos with a mortgage: $149,465
Median household income for apartments without a mortgage: $99,850
Size of family households: 1,399 2-persons, 806 3-persons, 593 4-persons, 217 5-persons, 117 6-persons, 175 7-or-more-persons.
Size of nonfamily households: 1,384 1-person, 133 2-persons, 11 5-persons.
1,634 married couples with children.
467 single-parent households (137 men, 330 women).
58.9% of residents of Bonita speak English at home.
33.9% of residents speak Spanish at home (81% speak English very well, 11% speak English well, 7% speak English not well, 1% don't speak English at all).
2.0% of residents speak other Indo-European language at home (54% speak English very well, 29% speak English well, 16% speak English not well).
5.3% of residents speak Asian or Pacific Island language at home (42% speak English very well, 32% speak English well, 21% speak English not well, 5% don't speak English at all).
0.8% of residents speak other language at home (93% speak English very well, 7% don't speak English at all).
Foreign born population: 2,626 (19.6%)
(82.2% of them are naturalized citizens)
Percentage of workers working in this county: 99.0% Number of people working at home: 1,091 (16.9% of all workers)
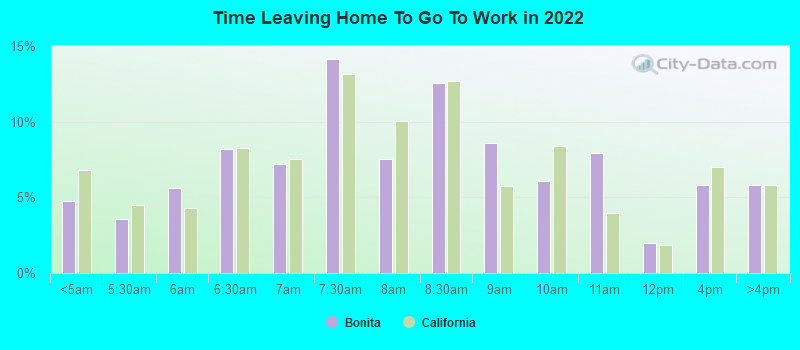
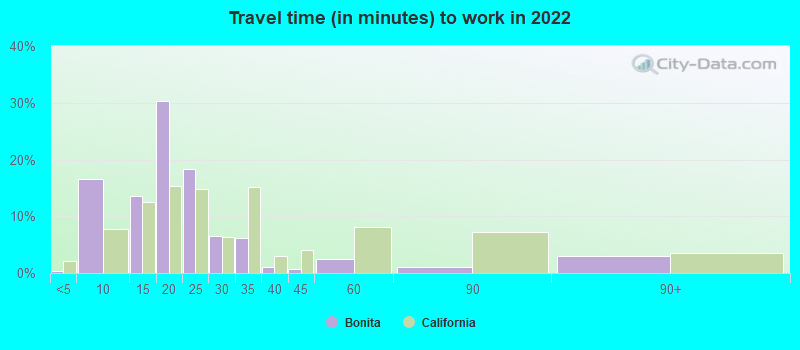
Travel time to work (commute)
Less than 5 minutes: 51
5 to 9 minutes: 354
10 to 14 minutes: 349
15 to 19 minutes: 1,132
20 to 24 minutes: 1,311
25 to 29 minutes: 307
30 to 34 minutes: 807
35 to 39 minutes: 75
40 to 44 minutes: 269
45 to 59 minutes: 380
60 to 89 minutes: 211
90 or more minutes: 59
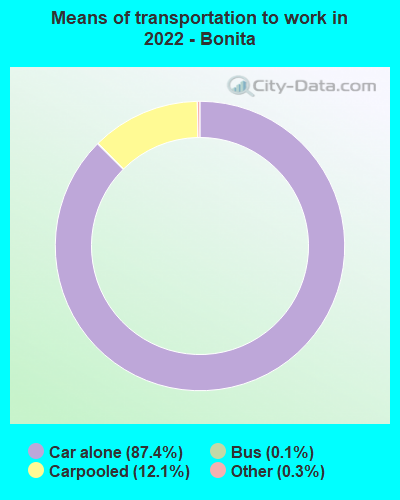
Means of transportation to work:
Drove a car alone: 1,248 (52.5%)
Carpooled: 180 (7.6%)
Bus: 1 (0.0%)
Taxi: 5 (0.2%)
Worked at home: 1,091 (45.9%)
Unemployment by race in 2022
Unemployment rate for White non-Hispanic residents
6.5%Males
2.5%Females
Unemployment rate for Asian residents
0.6%Males
2.0%Females
Unemployment rate for other race residents
10.9%Males
6.2%Females
Unemployment rate for two or more race residents
9.5%Females
Unemployment rate for Hispanic or Latino residents
7.4%Males
7.4%Females
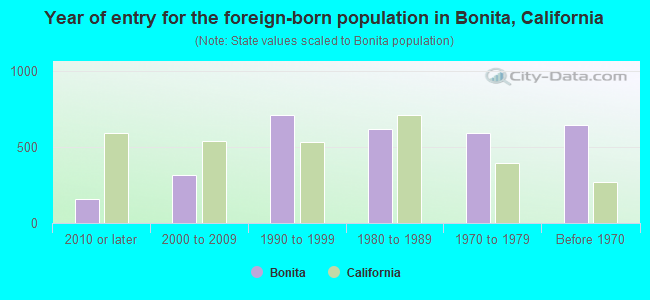
Year of entry for the foreign-born population in Bonita, California
1592010 or later
3152000 to 2009
7071990 to 1999
6201980 to 1989
5891970 to 1979
642Before 1970
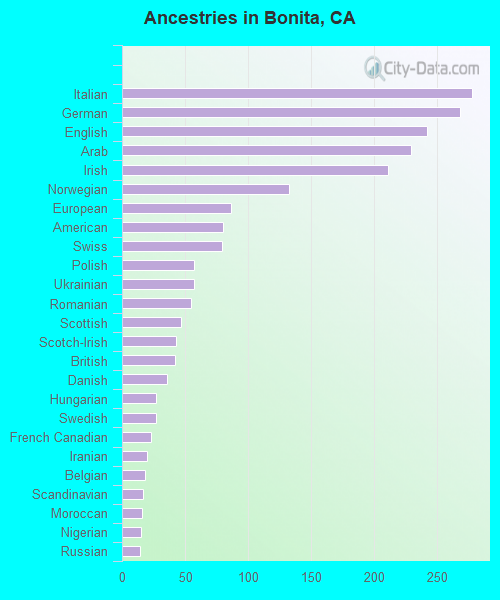
First ancestries reported:
Italian: 277 (3.6%)
German: 268 (3.5%)
English: 242 (3.2%)
Arab: 229 (3.0%)
Irish: 211 (2.7%)
Norwegian: 132 (1.7%)
European: 86 (1.1%)
American: 80 (1.0%)
Swiss: 79 (1.0%)
Polish: 57 (0.7%)
Ukrainian: 57 (0.7%)
Romanian: 55 (0.7%)
Scottish: 47 (0.6%)
Scotch-Irish: 43 (0.6%)
British: 42 (0.5%)
Danish: 36 (0.5%)
Hungarian: 27 (0.4%)
Swedish: 27 (0.4%)
French Canadian: 23 (0.3%)
Iranian: 20 (0.3%)
Belgian: 18 (0.2%)
Scandinavian: 17 (0.2%)
Moroccan: 16 (0.2%)
Nigerian: 15 (0.2%)
Russian: 14 (0.2%)
Dutch: 12 (0.2%)
Slovak: 10 (0.1%)
Northern European: 9 (0.1%)
Eastern European: 8 (0.1%)
African: 7 (0.09%)
Australian: 6 (0.08%)
Most common places of birth for foreign-born residents (%):
Mexico
Bonita:
49.1% (1,290)
California:
37.2% (3,881,193)
Philippines
Bonita:
24.1% (633)
California:
7.8% (818,297)
Vietnam
Bonita:
6.7% (175)
California:
4.9% (512,335)
Iran
Bonita:
3.6% (95)
California:
2.0% (206,004)
Germany
Bonita:
2.2% (57)
California:
0.7% (73,304)
Poland
Bonita:
2.0% (52)
California:
0.2% (20,997)
Romania
Bonita:
1.7% (44)
California:
0.2% (23,058)
Korea
Bonita:
1.6% (42)
California:
3.0% (315,248)
Place of birth for U.S.-born residents:
This state: 7,933
Other state: 2,764
Northeast: 604
Midwest: 1,052
South: 642
West: 451
96.1% of Bonita residents lived in the same house 1 years ago. Out of people who lived in different houses, 42.1% lived in this county. Out of people who lived in different counties, 91.4% lived in California.
Bonita:
96.1%
State average:
88.9%
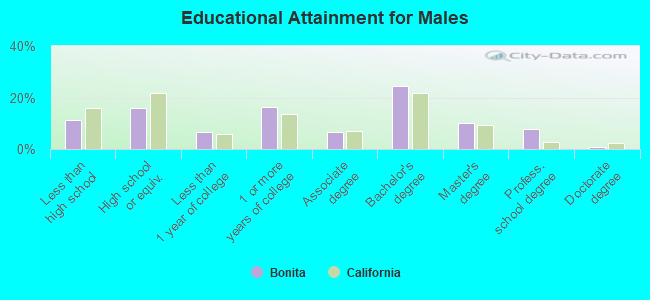
Education attainment for males 25 years and older:
No schooling: 167
Nursery to 4th grade: 0
5th and 6th grade: 85
7th and 8th grade: 0
9th grade: 24
10th grade: 70
11th grade: 69
12th grade, no diploma: 165
High school graduate (or equivalency): 816
Less than 1 year of college: 340
Some college more than 1 year, no degree: 832
Associate degree: 339
Bachelor's degree: 1,253
Master's degree: 516
Professional school degree: 405
Doctorate degree: 30
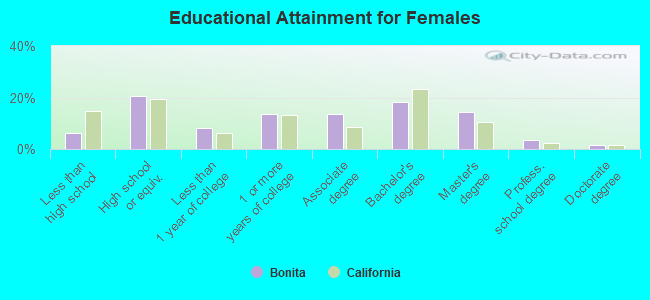
Education attainment for females 25 years and older:
No schooling: 30
Nursery to 4th grade: 15
5th and 6th grade: 160
7th and 8th grade: 0
9th grade: 0
10th grade: 24
11th grade: 20
12th grade, no diploma: 74
High school graduate (or equivalency): 1,043
Less than 1 year of college: 419
Some college more than 1 year, no degree: 702
Associate degree: 693
Bachelor's degree: 937
Master's degree: 733
Professional school degree: 175
Doctorate degree: 80
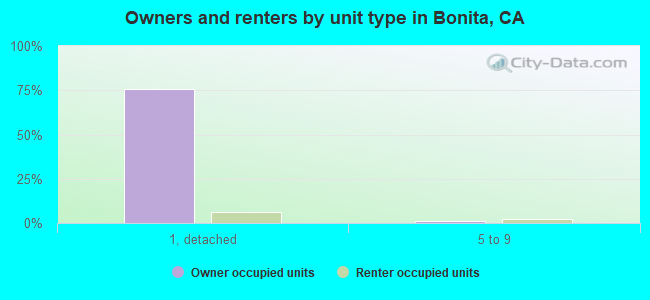
Housing units in structures:
One, detached: 3,965
One, attached: 146
3 or 4: 43
5 to 9: 150
10 to 19: 249
20 to 49: 146
50 or more: 291
Mobile homes: 21
Boats, RVs, vans, etc.: 11
Housing units lacking complete plumbing facilities in 2022: 1.2%
Housing units lacking complete kitchen facilities in 2022: 1.9%
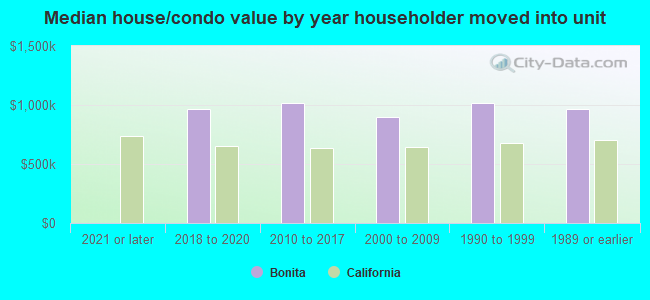
House/condo owner moved in on average 21 years ago