Bon De Croft, TN (Tennessee) Houses and Residents
| Bon De Croft: | $186,192 |
| Tennessee: | $284,800 |
Total population: 4,103 (Urban population: 0, Rural population: 3,802 (339 farm, 3,463 nonfarm))
Houses: 1,626 (1,473 occupied: 1,281 owner occupied, 192 renter occupied)
| % of renters here: | 13% |
| State: | 33% |
Housing density: 11 houses/condos per square mile
Median price asked for vacant for-sale houses and condos in 2022 in this county: $94,750.
Median contract rent in 2022: $640 (lower quartile is $589, upper quartile is $768)
Median rent asked for vacant for-rent units in 2022: $782
Median gross rent in Bon De Croft, TN in 2022: $1,050
Housing units in Bon De Croft with a mortgage: 336 (25 second mortgage, 21 home equity loan, 0 both second mortgage and home equity loan)
Houses without a mortgage: 327


Household type by relationship:
Households: 25,459- In family households: 21,901 (5,265 male householders, 2,001 female householders)
5,469 spouses, 6,973 children (6,165 natural, 243 adopted, 565 stepchildren), 784 grandchildren, 203 brothers or sisters, 174 parents, foster children, 239 other relatives, 622 non-relatives
- In nonfamily households: 3,558 (1,420 male householders (1,136 living alone)), 1,586 female householders (1,418 living alone)), 552 nonrelatives
- In group quarters: 382 (371 institutionalized population)
3,660 married couples with children.
1,170 single-parent households (293 men, 877 women).
95.7% of residents of Bon De Croft speak English at home.
3.7% of residents speak Spanish at home (80% speak English very well, 20% speak English not well).
0.6% of residents speak other Indo-European language at home (76% speak English very well, 24% speak English not well).
Foreign born population: 94 (2.1%)
(78.7% of them are naturalized citizens)
| Here: | 6.3 |
| State: | 6.5 |
| Here: | 4.9 |
| State: | 4.4 |

- Bedrooms in owner-occupied houses and condos in Bon De Croft, Tennessee
- 0no bedroom
- 571 bedroom
- 3302 bedrooms
- 7483 bedrooms
- 1314 bedrooms
- 155+ bedrooms

- Bedrooms in renter-occupied apartments in Bon De Croft, Tennessee
- 7no bedroom
- 351 bedroom
- 722 bedrooms
- 513 bedrooms
- 214 bedrooms
- 65+ bedrooms

- Cars and other vehicles available in Bon De Croft in owner-occupied houses/condos
- 82no vehicle
- 2801 vehicle
- 6082 vehicles
- 2133 vehicles
- 784 vehicles
- 205+ vehicles

- Cars and other vehicles available in Bon De Croft in renter-occupied apartments
- 5no vehicle
- 871 vehicle
- 552 vehicles
- 293 vehicles
- 04 vehicles
- 165+ vehicles

- Rooms in owner-occupied houses in Bon De Croft, Tennessee
- 01 room
- 132 rooms
- 653 rooms
- 1554 rooms
- 3785 rooms
- 3236 rooms
- 1927 rooms
- 988 rooms
- 579+ rooms

- Rooms in renter-occupied apartments in Bon De Croft, Tennessee
- 71 room
- 182 rooms
- 173 rooms
- 564 rooms
- 355 rooms
- 296 rooms
- 187 rooms
- 08 rooms
- 129+ rooms


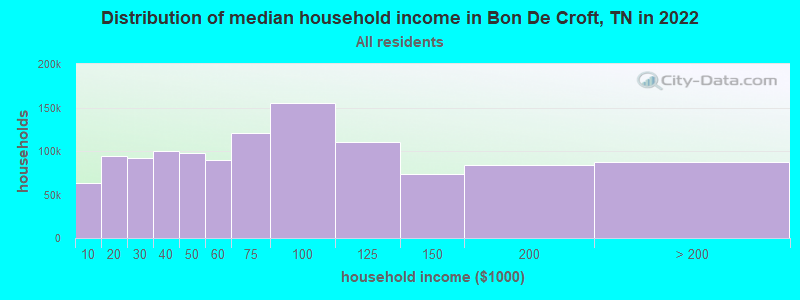
Bon De Croft, TN household income distribution

- 41,971Less than $10,000
- 70,397$10,000 to $19,999
- 66,763$20,000 to $29,999
- 68,262$30,000 to $39,999
- 66,001$40,000 to $49,999
- 61,089$50,000 to $59,999
- 83,288$60,000 to $74,999
- 106,161$75,000 to $99,999
- 79,396$100,000 to $124,999
- 47,292$125,000 to $149,999
- 51,908$150,000 to $199,999
- 43,880$200,000 or more
Percentage of workers working in this county: 68.8%
Number of people working at home: 173 (9.8% of all workers)
Travel time to work (commute)
- Less than 5 minutes: 52
- 5 to 9 minutes: 50
- 10 to 14 minutes: 271
- 15 to 19 minutes: 213
- 20 to 24 minutes: 301
- 25 to 29 minutes: 77
- 30 to 34 minutes: 212
- 35 to 39 minutes: 54
- 40 to 44 minutes: 45
- 45 to 59 minutes: 166
- 60 to 89 minutes: 26
- 90 or more minutes: 61
Means of transportation to work:
- Drove a car alone: 1,272 (80.4%)
- Carpooled: 213 (13.5%)
- Walked: 29 (1.8%)
- Other means: 14 (0.9%)
- Worked at home: 54 (3.4%)


- Year of entry for the foreign-born population in Bon De Croft, Tennessee
- 241995 to March 2000
- 01990 to 1994
- 61985 to 1989
- 01980 to 1984
- 51975 to 1979
- 51970 to 1974
- 61965 to 1969
- 0Before 1965
Most common places of birth for foreign-born residents (%):
| Bon De Croft: | 23.9% (11) |
| Tennessee: | 4.8% (7,701) |
| Bon De Croft: | 23.9% (11) |
| Tennessee: | 0.3% (486) |
| Bon De Croft: | 15.2% (7) |
| Tennessee: | 28.1% (44,682) |
| Bon De Croft: | 13.0% (6) |
| Tennessee: | 1.1% (1,705) |
| Bon De Croft: | 13.0% (6) |
| Tennessee: | 3.8% (6,106) |
| Bon De Croft: | 10.9% (5) |
| Tennessee: | 1.1% (1,694) |
Place of birth for U.S.-born residents:
- This state: 2,420
- Other state: 1,263
- Northeast: 277
- Midwest: 538
- South: 390
- West: 58
62% of Bon De Croft residents lived in the same house 5 years ago.
Out of people who lived in different houses, 61% lived in this county.
Out of people who lived in different counties, 43% lived in Tennessee.
Education attainment for males 25 years and older:
- No schooling: 24
- Nursery to 4th grade: 44
- 5th and 6th grade: 10
- 7th and 8th grade: 138
- 9th grade: 78
- 10th grade: 93
- 11th grade: 38
- 12th grade, no diploma: 41
- High school graduate (or equivalency): 501
- Less than 1 year of college: 68
- Some college more than 1 year, no degree: 133
- Associate degree: 23
- Bachelor's degree: 71
- Master's degree: 21
- Professional school degree: 0
- Doctorate degree: 0

Education attainment for females 25 years and older:
- No schooling: 11
- Nursery to 4th grade: 5
- 5th and 6th grade: 54
- 7th and 8th grade: 167
- 9th grade: 79
- 10th grade: 57
- 11th grade: 23
- 12th grade, no diploma: 48
- High school graduate (or equivalency): 448
- Less than 1 year of college: 108
- Some college more than 1 year, no degree: 158
- Associate degree: 36
- Bachelor's degree: 63
- Master's degree: 34
- Professional school degree: 0
- Doctorate degree: 0


Housing units in structures:
- One, detached: 1,117
- One, attached: 23
- Two: 6
- 3 or 4: 8
- Mobile homes: 472
Median worth of mobile homes: $53,050
Housing units lacking complete kitchen facilities: 1.3%

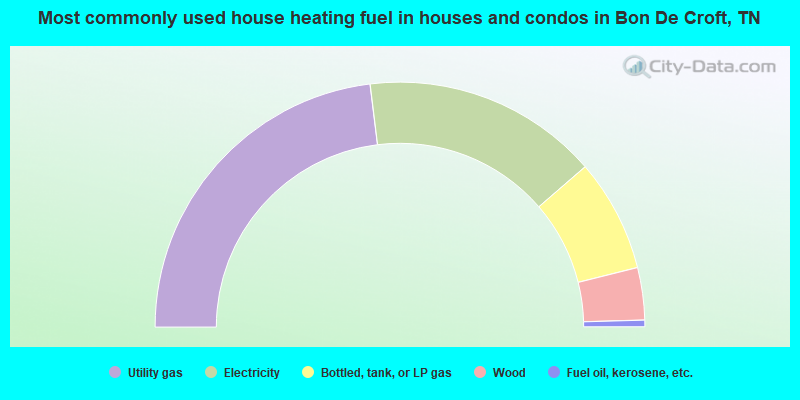
- 46.1%Utility gas
- 31.2%Electricity
- 14.9%Bottled, tank, or LP gas
- 6.9%Wood
- 0.9%Fuel oil, kerosene, etc.
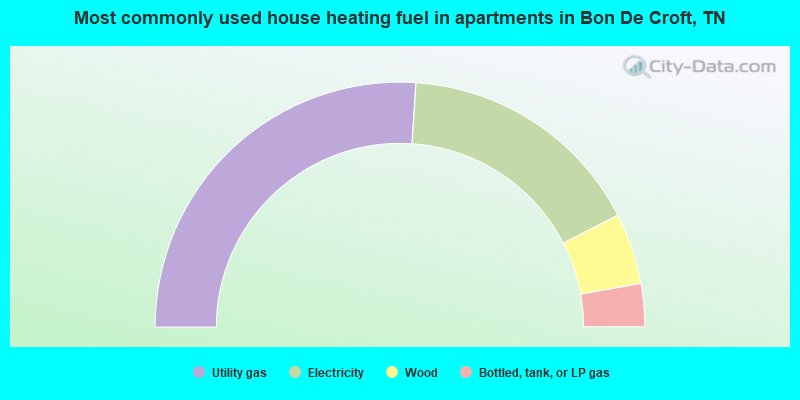
- 52.1%Utility gas
- 32.8%Electricity
- 9.4%Wood
- 5.7%Bottled, tank, or LP gas
Private vs. public school enrollment:
| Here: | 10.6% |
| Tennessee: | 9.5% |
| Here: | 10.7% |
| Tennessee: | 10.4% |
| Here: | 11.2% |
| Tennessee: | 22.8% |


