Boise, ID (Idaho) Houses and Residents
Estimated median house or condo value in 2022: $499,000 (it was $118,100 in 2000 )
Boise:
$499,000Idaho:
$432,500
Lower value quartile - upper value quartile: $398,900 - $700,400Mean price in 2022: Detached houses: $602,149 Here:
$602,149State:
$527,539
Townhouses or other attached units: $452,989 Here:
$452,989State:
$416,749
In 2-unit structures: $640,491 Here:
$640,491State:
$523,641
In 3-to-4-unit structures: $365,611 Here:
$365,611State:
$384,926
In 5-or-more-unit structures: $785,294 Here:
$785,294State:
$590,418
Mobile homes: $114,767 Here:
$114,767State:
$150,232
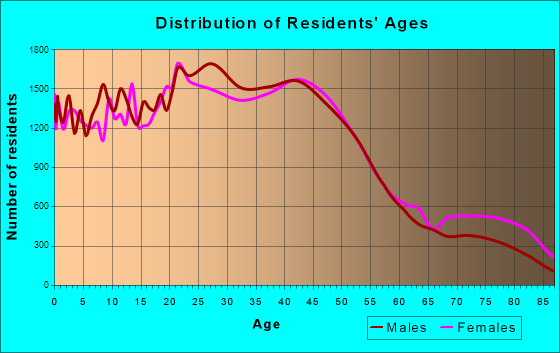
Total population: 216,282 (Urban population: 185,251, Rural population: 686 (15 farm, 671 nonfarm ))
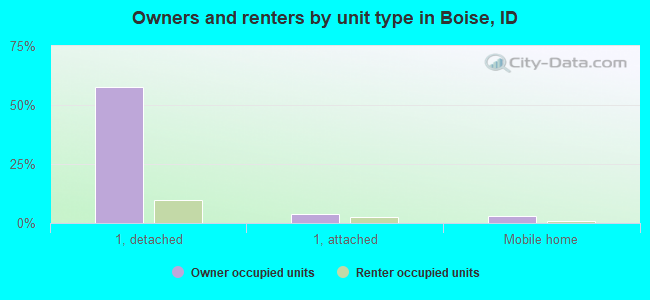
Houses: 104,665 (98,992 occupied: 65,167 owner occupied, 33,825 renter occupied )
% of renters here:
34%State:
28%
Housing density: 1,641 houses/condos per square mile
Median price asked for vacant for-sale houses and condos in 2022: $823,668.
Median contract rent in 2022: $1,255 (lower quartile is $937, upper quartile is $1,679)
Median rent asked for vacant for-rent units in 2022: $3,067
Median gross rent in Boise, ID in 2022: $1,360
Housing units in Boise with a mortgage: 43,544 (5,160 second mortgage, 0 home equity loan, 4,300 both second mortgage and home equity loan )Houses without a mortgage: 1,313
Median household income for houses/condos with a mortgage: $107,280
Median household income for apartments without a mortgage: $75,261
Median monthly housing costs: $1,312
Data:
Median house or condo value ($)
Median house or condo value ($ change since 2000)
Median house or condo value ($) - White
Median house or condo value ($) - Black or African American
Median house or condo value ($) - Asian
Median house or condo value ($) - Hispanic or Latino
Median house or condo value ($) - American Indian and Alaska Native
Median house or condo value ($) - Multirace
Median house or condo value ($) - Other Race
Median price asked for mobile homes ($)
Household density (households per square mile)
Mean house or condo value by units in structure - 1, detached ($)
Mean house or condo value by units in structure - 1, attached ($)
Mean house or condo value by units in structure - 2 ($)
Mean house or condo value by units in structure by units in structure - 3 or 4 ($)
Mean house or condo value by units in structure - 5 or more ($)
Mean house or condo value by units in structure - Boat, RV, van, etc. ($)
Mean house or condo value by units in structure - Mobile home ($)
Median contract rent ($)
Median contract rent - Lower quartile ($)
Median contract rent - Upper quartile ($)
Median gross rent ($)
Urban houses (%)
Rural houses (%)
Houses occupied (%)
Houses occupied (% change since 2000)
Houses owner occupied (%)
Houses owner occupied (% change since 2000)
Houses renter occupied (%)
Houses renter occupied (% change since 2000)
Vacant housing units - For rent (%)
Vacant housing units - For rent (% change since 2000)
Vacant housing units - For sale only (%)
Vacant housing units - For sale only (% change since 2000)
Vacant housing units - Rented or sold, not occupied (%)
Vacant housing units - Rented or sold, not occupied (% change since 2000)
Vacant housing units - For seasonal, recreational, or occasional use (%)
Vacant housing units - For seasonal, recreational, or occasional use (% change since 2000)
Vacant housing units - For migrant workers (%)
Vacant housing units - For migrant workers (% change since 2000)
Vacant housing units - Other vacant (%)
Vacant housing units - Other vacant (% change since 2000)
Median monthly housing costs ($)
Median household income for houses/condos with a mortgage ($)
Median household income for houses/condos without a mortgage ($)
Median household income ($)
Median household income ($) - White
Median household income ($) - Black or African American
Median household income ($) - Asian
Median household income ($) - Hispanic or Latino
Median household income ($) - American Indian and Alaska Native
Median household income ($) - Multirace
Median household income ($) - Other Race
Mortgage status - with mortgage (%)
Mortgage status - with second mortgage (%)
Mortgage status - with home equity loan (%)
Mortgage status - with both second mortgage and home equity loan (%)
Mortgage status - without a mortgage (%)
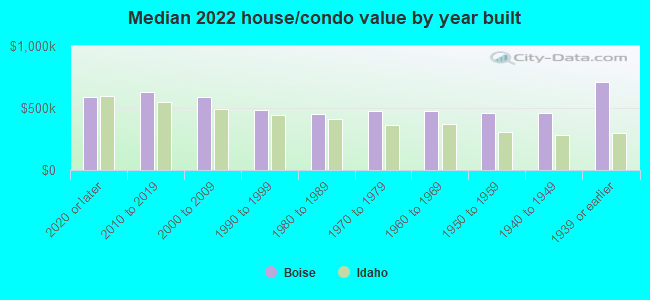
Median year house/condo built
Median year apartment built
Household type by relationship - Male householder living alone (%)
Household type by relationship - Male householder not living alone (%)
Household type by relationship - Female householder living alone (%)
Household type by relationship - Female householder not living alone (%)
Household type by relationship - Opposite-Sex spouse (%)
Household type by relationship - Same-Sex spouse (%)
Household type by relationship - Opposite-Sex unmarried partner (%)
Household type by relationship - Same-Sex unmarried partner (%)
Household type by relationship - In group quarters (%)
Size of family households - 2-person household (%)
Size of family households - 3-person household (%)
Size of family households - 4-person household (%)
Size of family households - 5-person household (%)
Size of family households - 6-person household (%)
Size of family households - 7-or-more-person household (%)
Size of nonfamily households - 1-person household (%)
Size of nonfamily households - 2-person household (%)
Size of nonfamily households - 3-person household (%)
Size of nonfamily households - 4-person household (%)
Size of nonfamily households - 5-person household (%)
Size of nonfamily households - 6-person household (%)
Size of nonfamily households - 7-or-moreperson household (%)
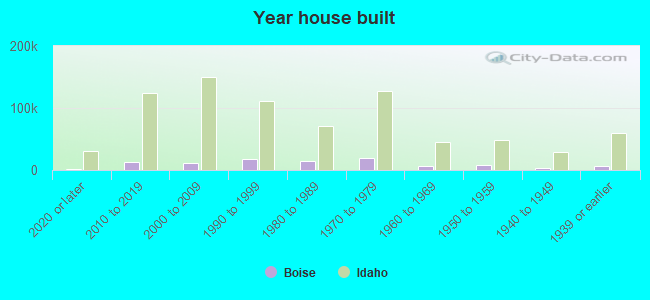
Year house built - Built 2010 or later (%)
Year house built - Built 2000 to 2009 (%)
Year house built - Built 1990 to 1999 (%)
Year house built - Built 1980 to 1989 (%)
Year house built - Built 1970 to 1979 (%)
Year house built - Built 1960 to 1969 (%)
Year house built - Built 1950 to 1959 (%)
Year house built - Built 1940 to 1949 (%)
Year house built - Built 1939 or earlier (%)
Median number of rooms in houses and condos
Median number of rooms in apartments
Median number of bedrooms in owner occupied houses
Mean number of bedrooms in owner occupied houses
Median number of bedrooms in renter occupied houses
Mean number of bedrooms in renter occupied houses
Median number of vehichles in owner occupied houses
Mean number of vehichles in owner occupied houses
Median number of vehichles in renter occupied houses
Mean number of vehichles in renter occupied houses
Rooms in owner-occupied houses - 1 room (%)
Rooms in owner-occupied houses - 2 rooms (%)
Rooms in owner-occupied houses - 3 rooms (%)
Rooms in owner-occupied houses - 4 rooms (%)
Rooms in owner-occupied houses - 5 rooms (%)
Rooms in owner-occupied houses - 6 rooms (%)
Rooms in owner-occupied houses - 7 rooms (%)
Rooms in owner-occupied houses - 8 rooms (%)
Rooms in owner-occupied houses - 9+ rooms (%)
Rooms in renter-occupied houses - 1 room (%)
Rooms in renter-occupied houses - 2 rooms (%)
Rooms in renter-occupied houses - 3 rooms (%)
Rooms in renter-occupied houses - 4 rooms (%)
Rooms in renter-occupied houses - 5 rooms (%)
Rooms in renter-occupied houses - 6 rooms (%)
Rooms in renter-occupied houses - 7 rooms (%)
Rooms in renter-occupied houses - 8 rooms (%)
Rooms in renter-occupied houses - 9+ rooms (%)
Bedrooms in owner-occupied houses - no bedrooms (%)
Bedrooms in owner-occupied houses - 1 bedroom (%)
Bedrooms in owner-occupied houses - 2 bedrooms (%)
Bedrooms in owner-occupied houses - 3 bedrooms (%)
Bedrooms in owner-occupied houses - 4 bedrooms (%)
Bedrooms in owner-occupied houses - 5+ bedrooms (%)
Bedrooms in renter-occupied houses - no bedrooms (%)
Bedrooms in renter-occupied houses - 1 bedroom (%)
Bedrooms in renter-occupied houses - 2 bedrooms (%)
Bedrooms in renter-occupied houses - 3 bedrooms (%)
Bedrooms in renter-occupied houses - 4 bedrooms (%)
Bedrooms in renter-occupied houses - 5+ bedrooms (%)
Vehicles available in owner-occupied houses - no vehicle available (%)
Vehicles available in owner-occupied houses - 1 vehicle available(%)
Vehicles available in owner-occupied houses - 2 Vehicles available (%)
Vehicles available in owner-occupied houses - 3 Vehicles available (%)
Vehicles available in owner-occupied houses - 4 Vehicles available (%)
Vehicles available in owner-occupied houses - 5+ Vehicles available (%)
Vehicles available in renter-occupied houses - no vehicle available (%)
Vehicles available in renter-occupied houses - 1 vehicle available (%)
Vehicles available in renter-occupied houses - 2 Vehicles available (%)
Vehicles available in renter-occupied houses - 3 Vehicles available (%)
Vehicles available in renter-occupied houses - 4 Vehicles available (%)
Vehicles available in renter-occupied houses - 5+ Vehicles available (%)
Housing units in structures - 1, detached (%)
Housing units in structures - 1, attached (%)
Housing units in structures - 2 (%)
Housing units in structures - 3 or 4 (%)
Housing units in structures - 5 to 9 (%)
Housing units in structures - 10 to 19 (%)
Housing units in structures - 20 to 49 (%)
Housing units in structures - 50 or more (%)
Housing units in structures - Mobile home (%)
Housing units in structures - Boat, RV, van, etc. (%)
Housing units in structures - Owners - 1, detached (%)
Housing units in structures - Owners - 1, attached (%)
Housing units in structures - Owners - 2 (%)
Housing units in structures - Owners - 3 or 4 (%)
Housing units in structures - Owners - 5 to 9 (%)
Housing units in structures - Owners - 10 to 19 (%)
Housing units in structures - Owners - 20 to 49 (%)
Housing units in structures - Owners - 50 or more (%)
Housing units in structures - Owners - Mobile home (%)
Housing units in structures - Owners - Boat, RV, van, etc. (%)
Housing units in structures - Renters - 1, detached (%)
Housing units in structures - Renters - 1, attached (%)
Housing units in structures - Renters - 2 (%)
Housing units in structures - Renters - 3 or 4 (%)
Housing units in structures - Renters - 5 to 9 (%)
Housing units in structures - Renters - 10 to 19 (%)
Housing units in structures - Renters - 20 to 49 (%)
Housing units in structures - Renters - 50 or more (%)
Housing units in structures - Renters - Mobile home (%)
Housing units in structures - Renters - Boat, RV, van, etc. (%)
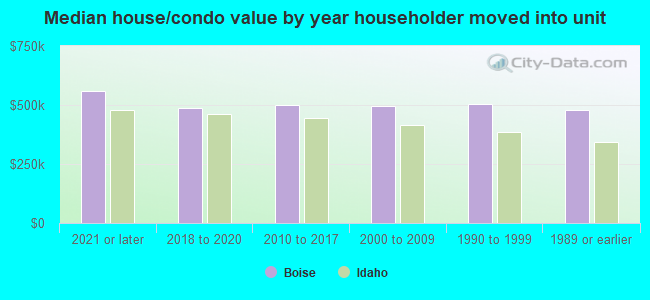
House/condo owner moved in on average (years ago)
Renter moved in on average (years ago)
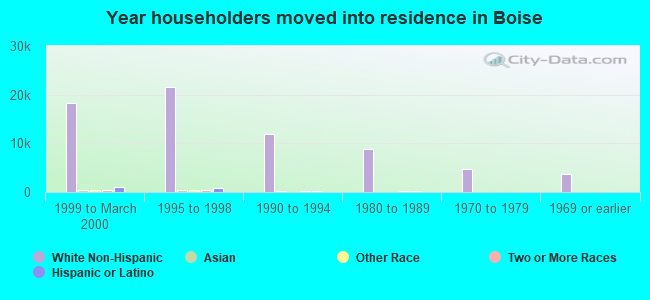
Year householder moved into unit - Moved in 1999 to March 2000 (%)
Year householder moved into unit - Moved in 1999 to March 2000 (%) - White
Year householder moved into unit - Moved in 1999 to March 2000 (%) - Black or African American
Year householder moved into unit - Moved in 1999 to March 2000 (%) - Asian
Year householder moved into unit - Moved in 1999 to March 2000 (%) - Hispanic or Latino
Year householder moved into unit - Moved in 1999 to March 2000 (%) - American Indian and Alaska Native
Year householder moved into unit - Moved in 1999 to March 2000 (%) - Multirace
Year householder moved into unit - Moved in 1999 to March 2000 (%) - Other Race
Year householder moved into unit - Moved in 1995 to 1998 (%)
Year householder moved into unit - Moved in 1995 to 1998 (%) - White
Year householder moved into unit - Moved in 1995 to 1998 (%) - Black or African American
Year householder moved into unit - Moved in 1995 to 1998 (%) - Asian
Year householder moved into unit - Moved in 1995 to 1998 (%) - Hispanic or Latino
Year householder moved into unit - Moved in 1995 to 1998 (%) - American Indian and Alaska Native
Year householder moved into unit - Moved in 1995 to 1998 (%) - Multirace
Year householder moved into unit - Moved in 1995 to 1998 (%) - Other Race
Year householder moved into unit - Moved in 1990 to 1994 (%)
Year householder moved into unit - Moved in 1990 to 1994 (%) - White
Year householder moved into unit - Moved in 1990 to 1994 (%) - Black or African American
Year householder moved into unit - Moved in 1990 to 1994 (%) - Asian
Year householder moved into unit - Moved in 1990 to 1994 (%) - Hispanic or Latino
Year householder moved into unit - Moved in 1990 to 1994 (%) - American Indian and Alaska Native
Year householder moved into unit - Moved in 1990 to 1994 (%) - Multirace
Year householder moved into unit - Moved in 1990 to 1994 (%) - Other Race
Year householder moved into unit - Moved in 1980 to 1989 (%)
Year householder moved into unit - Moved in 1980 to 1989 (%) - White
Year householder moved into unit - Moved in 1980 to 1989 (%) - Black or African American
Year householder moved into unit - Moved in 1980 to 1989 (%) - Asian
Year householder moved into unit - Moved in 1980 to 1989 (%) - Hispanic or Latino
Year householder moved into unit - Moved in 1980 to 1989 (%) - American Indian and Alaska Native
Year householder moved into unit - Moved in 1980 to 1989 (%) - Multirace
Year householder moved into unit - Moved in 1980 to 1989 (%) - Other Race
Year householder moved into unit - Moved in 1970 to 1979 (%)
Year householder moved into unit - Moved in 1970 to 1979 (%) - White
Year householder moved into unit - Moved in 1970 to 1979 (%) - Black or African American
Year householder moved into unit - Moved in 1970 to 1979 (%) - Asian
Year householder moved into unit - Moved in 1970 to 1979 (%) - Hispanic or Latino
Year householder moved into unit - Moved in 1970 to 1979 (%) - American Indian and Alaska Native
Year householder moved into unit - Moved in 1970 to 1979 (%) - Multirace
Year householder moved into unit - Moved in 1970 to 1979 (%) - Other Race
Year householder moved into unit - Moved in 1969 or earlier (%)
Year householder moved into unit - Moved in 1969 or earlier (%) - White
Year householder moved into unit - Moved in 1969 or earlier (%) - Black or African American
Year householder moved into unit - Moved in 1969 or earlier (%) - Asian
Year householder moved into unit - Moved in 1969 or earlier (%) - Hispanic or Latino
Year householder moved into unit - Moved in 1969 or earlier (%) - American Indian and Alaska Native
Year householder moved into unit - Moved in 1969 or earlier (%) - Multirace
Year householder moved into unit - Moved in 1969 or earlier (%) - Other Race
Housing units lacking complete plumbing facilities (%)
Housing units lacking complete kitchen facilities (%)
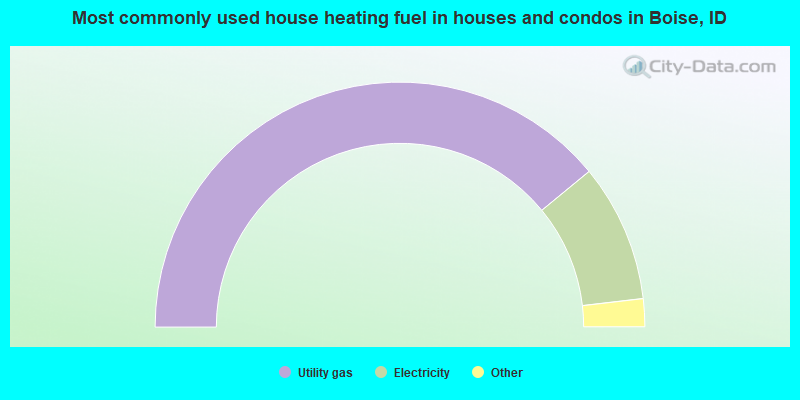
House heating fuel used in houses and condos - Utility gas (%)
House heating fuel used in houses and condos - Bottled, tank, or LP gas (%)
House heating fuel used in houses and condos - Electricity (%)
House heating fuel used in houses and condos - Fuel oil, kerosene, etc. (%)
House heating fuel used in houses and condos - Coal or coke (%)
House heating fuel used in houses and condos - Wood (%)
House heating fuel used in houses and condos - Solar energy (%)
House heating fuel used in houses and condos - Other fuel (%)
House heating fuel used in houses and condos - No fuel used (%)
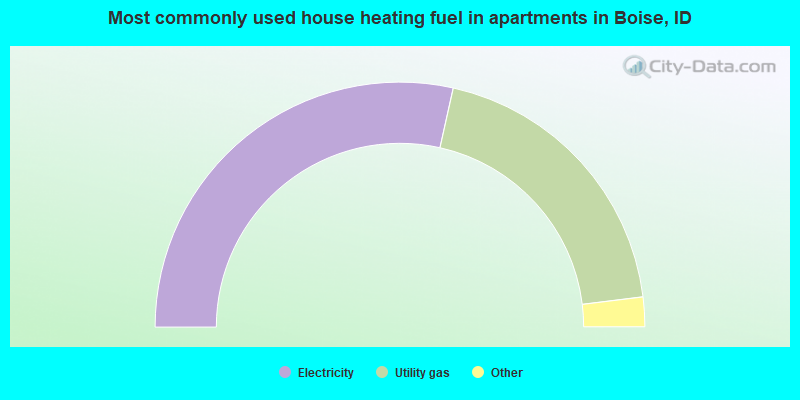
House heating fuel used in apartments - Utility gas (%)
House heating fuel used in apartments - Bottled, tank, or LP gas (%)
House heating fuel used in apartments - Electricity (%)
House heating fuel used in apartments - Fuel oil, kerosene, etc. (%)
House heating fuel used in apartments - Coal or coke (%)
House heating fuel used in apartments - Wood (%)
House heating fuel used in apartments - Solar energy (%)
House heating fuel used in apartments - Other fuel (%)
House heating fuel used in apartments - No fuel used (%)
Latest news about housing in Boise, ID collected exclusively by city-data.com from local newspapers, TV, and radio stations
Median year house/condo built: 1985Median year apartment built: 1985Household type by relationship:
Households: 236,632
Male householders: 49,570 (13,639 living alone ), Female householders: 49,422 (15,997 living alone )43,584 spouses (42,701 opposite-sex spouses ), 8,961 unmarried partners , (8,384 opposite-sex unmarried partners ), 53,778 children (50,295 natural , 1,242 adopted , 2,241 stepchildren ), 2,436 grandchildren , 2,484 brothers or sisters , 1,969 parents , 0 foster children , 2,215 other relatives , 15,440 non-relatives In group quarters: 6,773
Size of family households: 26,331 2-persons , 13,757 3-persons , 10,673 4-persons , 3,918 5-persons , 1,189 6-persons , 562 7-or-more-persons .
Size of nonfamily households: 29,636 1-person , 10,157 2-persons , 1,531 3-persons , 698 4-persons , 355 5-persons , 185 6-persons .
29,399 married couples with children. single-parent households (3,745 men , 7,438 women ).
89.9% of residents of Boise speak English at home. of residents speak Spanish at home (66% speak English very well , 17% speak English well , 14% speak English not well , 3% don't speak English at all ).of residents speak other Indo-European language at home (71% speak English very well , 15% speak English well , 12% speak English not well , 2% don't speak English at all ).of residents speak Asian or Pacific Island language at home (62% speak English very well , 28% speak English well , 7% speak English not well , 3% don't speak English at all ).of residents speak other language at home (40% speak English very well , 25% speak English well , 22% speak English not well , 13% don't speak English at all ).
Foreign born population: 16,722 (7.1%)of them are naturalized citizens )
Median number of rooms in houses and condos:
Median number of rooms in apartments
Owner-occupied Renter-occupied
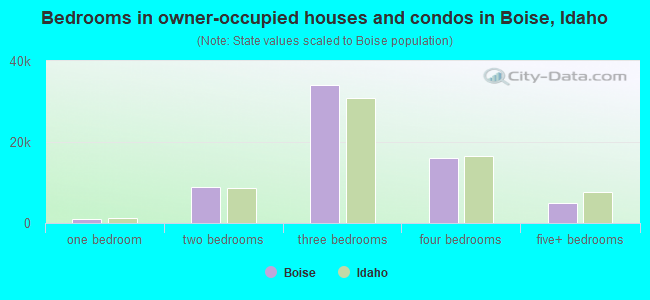
Bedrooms in owner-occupied houses and condos in Boise, Idaho
148 no bedroom 1,069 1 bedroom 8,844 2 bedrooms 34,087 3 bedrooms 15,987 4 bedrooms 5,032 5+ bedrooms
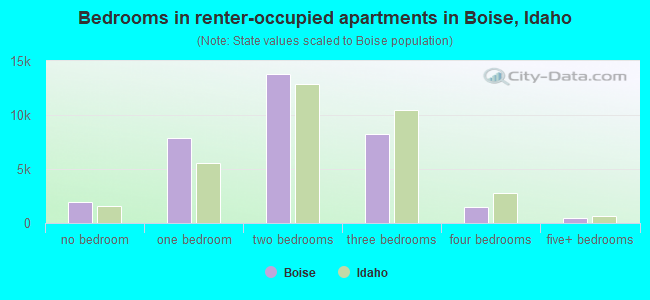
Bedrooms in renter-occupied apartments in Boise, Idaho
1,946 no bedroom 7,905 1 bedroom 13,809 2 bedrooms 8,248 3 bedrooms 1,474 4 bedrooms 443 5+ bedrooms
Owner-occupied Renter-occupied
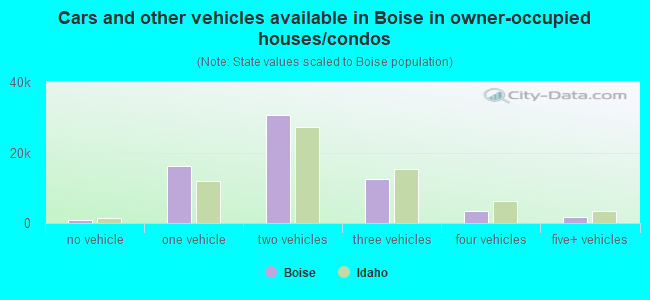
Cars and other vehicles available in Boise in owner-occupied houses/condos
919 no vehicle 16,133 1 vehicle 30,639 2 vehicles 12,418 3 vehicles 3,286 4 vehicles 1,772 5+ vehicles
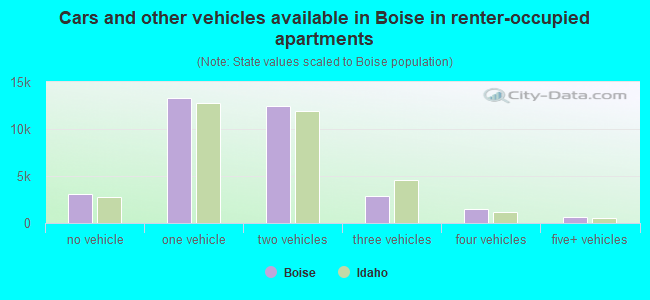
Cars and other vehicles available in Boise in renter-occupied apartments
3,050 no vehicle 13,313 1 vehicle 12,493 2 vehicles 2,821 3 vehicles 1,461 4 vehicles 687 5+ vehicles
Owner-occupied Renter-occupied
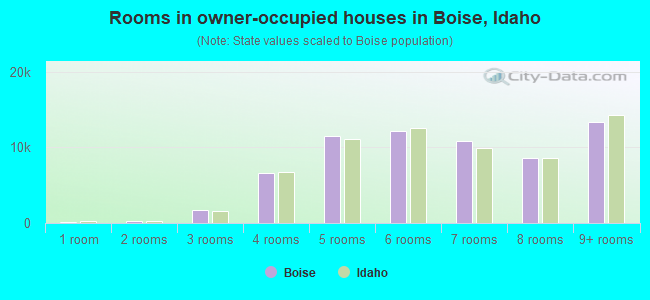
Rooms in owner-occupied houses in Boise, Idaho
148 1 room 329 2 rooms 1,732 3 rooms 6,590 4 rooms 11,492 5 rooms 12,183 6 rooms 10,837 7 rooms 8,530 8 rooms 13,326 9+ rooms
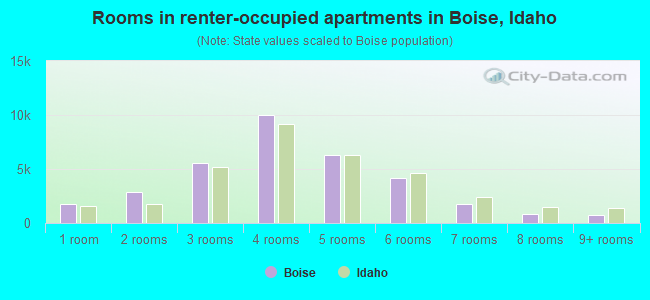
Rooms in renter-occupied apartments in Boise, Idaho
1,731 1 room 2,850 2 rooms 5,530 3 rooms 9,986 4 rooms 6,326 5 rooms 4,140 6 rooms 1,727 7 rooms 807 8 rooms 728 9+ rooms
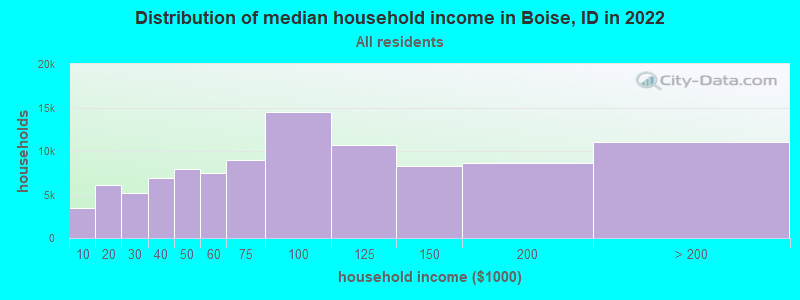
Boise, ID household income distribution 3,398 Less than $10,0006,103 $10,000 to $19,9995,173 $20,000 to $29,9996,943 $30,000 to $39,9997,894 $40,000 to $49,9997,462 $50,000 to $59,9998,926 $60,000 to $74,99914,488 $75,000 to $99,99910,692 $100,000 to $124,9998,262 $125,000 to $149,9998,612 $150,000 to $199,99911,039 $200,000 or more
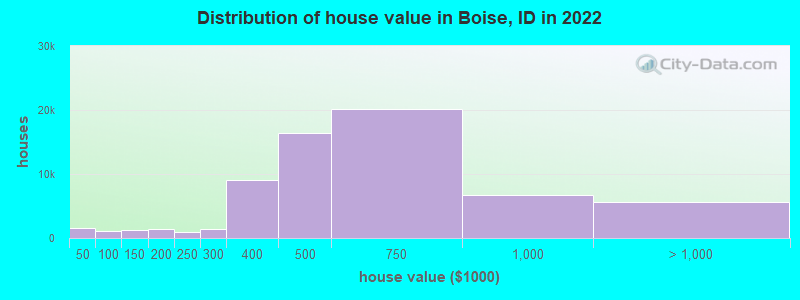
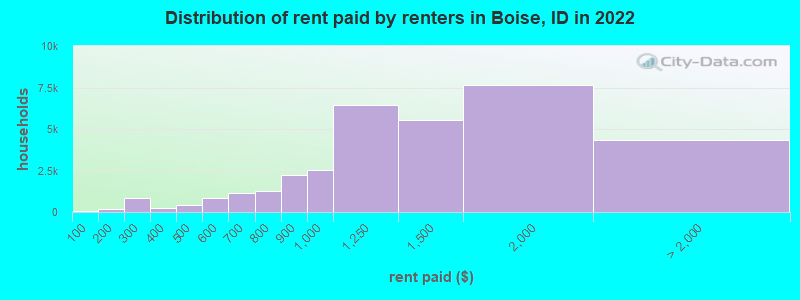
Home value of owner - occupied houses in 2022 in Boise, ID 422 Less than $10,00093 $10,000 to $14,99999 $15,000 to $19,999100 $20,000 to $24,999418 $25,000 to $29,999130 $30,000 to $34,99974 $35,000 to $39,999217 $40,000 to $49,999265 $50,000 to $59,99946 $60,000 to $69,999219 $70,000 to $79,999169 $80,000 to $89,999111 $90,000 to $99,999854 $100,000 to $124,999389 $125,000 to $149,999750 $150,000 to $174,999593 $175,000 to $199,999932 $200,000 to $249,9991,461 $250,000 to $299,9999,046 $300,000 to $399,99916,356 $400,000 to $499,99920,119 $500,000 to $749,9996,746 $750,000 to $999,9993,520 $1,000,000 to $1,499,9991,287 $1,500,000 to $1,999,999751 $2,000,000 or moreRent paid by renters in 2022 in Boise, ID 85 Less than $10063 $100 to $14994 $150 to $199225 $200 to $249646 $250 to $29995 $300 to $349125 $350 to $399300 $400 to $449107 $450 to $499438 $500 to $549413 $550 to $599622 $600 to $649506 $650 to $699510 $700 to $749780 $750 to $7992,230 $800 to $8992,559 $900 to $9996,451 $1,000 to $1,2495,545 $1,250 to $1,4997,674 $1,500 to $1,9992,558 $2,000 to $2,499361 $2,500 to $2,99991 $3,000 to $3,499239 $3,500 or more1,108 No cash rent
Percentage of workers working in this county: 93.3%Number of people working at home: 22,357 (17.2% of all workers )
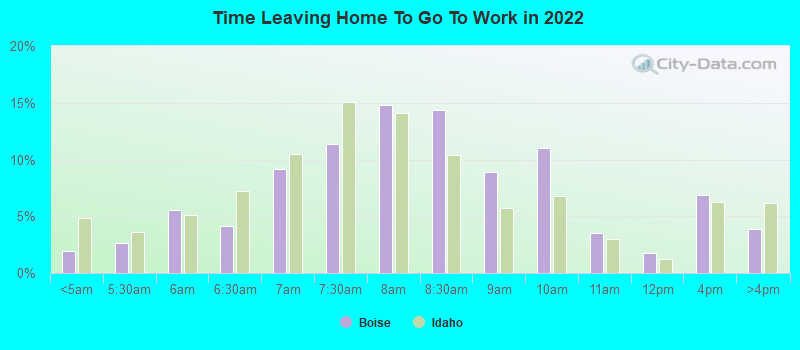
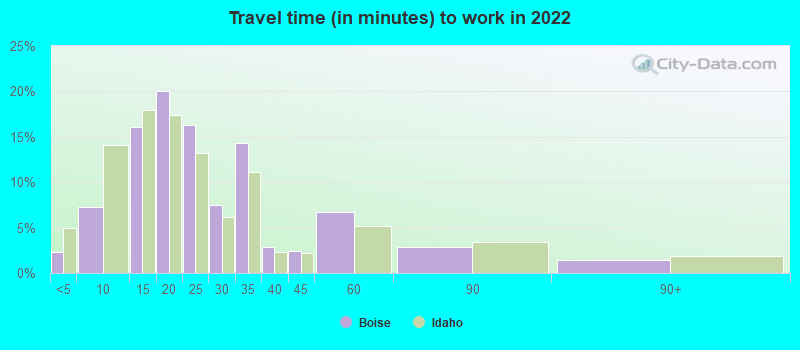
Travel time to work (commute)
Less than 5 minutes: 2,3675 to 9 minutes: 10,94310 to 14 minutes: 26,97815 to 19 minutes: 27,61920 to 24 minutes: 15,21725 to 29 minutes: 6,73130 to 34 minutes: 10,53635 to 39 minutes: 1,31740 to 44 minutes: 63145 to 59 minutes: 1,55460 to 89 minutes: 1,99390 or more minutes: 1,976
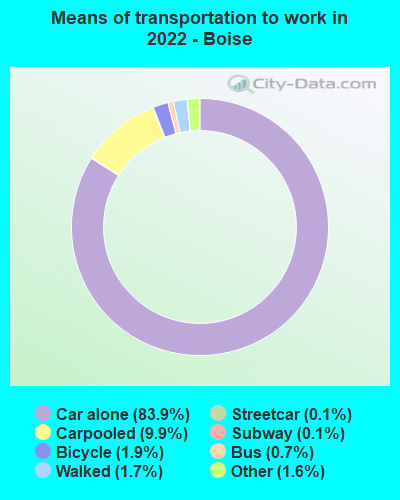
Means of transportation to work:
Drove a car alone: 122,328 (72.7%)Carpooled: 14,471 (8.6%)Bus : 988 (0.6%)Subway or elevated rail : 180 (0.1%)Long-distance train or commuter rail : 207 (0.1%)Taxi: 2,380 (1.4%)Bicycle: 2,727 (1.6%)Walked: 2,541 (1.5%)Worked at home: 22,357 (13.3%)
Unemployment by race in 2022
Unemployment rate for White non-Hispanic residents 2.6% Males1.1% FemalesUnemployment rate for Black residents 3.4% Males6.8% FemalesUnemployment rate for American Indian and Alaska Native residents 6.2% Males10.1% FemalesUnemployment rate for Asian residents 0.0% Males4.6% FemalesUnemployment rate for other race residents 1.7% Males4.9% FemalesUnemployment rate for two or more race residents 4.8% Males1.0% FemalesUnemployment rate for Hispanic or Latino residents 3.3% Males1.6% Females
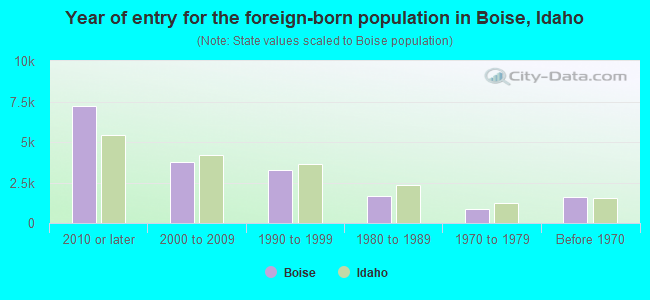
Year of entry for the foreign-born population in Boise, Idaho
7,231 2010 or later 3,745 2000 to 2009 3,244 1990 to 1999 1,691 1980 to 1989 853 1970 to 1979 1,589 Before 1970
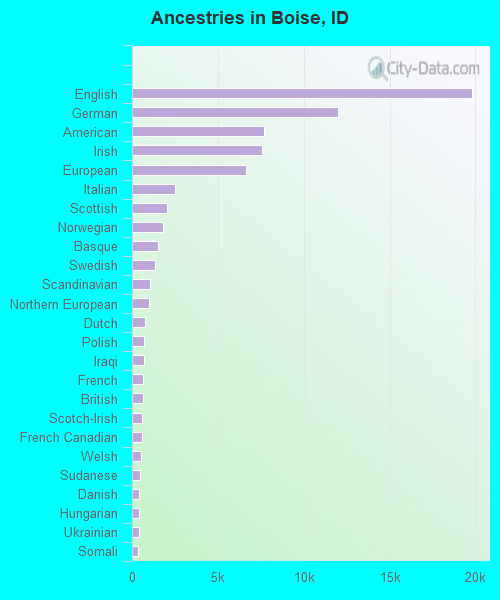
First ancestries reported:
English: 19,802 (19.4%)
German: 12,012 (11.8%)
American: 7,710 (7.6%)
Irish: 7,565 (7.4%)
European: 6,653 (6.5%)
Italian: 2,527 (2.5%)
Scottish: 2,062 (2.0%)
Norwegian: 1,816 (1.8%)
Basque: 1,488 (1.5%)
Swedish: 1,318 (1.3%)
Scandinavian: 1,065 (1.0%)
Northern European: 995 (1.0%)
Dutch: 747 (0.7%)
Polish: 722 (0.7%)
Iraqi: 711 (0.7%)
French: 668 (0.7%)
British: 644 (0.6%)
Scotch-Irish: 605 (0.6%)
French Canadian: 572 (0.6%)
Welsh: 523 (0.5%)
Sudanese: 486 (0.5%)
Danish: 420 (0.4%)
Hungarian: 417 (0.4%)
Ukrainian: 384 (0.4%)
Somali: 340 (0.3%)
Czech: 301 (0.3%)
Eastern European: 297 (0.3%)
Greek: 264 (0.3%)
Arab: 254 (0.2%)
Swiss: 237 (0.2%)
Portuguese: 224 (0.2%)
African: 220 (0.2%)
Romanian: 212 (0.2%)
Canadian: 210 (0.2%)
Russian: 167 (0.2%)
Yugoslavian: 162 (0.2%)
Ethiopian: 161 (0.2%)
Brazilian: 160 (0.2%)
Lithuanian: 152 (0.1%)
Nigerian: 149 (0.1%)
Afghan: 146 (0.1%)
Iranian: 143 (0.1%)
Slovak: 121 (0.1%)
Syrian: 112 (0.1%)
Croatian: 107 (0.1%)
Serbian: 106 (0.1%)
Armenian: 97 (0.10%)
Lebanese: 90 (0.09%)
Haitian: 90 (0.09%)
Bulgarian: 87 (0.09%)
Slavic: 84 (0.08%)
Jamaican: 67 (0.07%)
Austrian: 61 (0.06%)
Icelander: 60 (0.06%)
Finnish: 59 (0.06%)
Australian: 52 (0.05%)
Czechoslovakian: 50 (0.05%)
Belgian: 49 (0.05%)
Pennsylvania German: 46 (0.05%)
Jordanian: 46 (0.05%)
South African: 40 (0.04%)
Cajun: 34 (0.03%)
Celtic: 29 (0.03%)
Turkish: 26 (0.03%)
Luxembourger: 20 (0.02%)
Slovene: 14 (0.01%)
Albanian: 13 (0.01%)
Cape Verdean: 11 (0.01%)
German Russian: 10 (0.01%)
Moroccan: 7 (0.01%)
Latvian: 6 (0.01%)
Most common places of birth for foreign-born residents (%): Mexico Boise:
16.8% (2,682)Idaho:
49.9% (53,107)
India Boise:
6.9% (1,107)Idaho:
2.0% (2,143)
Canada Boise:
6.7% (1,075)Idaho:
5.2% (5,503)
Iraq Boise:
6.1% (976)Idaho:
1.5% (1,626)
China, excluding Hong Kong and Taiwan Boise:
5.6% (901)Idaho:
2.1% (2,219)
Korea Boise:
3.1% (503)Idaho:
1.7% (1,802)
Germany Boise:
3.0% (479)Idaho:
2.4% (2,535)
Laos Boise:
2.8% (441)Idaho:
0.9% (956)
Philippines Boise:
2.7% (430)Idaho:
2.1% (2,230)
Vietnam Boise:
2.3% (365)Idaho:
1.2% (1,257)
Japan Boise:
2.2% (356)Idaho:
0.8% (867)
Colombia Boise:
2.2% (352)Idaho:
1.2% (1,289)
Nepal Boise:
2.0% (323)Idaho:
1.0% (1,091)
England Boise:
1.5% (244)Idaho:
1.5% (1,595)
Place of birth for U.S.-born residents:
This state: 96,259Other state: 120,997Northeast: 8,798Midwest: 20,352South: 16,088West: 75,759 82.6% of Boise residents lived in the same house 1 years ago.
Out of people who lived in different houses, 38.0% lived in this county.
Out of people who lived in different counties, 39.2% lived in Idaho.
Boise:
82.6%State average:
85.1%
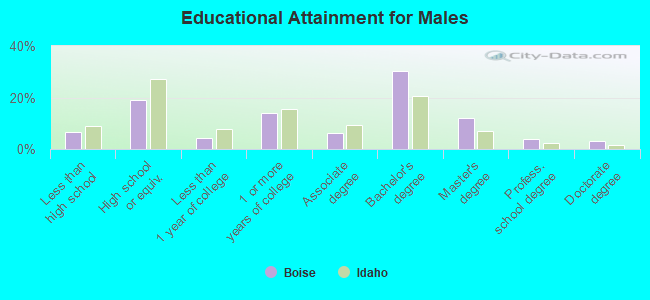
Education attainment for males 25 years and older:
No schooling: 1,627Nursery to 4th grade: 05th and 6th grade: 6327th and 8th grade: 3589th grade: 16510th grade: 65411th grade: 1,17912th grade, no diploma: 967High school graduate (or equivalency): 16,136Less than 1 year of college: 3,724Some college more than 1 year, no degree: 11,635Associate degree: 5,353Bachelor's degree: 25,608Master's degree: 10,043Professional school degree: 3,322Doctorate degree: 2,651
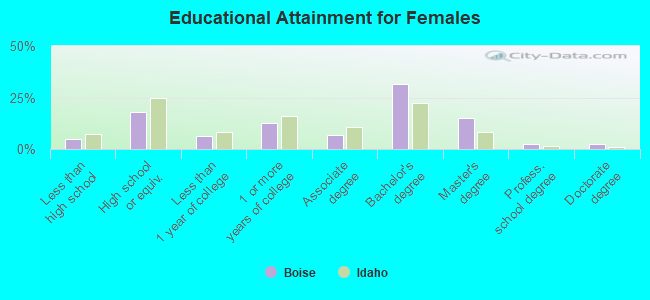
Education attainment for females 25 years and older:
No schooling: 944Nursery to 4th grade: 555th and 6th grade: 1627th and 8th grade: 1859th grade: 37010th grade: 78911th grade: 39712th grade, no diploma: 1,244High school graduate (or equivalency): 15,075Less than 1 year of college: 5,344Some college more than 1 year, no degree: 10,334Associate degree: 5,669Bachelor's degree: 26,246Master's degree: 12,340Professional school degree: 1,887Doctorate degree: 2,019
Housing units in structures:
One, detached: 70,240One, attached: 6,398Two: 2,7713 or 4: 5,4915 to 9: 2,91010 to 19: 3,27820 to 49: 4,39250 or more: 4,762Mobile homes: 4,423Median worth of mobile homes: $109,200
Housing units lacking complete plumbing facilities in 2022: 0.9%Housing units lacking complete kitchen facilities in 2022: 1.5%House/condo owner moved in on average 9 years ago
Renter moved in on average 2 years ago
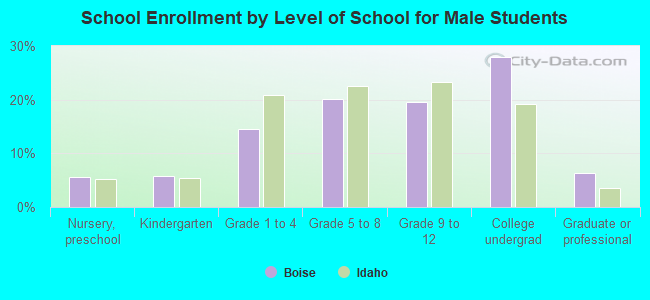
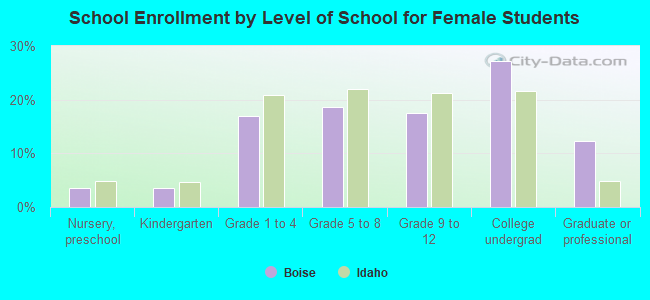
Private vs. public school enrollment:
Students in private schools in grades 1 to 8 (elementary and middle school): 2,433 Students in private schools in grades 9 to 12 (high school): 2,347 Students in private undergraduate colleges: 1,407