Blairsville, PA (Pennsylvania) Houses and Residents
| Blairsville: | $103,480 |
| Pennsylvania: | $245,500 |
Total population: 3,327 (All urban)
Houses: 1,783 (1,494 occupied: 868 owner occupied, 616 renter occupied)
| % of renters here: | 42% |
| State: | 31% |
Housing density: 1,281 houses/condos per square mile
Median price asked for vacant for-sale houses and condos in 2022 in this county: $5,044.
Median contract rent in 2022: $490 (lower quartile is $319, upper quartile is $594)
Median rent asked for vacant for-rent units in 2022: $772
Median gross rent in Blairsville, PA in 2022: $549
Housing units in Blairsville with a mortgage: 424 (67 second mortgage, 0 home equity loan, 62 both second mortgage and home equity loan)
Houses without a mortgage: 20
Median household income for houses/condos with a mortgage: $68,601
Median household income for apartments without a mortgage: $62,658
Median monthly housing costs: $602
Compare current foreclosures near Blairsville, PA:
| Photo | Address | Area | Beds / Baths | Price | Details |
|---|---|---|---|---|---|

|
#1
Maple Ave
Blairsville, PA 15717
|
1,056 sq. feet
|
1 baths 2 beds |
show details | |

|
#2
Strangford Rd
Blairsville, PA 15717
|
- sq. feet
|
1 baths 2 beds |
show details | |

|
#3
E Brown St
Blairsville, PA 15717
|
- sq. feet
|
2 baths 3 beds |
show details | |

|
#4
N Walnut St
Blairsville, PA 15717
|
- sq. feet
|
- baths - beds |
show details | |

|
#5
Morewood Ave
Blairsville, PA 15717
|
- sq. feet
|
- baths - beds |
show details | |

|
#6
Ruffner Pl
Blairsville, PA 15717
|
- sq. feet
|
- baths - beds |
show details | |

|
#7
E Campbell St
Blairsville, PA 15717
|
- sq. feet
|
- baths - beds |
show details | |

|
#8
Morewood Ave
Blairsville, PA 15717
|
- sq. feet
|
- baths - beds |
show details | |

|
#9
Maple Ave
Blairsville, PA 15717
|
- sq. feet
|
- baths - beds |
show details | |

|
#10
Trolley St
Blairsville, PA 15717
|
- sq. feet
|
- baths - beds |
show details |
| Photo | Address | Area | Beds / Baths | Price | Details |
|---|---|---|---|---|---|

|
#11
Airport Rd Apt 7
Blairsville, PA 15717
|
- sq. feet
|
- baths - beds |
show details | |

|
#12
Wheeler Ln
Latrobe, PA 15650
|
2,212 sq. feet
|
2 baths 3 beds |
$52,500
|
show details |

|
#13
Chestnut Ridge Rd
Blairsville, PA 15717
|
- sq. feet
|
- baths - beds |
show details | |

|
#14
Mt Tabor Rd
Blairsville, PA 15717
|
- sq. feet
|
- baths - beds |
show details | |

|
#15
W 4th Ave
Derry, PA 15627
|
- sq. feet
|
1 baths 4 beds |
$39,900
|
show details |

|
#16
Railroad St
Derry, PA 15627
|
- sq. feet
|
1 baths 3 beds |
$33,300
|
show details |

|
#17
Westmoreland Ave
Avonmore, PA 15618
|
1,824 sq. feet
|
2 baths 4 beds |
show details | |

|
#18
Pauline Dr
Saltsburg, PA 15681
|
1,220 sq. feet
|
2 baths 3 beds |
show details | |

|
#19
Miller St
Latrobe, PA 15650
|
- sq. feet
|
2 baths 2 beds |
show details | |

|
#20
Main St
Latrobe, PA 15650
|
1,256 sq. feet
|
1 baths 3 beds |
show details |
| Photo | Address | Area | Beds / Baths | Price | Details |
|---|---|---|---|---|---|

|
#21
Moween Rd
Saltsburg, PA 15681
|
1,876 sq. feet
|
2 baths 3 beds |
show details | |

|
#22
Pine St
Homer City, PA 15748
|
1,316 sq. feet
|
1 baths 3 beds |
show details | |

|
#23
Route 259
Bolivar, PA 15923
|
1,574 sq. feet
|
2 baths 3 beds |
show details | |

|
#24
Indiana Avenue Ext
Avonmore, PA 15618
|
- sq. feet
|
2 baths 4 beds |
show details | |

|
#25
Kings Rd
Apollo, PA 15613
|
900 sq. feet
|
1 baths 2 beds |
show details | |

|
#26
W 2nd Ave
Derry, PA 15627
|
- sq. feet
|
1 baths 3 beds |
show details | |

|
#27
Byron Pl
Indiana, PA 15701
|
- sq. feet
|
2 baths 3 beds |
show details | |

|
#28
Lone Star Ln
Rector, PA 15677
|
- sq. feet
|
1 baths 2 beds |
show details | |

|
#29
Unity St
Latrobe, PA 15650
|
- sq. feet
|
1 baths 5 beds |
show details | |

|
#30
Route 30
Ligonier, PA 15658
|
- sq. feet
|
- baths - beds |
show details |
| Photo | Address | Area | Beds / Baths | Price | Details |
|---|---|---|---|---|---|

|
#31
Theo St
Derry, PA 15627
|
- sq. feet
|
- baths - beds |
show details | |

|
#32
Washington St
Seward, PA 15954
|
- sq. feet
|
- baths - beds |
show details | |

|
#33
Sequoia Ct
Latrobe, PA 15650
|
- sq. feet
|
- baths - beds |
show details | |

|
#34
Washington St
Seward, PA 15954
|
- sq. feet
|
- baths - beds |
show details | |

|
#35
Westview Dr
Ligonier, PA 15658
|
- sq. feet
|
- baths - beds |
show details | |

|
#36
Stormer Rd
Indiana, PA 15701
|
- sq. feet
|
- baths - beds |
show details | |

|
#37
S Ridge Rd
Shelocta, PA 15774
|
- sq. feet
|
- baths - beds |
show details | |

|
#38
N Shenandoah Dr Apt 201
Latrobe, PA 15650
|
- sq. feet
|
- baths - beds |
show details | |

|
#39
Indiana Ave
Avonmore, PA 15618
|
- sq. feet
|
- baths - beds |
show details | |

|
#40
Indiana Ave
Avonmore, PA 15618
|
- sq. feet
|
- baths - beds |
show details |
| Photo | Address | Area | Beds / Baths | Price | Details |
|---|---|---|---|---|---|

|
#41
Allegheny Ave
Avonmore, PA 15618
|
- sq. feet
|
- baths - beds |
show details | |

|
#42
Iselin Rd
Saltsburg, PA 15681
|
- sq. feet
|
- baths - beds |
show details | |

|
#43
Alpha Ln
Ligonier, PA 15658
|
- sq. feet
|
- baths - beds |
show details | |

|
#44
Roskovensky Rd
Latrobe, PA 15650
|
- sq. feet
|
- baths - beds |
show details | |

|
#45
E 3rd St
Derry, PA 15627
|
- sq. feet
|
- baths - beds |
show details | |

|
#46
Lucerne Rd
Indiana, PA 15701
|
- sq. feet
|
- baths - beds |
show details | |

|
#47
Hopewell Ave
Saltsburg, PA 15681
|
- sq. feet
|
- baths - beds |
show details | |

|
#48
Route 56 Hwy E
Homer City, PA 15748
|
- sq. feet
|
- baths - beds |
show details | |

|
#49
Pine Dr
New Alexandria, PA 15670
|
- sq. feet
|
- baths - beds |
show details | |

|
Check over 1 million property listings on Foreclosure.com!
|
browse all offers | |||

Latest news about housing in Blairsville, PA collected exclusively by city-data.com from local newspapers, TV, and radio stations

 | Does Pennsylvania need less school districts? (42 replies) |
| PA population loss and retention - merged threads (112 replies) |
| Poll: Would you live in Pennsylvania if it weren't for family roots? (252 replies) |
| johnstown. pa (48 replies) |
| Moving to Pennsylvania in early 2016 (20 replies) |
| Will State College Become Pennsylvania's "Third" region? (29 replies) |

Median year apartment built: 1954
Household type by relationship:
Households: 3,198- Male householders: 646 (257 living alone), Female householders: 841 (300 living alone)
581 spouses (570 opposite-sex spouses), 131 unmarried partners, (131 opposite-sex unmarried partners), 572 children (539 natural, 0 adopted, 33 stepchildren), 133 grandchildren, 71 brothers or sisters, 39 parents, 0 foster children, 75 other relatives, 103 non-relatives
Size of family households: 502 2-persons, 169 3-persons, 67 4-persons, 31 5-persons, 5 6-persons, 24 7-or-more-persons.
Size of nonfamily households: 547 1-person, 147 2-persons.
166 married couples with children.
225 single-parent households (10 men, 215 women).
99.2% of residents of Blairsville speak English at home.
0.2% of residents speak other Indo-European language at home (100% speak English well).
0.2% of residents speak Asian or Pacific Island language at home (100% speak English well).
Foreign born population: 7 (0.2%)
(85.7% of them are naturalized citizens)
| Here: | 6.3 |
| State: | 6.8 |
| Here: | 4.3 |
| State: | 4.3 |

- Bedrooms in owner-occupied houses and condos in Blairsville, Pennsylvania
- 0no bedroom
- 91 bedroom
- 2782 bedrooms
- 4533 bedrooms
- 1094 bedrooms
- 205+ bedrooms

- Bedrooms in renter-occupied apartments in Blairsville, Pennsylvania
- 50no bedroom
- 1481 bedroom
- 2592 bedrooms
- 1263 bedrooms
- 344 bedrooms
- 05+ bedrooms

- Cars and other vehicles available in Blairsville in owner-occupied houses/condos
- 16no vehicle
- 2171 vehicle
- 5082 vehicles
- 613 vehicles
- 554 vehicles
- 125+ vehicles

- Cars and other vehicles available in Blairsville in renter-occupied apartments
- 195no vehicle
- 3201 vehicle
- 1022 vehicles
- 03 vehicles
- 04 vehicles
- 05+ vehicles

- Rooms in owner-occupied houses in Blairsville, Pennsylvania
- 01 room
- 02 rooms
- 03 rooms
- 394 rooms
- 1285 rooms
- 3646 rooms
- 1557 rooms
- 858 rooms
- 979+ rooms

- Rooms in renter-occupied apartments in Blairsville, Pennsylvania
- 501 room
- 122 rooms
- 1063 rooms
- 1624 rooms
- 1135 rooms
- 716 rooms
- 487 rooms
- 418 rooms
- 159+ rooms


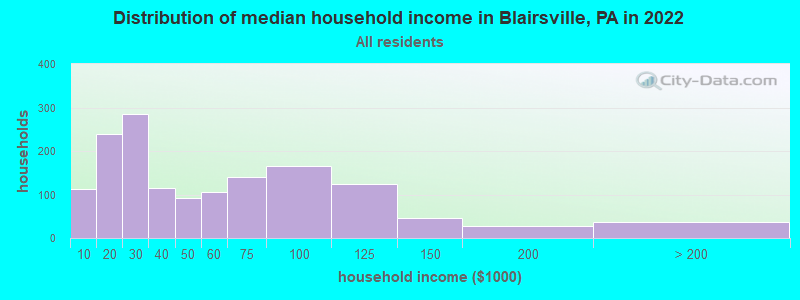
Blairsville, PA household income distribution

- 113Less than $10,000
- 240$10,000 to $19,999
- 286$20,000 to $29,999
- 115$30,000 to $39,999
- 93$40,000 to $49,999
- 105$50,000 to $59,999
- 141$60,000 to $74,999
- 166$75,000 to $99,999
- 124$100,000 to $124,999
- 46$125,000 to $149,999
- 27$150,000 to $199,999
- 36$200,000 or more
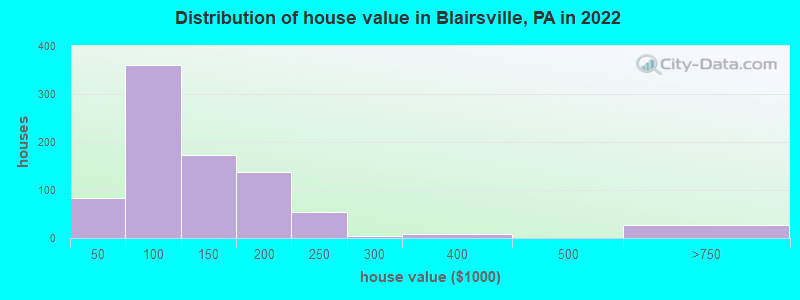
Home value of owner - occupied houses in 2022 in Blairsville, PA
-
- 11Less than $10,000
- 13$10,000 to $14,999
- 5$20,000 to $24,999
- 11$25,000 to $29,999
- 14$30,000 to $34,999
- 12$35,000 to $39,999
- 12$40,000 to $49,999
- 99$50,000 to $59,999
- 72$60,000 to $69,999
- 93$70,000 to $79,999
- 48$80,000 to $89,999
- 34$90,000 to $99,999
- 99$100,000 to $124,999
- 72$125,000 to $149,999
- 106$150,000 to $174,999
- 32$175,000 to $199,999
- 53$200,000 to $249,999
- 4$250,000 to $299,999
- 8$300,000 to $399,999
- 28$500,000 to $749,999
Rent paid by renters in 2022 in Blairsville, PA
-
- 73Less than $100
- 8$100 to $149
- 13$150 to $199
- 39$250 to $299
- 15$300 to $349
- 32$350 to $399
- 73$400 to $449
- 8$450 to $499
- 90$500 to $549
- 6$550 to $599
- 77$600 to $649
- 33$650 to $699
- 34$700 to $749
- 21$750 to $799
- 35$800 to $899
- 6$900 to $999
- 25$1,000 to $1,249
- 64No cash rent


Percentage of workers working in this county: 61.7%
Number of people working at home: 37 (2.5% of all workers)
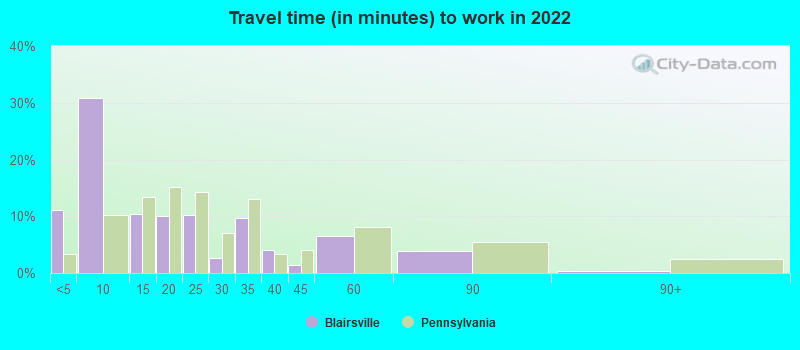
Travel time to work (commute)
- Less than 5 minutes: 95
- 5 to 9 minutes: 382
- 10 to 14 minutes: 203
- 15 to 19 minutes: 49
- 20 to 24 minutes: 262
- 25 to 29 minutes: 67
- 30 to 34 minutes: 203
- 35 to 39 minutes: 28
- 40 to 44 minutes: 89
- 45 to 59 minutes: 59
- 60 to 89 minutes: 47
- 90 or more minutes: 31
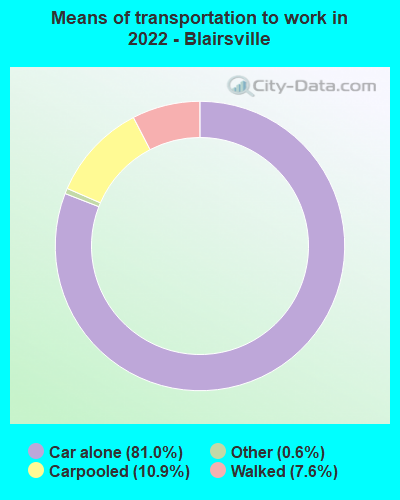
Means of transportation to work:
- Drove a car alone: 1,110 (76.7%)
- Carpooled: 148 (10.2%)
- Taxi: 9 (0.6%)
- Walked: 104 (7.2%)
- Worked at home: 37 (2.6%)

- Unemployment by race in 2022
- Unemployment rate for White non-Hispanic residents
- 3.6%Males
- 1.6%Females

- Year of entry for the foreign-born population in Blairsville, Pennsylvania
- 02010 or later
- 02000 to 2009
- 01990 to 1999
- 71980 to 1989
- 01970 to 1979
- 13Before 1970

First ancestries reported:
- German: 314 (26.1%)
- English: 180 (15.0%)
- Italian: 162 (13.5%)
- Irish: 106 (8.8%)
- American: 55 (4.6%)
- Pennsylvania German: 42 (3.5%)
- Scottish: 37 (3.1%)
- Scotch-Irish: 25 (2.1%)
- Eastern European: 21 (1.7%)
- Czechoslovakian: 20 (1.7%)
- British: 19 (1.6%)
- Ukrainian: 12 (1.0%)
- Polish: 9 (0.7%)
Most common places of birth for foreign-born residents (%):
| Blairsville: | 100.0% (6) |
| Pennsylvania: | 3.3% (31,542) |
Place of birth for U.S.-born residents:
- This state: 2,832
- Other state: 289
- Northeast: 109
- Midwest: 22
- South: 168
- West: 6
85.2% of Blairsville residents lived in the same house 1 years ago.
Out of people who lived in different houses, 36.2% lived in this county.
Out of people who lived in different counties, 100.0% lived in Pennsylvania.
| Blairsville: | 85.2% |
| State average: | 89.3% |
Education attainment for males 25 years and older:
- No schooling: 33
- Nursery to 4th grade: 0
- 5th and 6th grade: 0
- 7th and 8th grade: 0
- 9th grade: 18
- 10th grade: 10
- 11th grade: 8
- 12th grade, no diploma: 0
- High school graduate (or equivalency): 533
- Less than 1 year of college: 82
- Some college more than 1 year, no degree: 105
- Associate degree: 138
- Bachelor's degree: 159
- Master's degree: 11
- Professional school degree: 36
- Doctorate degree: 0

Education attainment for females 25 years and older:
- No schooling: 13
- Nursery to 4th grade: 0
- 5th and 6th grade: 0
- 7th and 8th grade: 0
- 9th grade: 6
- 10th grade: 0
- 11th grade: 47
- 12th grade, no diploma: 9
- High school graduate (or equivalency): 793
- Less than 1 year of college: 78
- Some college more than 1 year, no degree: 137
- Associate degree: 92
- Bachelor's degree: 158
- Master's degree: 70
- Professional school degree: 26
- Doctorate degree: 0


Housing units in structures:
- One, detached: 1,179
- One, attached: 85
- Two: 182
- 3 or 4: 72
- 5 to 9: 60
- 10 to 19: 37
- 20 to 49: 102
- 50 or more: 42
- Mobile homes: 17
House/condo owner moved in on average 23 years ago
Renter moved in on average 1 years ago

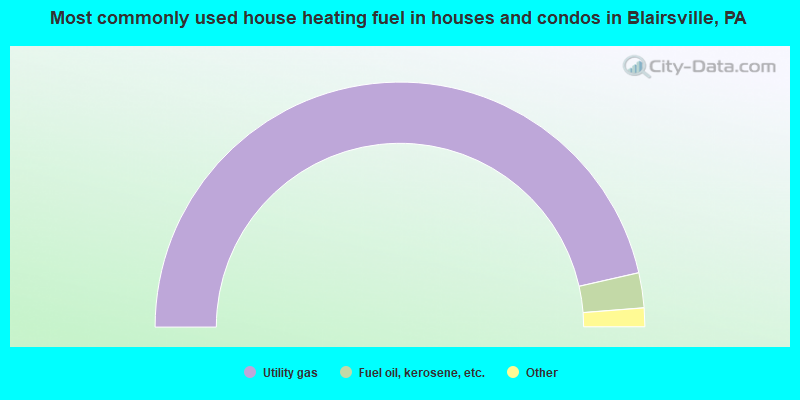
- 93.0%Utility gas
- 4.6%Fuel oil, kerosene, etc.
- 2.1%Electricity
- 0.3%Bottled, tank, or LP gas
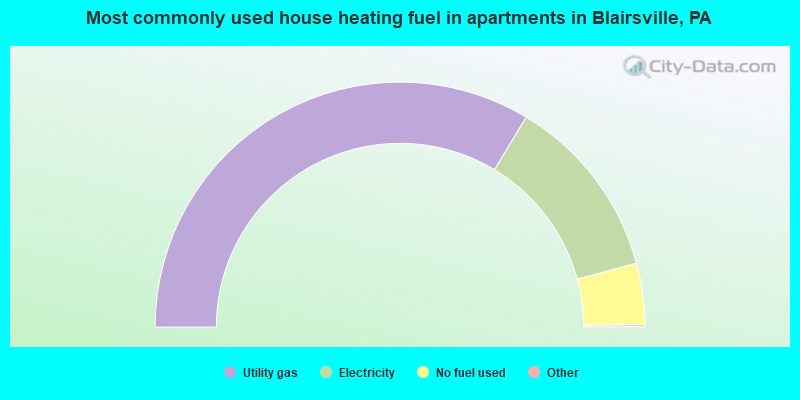
- 67.5%Utility gas
- 24.5%Electricity
- 8.1%No fuel used
Private vs. public school enrollment:
| Here: | 2.4% |
| Pennsylvania: | 15.7% |
| Here: | 7.3% |
| Pennsylvania: | 13.4% |
| Here: | 92.4% |
| Pennsylvania: | 39.8% |


