Blacksburg, VA (Virginia) Houses and Residents
| Blacksburg: | $454,644 |
| Virginia: | $365,700 |
Mean price in 2022:
Detached houses: $424,388
Here: $424,388 State: $472,865 Townhouses or other attached units: $279,823
Here: $279,823 State: $457,437 In 5-or-more-unit structures: $204,018
Here: $204,018 State: $382,551 Mobile homes: $2,101
Here: $2,101 State: $100,736
Total population: 43,985 (Urban population: 38,609, Rural population: 784 (15 farm, 769 nonfarm))
Houses: 16,805 (13,764 occupied: 4,477 owner occupied, 9,016 renter occupied)
| % of renters here: | 67% |
| State: | 33% |
Housing density: 868 houses/condos per square mile
Median price asked for vacant for-sale houses and condos in 2022: $216,383.
Median contract rent in 2022: $1,146 (lower quartile is $852, upper quartile is $1,499)
Median rent asked for vacant for-rent units in 2022: $2,796
Median gross rent in Blacksburg, VA in 2022: $1,216
Housing units in Blacksburg with a mortgage: 2,432 (124 second mortgage, 0 home equity loan, 77 both second mortgage and home equity loan)
Houses without a mortgage: 108
Median household income for houses/condos with a mortgage: $154,891
Median household income for apartments without a mortgage: $127,499
Median monthly housing costs: $1,194
Compare current foreclosures near Blacksburg, VA:
| Photo | Address | Area | Beds / Baths | Price | Details |
|---|---|---|---|---|---|

|
#1
Mccoy Rd
Blacksburg, VA 24060
|
1,600 sq. feet
|
1 baths 3 beds |
show details | |

|
#2
Huff Ln
Blacksburg, VA 24060
|
1,296 sq. feet
|
2 baths 3 beds |
show details | |

|
#3
Hutcheson Dr
Blacksburg, VA 24060
|
2,889 sq. feet
|
3 baths 3 beds |
show details | |

|
#4
Prices Fork Rd
Blacksburg, VA 24060
|
1,504 sq. feet
|
1 baths 3 beds |
show details | |

|
#5
Duluth Rd
Blacksburg, VA 24060
|
1,512 sq. feet
|
2 baths 3 beds |
show details | |

|
#6
Calico Ln
Blacksburg, VA 24060
|
1,608 sq. feet
|
2 baths 3 beds |
show details | |

|
#7
Harding Rd
Blacksburg, VA 24060
|
2,236 sq. feet
|
1 baths 3 beds |
show details | |

|
#8
Whitethorne Rd
Blacksburg, VA 24060
|
1,232 sq. feet
|
1 baths 2 beds |
show details | |

|
#9
Kelsey Ln
Blacksburg, VA 24060
|
- sq. feet
|
- baths - beds |
show details | |

|
#10
Canyon Ridge Rd, Apt 102
Blacksburg, VA 24060
|
- sq. feet
|
- baths - beds |
show details |
| Photo | Address | Area | Beds / Baths | Price | Details |
|---|---|---|---|---|---|

|
#11
Yorkshire Ct
Blacksburg, VA 24060
|
- sq. feet
|
- baths - beds |
show details | |

|
#12
Merrimac Rd Lot 1
Blacksburg, VA 24060
|
- sq. feet
|
- baths - beds |
show details | |

|
#13
Maxine St
Blacksburg, VA 24060
|
- sq. feet
|
- baths - beds |
show details | |

|
#14
Blossom Trl E
Blacksburg, VA 24060
|
- sq. feet
|
- baths - beds |
show details | |

|
#15
Brooksfield Rd
Blacksburg, VA 24060
|
- sq. feet
|
- baths - beds |
show details | |

|
#16
Quartz Ln
Blacksburg, VA 24060
|
- sq. feet
|
- baths - beds |
show details | |

|
#17
Peppers Ferry Blvd
Radford, VA 24141
|
840 sq. feet
|
1 baths 2 beds |
show details | |

|
#18
Martins Creek Rd
Roanoke, VA 24018
|
1,962 sq. feet
|
2 baths 3 beds |
show details | |

|
#19
Union Valley Rd
Riner, VA 24149
|
1,440 sq. feet
|
2 baths 2 beds |
show details | |

|
#20
Springview Dr
Christiansburg, VA 24073
|
960 sq. feet
|
1 baths 3 beds |
show details |
| Photo | Address | Area | Beds / Baths | Price | Details |
|---|---|---|---|---|---|

|
#21
Mud Pike
Christiansburg, VA 24073
|
1,457 sq. feet
|
1 baths 3 beds |
show details | |

|
#22
Catawba Rd
Catawba, VA 24070
|
2,284 sq. feet
|
2 baths 4 beds |
show details | |

|
#23
Flick Dr
Shawsville, VA 24162
|
982 sq. feet
|
1 baths 2 beds |
show details | |

|
#24
Helm Dr
Elliston, VA 24087
|
1,896 sq. feet
|
2 baths 3 beds |
show details | |

|
#25
Eggleston Rd
Pembroke, VA 24136
|
1,152 sq. feet
|
2 baths 3 beds |
show details | |

|
#26
Union Valley Rd
Riner, VA 24149
|
1,120 sq. feet
|
1 baths 3 beds |
show details | |

|
#27
Darnell Mountain Rd
Ripplemead, VA 24150
|
2,128 sq. feet
|
2 baths 3 beds |
show details | |

|
#28
Schoolhouse Dr
Riner, VA 24149
|
1,984 sq. feet
|
3 baths 4 beds |
show details | |

|
#29
Mountain Field Rd
Pearisburg, VA 24134
|
- sq. feet
|
2 baths 3 beds |
show details | |

|
#30
Horseshoe Farm Rd
Pembroke, VA 24136
|
3,678 sq. feet
|
3 baths 4 beds |
show details |
| Photo | Address | Area | Beds / Baths | Price | Details |
|---|---|---|---|---|---|

|
#31
Divine Dr
Christiansburg, VA 24073
|
3,339 sq. feet
|
3 baths 4 beds |
show details | |

|
#32
Weston Rd
Riner, VA 24149
|
1,488 sq. feet
|
2 baths 3 beds |
show details | |

|
#33
Big Branch Rd
Riner, VA 24149
|
1,296 sq. feet
|
2 baths 3 beds |
show details | |

|
#34
Cherokee Hills Dr
Salem, VA 24153
|
1,827 sq. feet
|
4 baths 4 beds |
show details | |

|
#35
Mahone St # 1
Christiansburg, VA 24073
|
1,272 sq. feet
|
2 baths 4 beds |
show details | |

|
#36
Dolphus Ave
Dublin, VA 24084
|
- sq. feet
|
1 baths 3 beds |
show details | |

|
#37
Leather Rd
Christiansburg, VA 24073
|
2,352 sq. feet
|
2 baths 3 beds |
show details | |

|
#38
Cambria St NE
Christiansburg, VA 24073
|
2,196 sq. feet
|
1 baths 3 beds |
show details | |

|
#39
Brown St
Christiansburg, VA 24073
|
846 sq. feet
|
1 baths 2 beds |
show details | |

|
#40
Huckleberry St
Christiansburg, VA 24073
|
720 sq. feet
|
1 baths 2 beds |
show details |
| Photo | Address | Area | Beds / Baths | Price | Details |
|---|---|---|---|---|---|

|
#41
Massie Dr
Christiansburg, VA 24073
|
1,872 sq. feet
|
2 baths 3 beds |
show details | |

|
#42
Walton Rd
Radford, VA 24141
|
1,836 sq. feet
|
2 baths 3 beds |
show details | |

|
#43
Cambria St NW
Christiansburg, VA 24073
|
2,261 sq. feet
|
2 baths 3 beds |
show details | |

|
#44
Victory Hts
Christiansburg, VA 24073
|
910 sq. feet
|
1 baths 2 beds |
show details | |

|
#45
Madison Ave
Christiansburg, VA 24073
|
2,060 sq. feet
|
3 baths - beds |
show details | |

|
#46
Paris Mountain Rd
Elliston, VA 24087
|
- sq. feet
|
- baths - beds |
show details | |

|
#47
Montgomery St
Christiansburg, VA 24073
|
- sq. feet
|
- baths - beds |
show details | |

|
#48
Johns Creek Rd
New Castle, VA 24127
|
- sq. feet
|
- baths - beds |
show details | |

|
#49
Bunting Ln
Pembroke, VA 24136
|
- sq. feet
|
- baths - beds |
show details | |

|
Check over 1 million property listings on Foreclosure.com!
|
browse all offers | |||

Latest news about housing in Blacksburg, VA collected exclusively by city-data.com from local newspapers, TV, and radio stations

 | Relocating for VA homestead/farmstead (56 replies) |
| VT housing (4 replies) |
| Critique our planned move from Blacksburg to NOVA (36 replies) |
| Radford-Blacksburg (24 replies) |
| Blacksburg-Radford-Christiansburg (3 replies) |
| Apartments with Indians around Leesburg and Ashburn Area (35 replies) |

Median year apartment built: 1983
Household type by relationship:
Households: 44,938- Male householders: 7,506 (1,896 living alone), Female householders: 5,750 (2,091 living alone)
4,098 spouses (4,067 opposite-sex spouses), 613 unmarried partners, (539 opposite-sex unmarried partners), 5,038 children (4,831 natural, 57 adopted, 149 stepchildren), 149 grandchildren, 169 brothers or sisters, 244 parents, 0 foster children, 38 other relatives, 11,486 non-relatives
- In group quarters: 9,843
Size of family households: 2,250 2-persons, 1,341 3-persons, 991 4-persons, 487 5-persons, 256 6-persons, 48 7-or-more-persons.
Size of nonfamily households: 3,388 1-person, 2,491 2-persons, 1,252 3-persons, 855 4-persons, 83 5-persons.
3,529 married couples with children.
569 single-parent households (97 men, 472 women).
84.0% of residents of Blacksburg speak English at home.
2.8% of residents speak Spanish at home (94% speak English very well, 5% speak English well, 1% speak English not well).
4.9% of residents speak other Indo-European language at home (77% speak English very well, 20% speak English well, 2% speak English not well).
6.0% of residents speak Asian or Pacific Island language at home (72% speak English very well, 24% speak English well, 3% speak English not well, 1% don't speak English at all).
1.7% of residents speak other language at home (96% speak English very well, 4% speak English well).
Foreign born population: 6,362 (14.2%)
(28.4% of them are naturalized citizens)
| Here: | 7.9 |
| State: | 7.0 |
| Here: | 4.0 |
| State: | 4.3 |
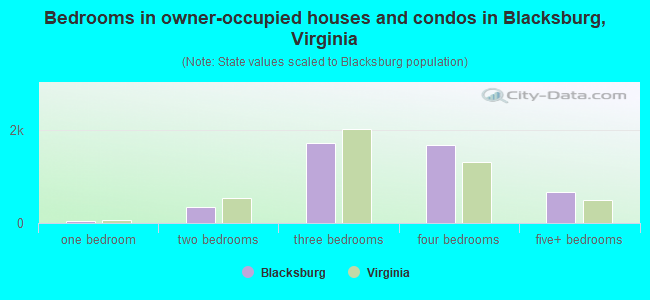
- Bedrooms in owner-occupied houses and condos in Blacksburg, Virginia
- 16no bedroom
- 361 bedroom
- 3482 bedrooms
- 1,7303 bedrooms
- 1,6814 bedrooms
- 6675+ bedrooms

- Bedrooms in renter-occupied apartments in Blacksburg, Virginia
- 220no bedroom
- 1,7431 bedroom
- 3,3522 bedrooms
- 2,2503 bedrooms
- 1,2324 bedrooms
- 2205+ bedrooms

- Cars and other vehicles available in Blacksburg in owner-occupied houses/condos
- 85no vehicle
- 1,1061 vehicle
- 2,0462 vehicles
- 8973 vehicles
- 3044 vehicles
- 405+ vehicles

- Cars and other vehicles available in Blacksburg in renter-occupied apartments
- 789no vehicle
- 3,8651 vehicle
- 2,5392 vehicles
- 1,1883 vehicles
- 5684 vehicles
- 675+ vehicles

- Rooms in owner-occupied houses in Blacksburg, Virginia
- 161 room
- 02 rooms
- 843 rooms
- 2284 rooms
- 3615 rooms
- 5326 rooms
- 6107 rooms
- 9498 rooms
- 1,6979+ rooms

- Rooms in renter-occupied apartments in Blacksburg, Virginia
- 2051 room
- 4892 rooms
- 2,1723 rooms
- 2,6844 rooms
- 1,5775 rooms
- 1,0016 rooms
- 2937 rooms
- 2308 rooms
- 3669+ rooms


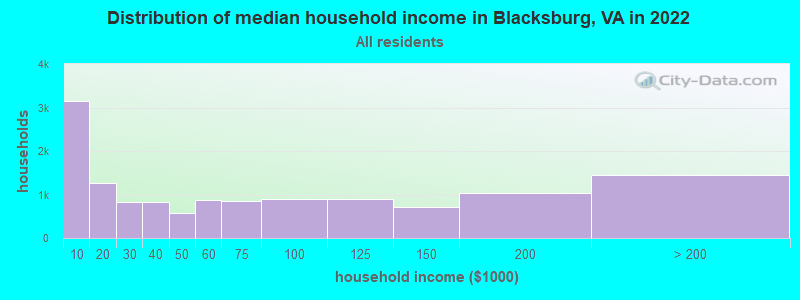
Blacksburg, VA household income distribution

- 3,139Less than $10,000
- 1,264$10,000 to $19,999
- 828$20,000 to $29,999
- 826$30,000 to $39,999
- 564$40,000 to $49,999
- 865$50,000 to $59,999
- 848$60,000 to $74,999
- 889$75,000 to $99,999
- 898$100,000 to $124,999
- 715$125,000 to $149,999
- 1,041$150,000 to $199,999
- 1,448$200,000 or more
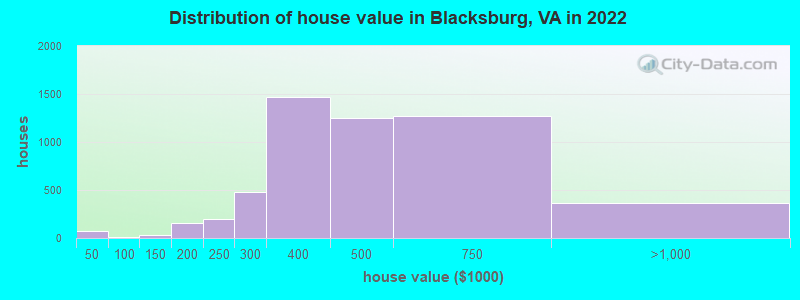
Home value of owner - occupied houses in 2022 in Blacksburg, VA
-
- 53Less than $10,000
- 15$30,000 to $34,999
- 14$80,000 to $89,999
- 16$100,000 to $124,999
- 14$125,000 to $149,999
- 89$150,000 to $174,999
- 70$175,000 to $199,999
- 194$200,000 to $249,999
- 483$250,000 to $299,999
- 1,472$300,000 to $399,999
- 1,250$400,000 to $499,999
- 1,269$500,000 to $749,999
- 347$750,000 to $999,999
- 19$1,000,000 to $1,499,999
Rent paid by renters in 2022 in Blacksburg, VA
-
- 42Less than $100
- 14$250 to $299
- 140$300 to $349
- 68$400 to $449
- 107$450 to $499
- 112$500 to $549
- 207$550 to $599
- 267$600 to $649
- 110$650 to $699
- 533$700 to $749
- 591$750 to $799
- 377$800 to $899
- 891$900 to $999
- 1,694$1,000 to $1,249
- 1,482$1,250 to $1,499
- 1,374$1,500 to $1,999
- 248$2,000 to $2,499
- 375$2,500 to $2,999
- 100$3,000 to $3,499
- 185$3,500 or more
- 143No cash rent


Percentage of workers working in this county: 93.4%
Number of people working at home: 3,469 (19.2% of all workers)
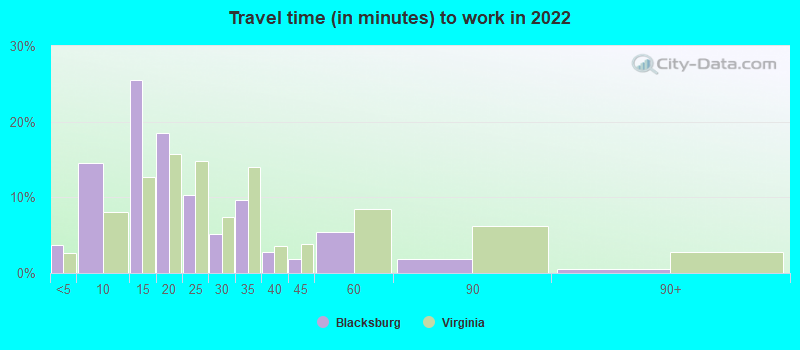
Travel time to work (commute)
- Less than 5 minutes: 1,118
- 5 to 9 minutes: 3,314
- 10 to 14 minutes: 5,067
- 15 to 19 minutes: 2,816
- 20 to 24 minutes: 1,537
- 25 to 29 minutes: 347
- 30 to 34 minutes: 974
- 35 to 39 minutes: 45
- 40 to 44 minutes: 311
- 45 to 59 minutes: 229
- 60 to 89 minutes: 115
- 90 or more minutes: 55
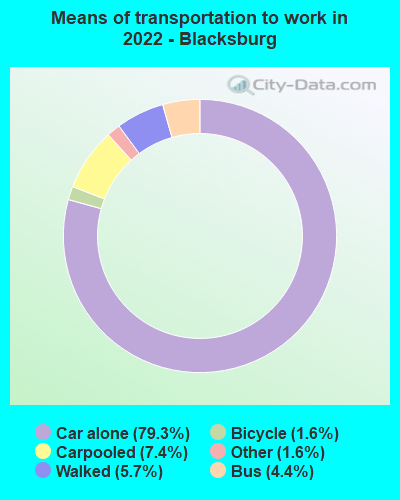
Means of transportation to work:
- Drove a car alone: 21,891 (69.1%)
- Carpooled: 2,140 (6.8%)
- Bus: 1,952 (6.2%)
- Subway or elevated rail: 4 (0.0%)
- Ferryboat: 15 (0.0%)
- Taxi: 974 (3.1%)
- Bicycle: 313 (1.0%)
- Walked: 1,385 (4.4%)
- Worked at home: 3,298 (10.4%)

- Unemployment by race in 2022
- Unemployment rate for White non-Hispanic residents
- 3.8%Males
- 1.8%Females
- Unemployment rate for Black residents
- 0.7%Females
- Unemployment rate for American Indian and Alaska Native residents
- 70.9%Females
- Unemployment rate for Asian residents
- 0.8%Males
- Unemployment rate for other race residents
- 6.0%Males
- Unemployment rate for two or more race residents
- 0.6%Males
- 11.9%Females
- Unemployment rate for Hispanic or Latino residents
- 4.1%Males
- 3.0%Females

- Year of entry for the foreign-born population in Blacksburg, Virginia
- 4,2122010 or later
- 1,1022000 to 2009
- 5651990 to 1999
- 7261980 to 1989
- 1881970 to 1979
- 193Before 1970

First ancestries reported:
- American: 5,419 (23.4%)
- English: 2,169 (9.4%)
- German: 2,062 (8.9%)
- Irish: 1,606 (6.9%)
- Italian: 764 (3.3%)
- European: 671 (2.9%)
- Albanian: 444 (1.9%)
- Polish: 269 (1.2%)
- Arab: 254 (1.1%)
- Egyptian: 228 (1.0%)
- Iranian: 189 (0.8%)
- French: 172 (0.7%)
- African: 134 (0.6%)
- Jamaican: 129 (0.6%)
- Yugoslavian: 126 (0.5%)
- Scottish: 120 (0.5%)
- Swedish: 109 (0.5%)
- Scotch-Irish: 102 (0.4%)
- French Canadian: 102 (0.4%)
- Dutch: 97 (0.4%)
- Danish: 94 (0.4%)
- Norwegian: 77 (0.3%)
- Turkish: 70 (0.3%)
- Austrian: 65 (0.3%)
- Czech: 61 (0.3%)
- Scandinavian: 54 (0.2%)
- British: 40 (0.2%)
- Finnish: 37 (0.2%)
- Eastern European: 36 (0.2%)
- Lebanese: 34 (0.1%)
- Ukrainian: 33 (0.1%)
- Romanian: 32 (0.1%)
- Sudanese: 22 (0.09%)
- Greek: 21 (0.09%)
- Welsh: 21 (0.09%)
- Russian: 20 (0.09%)
- Ethiopian: 20 (0.09%)
- Maltese: 18 (0.08%)
- Northern European: 16 (0.07%)
- Ghanaian: 15 (0.06%)
- West Indian: 15 (0.06%)
- Croatian: 14 (0.06%)
- Hungarian: 12 (0.05%)
- Israeli: 10 (0.04%)
- Lithuanian: 10 (0.04%)
- Czechoslovakian: 9 (0.04%)
- Brazilian: 9 (0.04%)
- Canadian: 8 (0.03%)
- Jordanian: 7 (0.03%)
- Portuguese: 5 (0.02%)
- Bulgarian: 3 (0.01%)
Most common places of birth for foreign-born residents (%):
| Blacksburg: | 22.0% (1,318) |
| Virginia: | 3.9% (42,989) |
| Blacksburg: | 19.7% (1,176) |
| Virginia: | 9.0% (97,830) |
| Blacksburg: | 8.5% (510) |
| Virginia: | 0.9% (9,672) |
| Blacksburg: | 7.6% (453) |
| Virginia: | 4.9% (52,857) |
| Blacksburg: | 5.0% (299) |
| Virginia: | 0.1% (1,530) |
| Blacksburg: | 4.2% (253) |
| Virginia: | 0.2% (2,328) |
| Blacksburg: | 4.1% (244) |
| Virginia: | 0.8% (8,805) |
| Blacksburg: | 3.4% (205) |
| Virginia: | 1.2% (12,984) |
| Blacksburg: | 2.8% (166) |
| Virginia: | 0.5% (5,147) |
| Blacksburg: | 2.6% (154) |
| Virginia: | 0.9% (9,351) |
| Blacksburg: | 2.6% (153) |
| Virginia: | 1.3% (14,417) |
| Blacksburg: | 2.1% (127) |
| Virginia: | 4.8% (52,629) |
| Blacksburg: | 2.0% (122) |
| Virginia: | 1.1% (12,049) |
| Blacksburg: | 1.6% (96) |
| Virginia: | 1.6% (17,346) |
Place of birth for U.S.-born residents:
- This state: 21,920
- Other state: 15,978
- Northeast: 4,927
- Midwest: 1,765
- South: 7,313
- West: 1,945
64.3% of Blacksburg residents lived in the same house 1 years ago.
Out of people who lived in different houses, 29.0% lived in this county.
Out of people who lived in different counties, 66.8% lived in Virginia.
| Blacksburg: | 64.3% |
| State average: | 86.6% |
Education attainment for males 25 years and older:
- No schooling: 23
- Nursery to 4th grade: 0
- 5th and 6th grade: 0
- 7th and 8th grade: 0
- 9th grade: 4
- 10th grade: 28
- 11th grade: 0
- 12th grade, no diploma: 37
- High school graduate (or equivalency): 1,001
- Less than 1 year of college: 267
- Some college more than 1 year, no degree: 579
- Associate degree: 423
- Bachelor's degree: 2,305
- Master's degree: 1,216
- Professional school degree: 278
- Doctorate degree: 1,638

Education attainment for females 25 years and older:
- No schooling: 46
- Nursery to 4th grade: 22
- 5th and 6th grade: 0
- 7th and 8th grade: 1
- 9th grade: 22
- 10th grade: 40
- 11th grade: 37
- 12th grade, no diploma: 0
- High school graduate (or equivalency): 875
- Less than 1 year of college: 275
- Some college more than 1 year, no degree: 703
- Associate degree: 407
- Bachelor's degree: 2,051
- Master's degree: 2,625
- Professional school degree: 195
- Doctorate degree: 1,074


Housing units in structures:
- One, detached: 5,910
- One, attached: 940
- Two: 839
- 3 or 4: 961
- 5 to 9: 1,669
- 10 to 19: 4,740
- 20 to 49: 778
- 50 or more: 593
- Mobile homes: 372
Median worth of mobile homes: $11,233
Housing units lacking complete kitchen facilities in 2022: 2.4%
House/condo owner moved in on average 11 years ago
Renter moved in on average -1 years ago

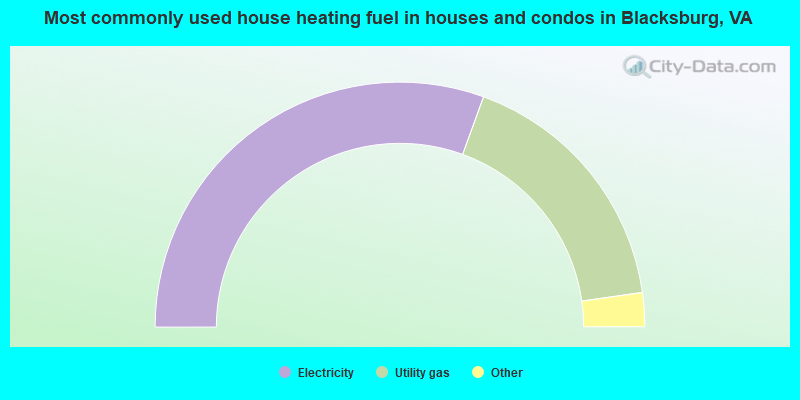
- 61.1%Electricity
- 34.4%Utility gas
- 2.3%Fuel oil, kerosene, etc.
- 1.5%Bottled, tank, or LP gas
- 0.8%Wood
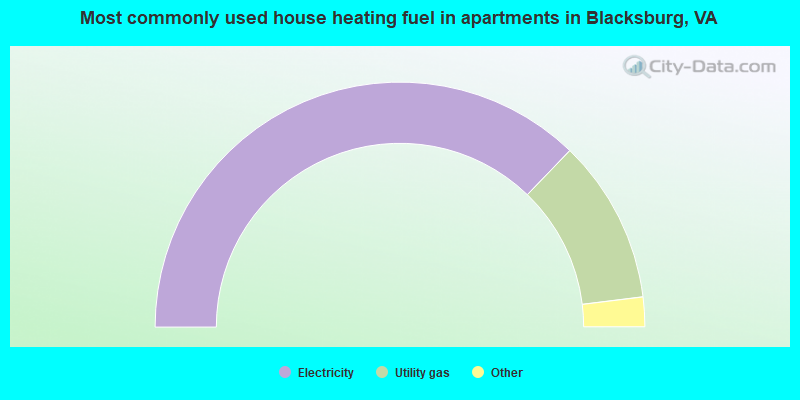
- 74.4%Electricity
- 21.7%Utility gas
- 1.7%Fuel oil, kerosene, etc.
- 1.2%Bottled, tank, or LP gas
- 1.0%No fuel used
Private vs. public school enrollment:
| Here: | 3.2% |
| Virginia: | 13.2% |
| Here: | 22.6% |
| Virginia: | 10.2% |
| Here: | 2.7% |
| Virginia: | 18.7% |


