Biltmore, TN (Tennessee) Houses and Residents
| Biltmore: | $154,999 |
| Tennessee: | $284,800 |
Total population: 5,766 (Urban population: 2,316, Rural population: 3,245 (all nonfarm))
Houses: 2,544 (2,326 occupied: 1,795 owner occupied, 531 renter occupied)
| % of renters here: | 23% |
| State: | 33% |
Housing density: 103 houses/condos per square mile
Median price asked for vacant for-sale houses and condos in 2022 in this county: $137,997.
Median contract rent in 2022: $602 (lower quartile is $453, upper quartile is $736)
Median rent asked for vacant for-rent units in 2022: $598
Median gross rent in Biltmore, TN in 2022: $774
Housing units in Biltmore with a mortgage: 550 (37 second mortgage, 41 home equity loan, 0 both second mortgage and home equity loan)
Houses without a mortgage: 567


Household type by relationship:
Households: 55,933- In family households: 46,435 (11,586 male householders, 4,517 female householders)
11,989 spouses, 14,161 children (12,759 natural, 437 adopted, 965 stepchildren), 1,500 grandchildren, 380 brothers or sisters, 399 parents, foster children, 435 other relatives, 1,159 non-relatives
- In nonfamily households: 9,498 (3,804 male householders (3,101 living alone)), 4,290 female householders (3,810 living alone)), 1,404 nonrelatives
- In group quarters: 1,491 (910 institutionalized population)
8,247 married couples with children.
2,723 single-parent households (575 men, 2,148 women).
97.2% of residents of Biltmore speak English at home.
2.0% of residents speak Spanish at home (83% speak English very well, 5% speak English well, 12% speak English not well).
0.5% of residents speak other Indo-European language at home (100% speak English very well).
0.2% of residents speak Asian or Pacific Island language at home (45% speak English very well, 55% speak English well).
Foreign born population: 13 (0.2%)
(0.0% of them are naturalized citizens)
| Here: | 6.0 |
| State: | 6.5 |
| Here: | 4.6 |
| State: | 4.4 |

- Bedrooms in owner-occupied houses and condos in Biltmore, Tennessee
- 10no bedroom
- 651 bedroom
- 5432 bedrooms
- 1,0063 bedrooms
- 1524 bedrooms
- 195+ bedrooms

- Bedrooms in renter-occupied apartments in Biltmore, Tennessee
- 6no bedroom
- 481 bedroom
- 3042 bedrooms
- 1533 bedrooms
- 124 bedrooms
- 85+ bedrooms

- Cars and other vehicles available in Biltmore in owner-occupied houses/condos
- 124no vehicle
- 3911 vehicle
- 7662 vehicles
- 3793 vehicles
- 1134 vehicles
- 225+ vehicles

- Cars and other vehicles available in Biltmore in renter-occupied apartments
- 42no vehicle
- 1821 vehicle
- 2052 vehicles
- 553 vehicles
- 334 vehicles
- 145+ vehicles

- Rooms in owner-occupied houses in Biltmore, Tennessee
- 01 room
- 162 rooms
- 553 rooms
- 2874 rooms
- 5525 rooms
- 4046 rooms
- 2397 rooms
- 1818 rooms
- 619+ rooms

- Rooms in renter-occupied apartments in Biltmore, Tennessee
- 01 room
- 212 rooms
- 353 rooms
- 2194 rooms
- 1215 rooms
- 916 rooms
- 247 rooms
- 68 rooms
- 149+ rooms


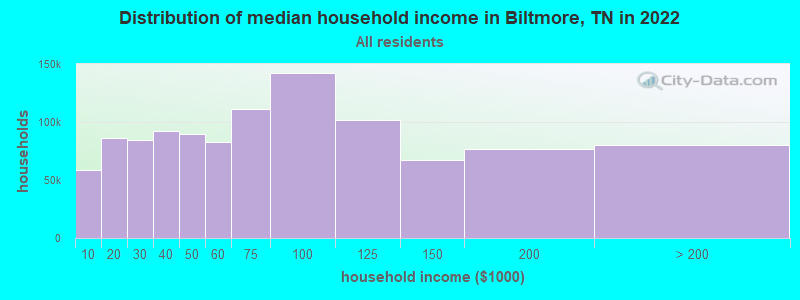
Biltmore, TN household income distribution

- 55,448Less than $10,000
- 83,124$10,000 to $19,999
- 81,414$20,000 to $29,999
- 87,806$30,000 to $39,999
- 85,771$40,000 to $49,999
- 78,519$50,000 to $59,999
- 105,893$60,000 to $74,999
- 135,722$75,000 to $99,999
- 97,347$100,000 to $124,999
- 63,722$125,000 to $149,999
- 72,582$150,000 to $199,999
- 74,490$200,000 or more
Percentage of workers working in this county: 38.0%
Number of people working at home: 379 (12.3% of all workers)
Travel time to work (commute)
- Less than 5 minutes: 48
- 5 to 9 minutes: 251
- 10 to 14 minutes: 437
- 15 to 19 minutes: 361
- 20 to 24 minutes: 481
- 25 to 29 minutes: 124
- 30 to 34 minutes: 467
- 35 to 39 minutes: 13
- 40 to 44 minutes: 50
- 45 to 59 minutes: 183
- 60 to 89 minutes: 14
- 90 or more minutes: 68
Means of transportation to work:
- Drove a car alone: 2,115 (84.1%)
- Carpooled: 352 (14.0%)
- Bus or trolley bus: 5 (0.2%)
- Walked: 13 (0.5%)
- Other means: 12 (0.5%)
- Worked at home: 19 (0.8%)


- Year of entry for the foreign-born population in Biltmore, Tennessee
- 01995 to March 2000
- 61990 to 1994
- 01985 to 1989
- 01980 to 1984
- 01975 to 1979
- 01970 to 1974
- 01965 to 1969
- 0Before 1965
Most common places of birth for foreign-born residents (%):
| Biltmore: | 100.0% (6) |
| Tennessee: | 0.8% (1,283) |
Place of birth for U.S.-born residents:
- This state: 4,146
- Other state: 1,382
- Northeast: 137
- Midwest: 247
- South: 886
- West: 112
60% of Biltmore residents lived in the same house 5 years ago.
Out of people who lived in different houses, 66% lived in this county.
Out of people who lived in different counties, 54% lived in Tennessee.
Education attainment for males 25 years and older:
- No schooling: 28
- Nursery to 4th grade: 5
- 5th and 6th grade: 26
- 7th and 8th grade: 267
- 9th grade: 74
- 10th grade: 118
- 11th grade: 79
- 12th grade, no diploma: 115
- High school graduate (or equivalency): 482
- Less than 1 year of college: 186
- Some college more than 1 year, no degree: 239
- Associate degree: 71
- Bachelor's degree: 113
- Master's degree: 62
- Professional school degree: 19
- Doctorate degree: 0

Education attainment for females 25 years and older:
- No schooling: 47
- Nursery to 4th grade: 24
- 5th and 6th grade: 29
- 7th and 8th grade: 170
- 9th grade: 68
- 10th grade: 105
- 11th grade: 80
- 12th grade, no diploma: 66
- High school graduate (or equivalency): 697
- Less than 1 year of college: 126
- Some college more than 1 year, no degree: 256
- Associate degree: 117
- Bachelor's degree: 96
- Master's degree: 58
- Professional school degree: 22
- Doctorate degree: 0


Housing units in structures:
- One, detached: 1,531
- One, attached: 9
- Two: 22
- 3 or 4: 126
- 5 to 9: 66
- Mobile homes: 790
Median worth of mobile homes: $65,261
Housing units lacking complete kitchen facilities: 0.9%

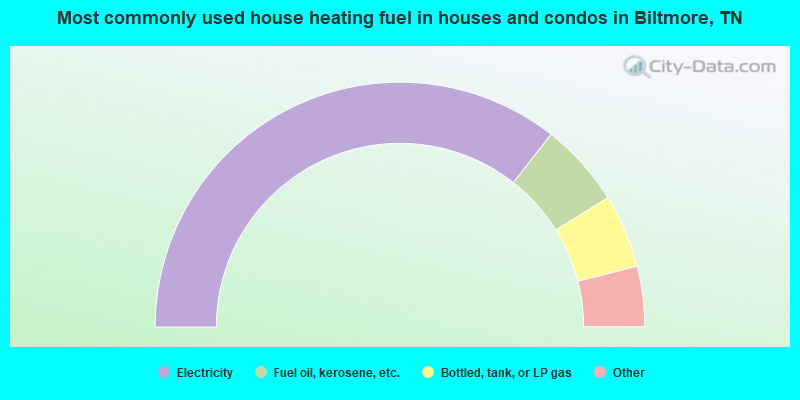
- 71.2%Electricity
- 11.1%Fuel oil, kerosene, etc.
- 9.7%Bottled, tank, or LP gas
- 3.6%Wood
- 1.7%Utility gas
- 1.6%Coal or coke
- 0.7%No fuel used
- 0.4%Other fuel
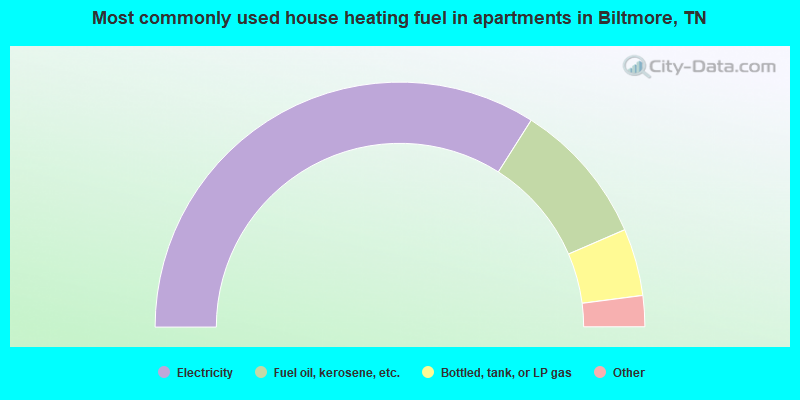
- 68.0%Electricity
- 19.0%Fuel oil, kerosene, etc.
- 8.9%Bottled, tank, or LP gas
- 3.2%Wood
- 0.9%Utility gas
Private vs. public school enrollment:
| Here: | 0.4% |
| Tennessee: | 9.5% |
| Here: | 0.8% |
| Tennessee: | 10.4% |
| Here: | 8.3% |
| Tennessee: | 22.8% |


