Big Bear City, CA (California) Houses and Residents
| Big Bear City: | $453,269 |
| California: | $715,900 |
Mean price in 2022:
Detached houses: $545,022
Here: $545,022 State: $988,808 Townhouses or other attached units: $1,020,324
Here: $1,020,324 State: $838,546 Mobile homes: $229,792
Here: $229,792 State: $184,506
Total population: 12,304 (Urban population: 5,265 (all inside urban clusters), Rural population: 554 (all nonfarm))
Houses: 12,517 (5,372 occupied: 3,707 owner occupied, 1,714 renter occupied)
| % of renters here: | 32% |
| State: | 44% |
Housing density: 3,606 houses/condos per square mile
Median price asked for vacant for-sale houses and condos in 2022: $273,521.
Median contract rent in 2022: $1,183 (lower quartile is $936, upper quartile is $1,499)
Median rent asked for vacant for-rent units in 2022: $1,229
Median gross rent in Big Bear City, CA in 2022: $1,446
Housing units in Big Bear City with a mortgage: 2,633 (206 second mortgage, 14 home equity loan, 79 both second mortgage and home equity loan)
Houses without a mortgage: 23
Median household income for houses/condos with a mortgage: $94,511
Median household income for apartments without a mortgage: $52,059
Median monthly housing costs: $1,465
Compare current foreclosures near Big Bear City, CA:
| Photo | Address | Area | Beds / Baths | Price | Details |
|---|---|---|---|---|---|

|
#1
Lakewood Dr
Big Bear City, CA 92314
|
- sq. feet
|
1 baths 1 beds |
show details | |

|
#2
Unfified School District
Big Bear City, CA 92314
|
- sq. feet
|
- baths - beds |
$50
|
show details |

|
#3
Montclair Dr Spc 241
Big Bear City, CA 92314
|
1,456 sq. feet
|
2 baths 3 beds |
show details | |

|
#4
3rd Ln
Big Bear City, CA 92314
|
- sq. feet
|
- baths - beds |
show details | |

|
#5
E Meadow Ln
Big Bear City, CA 92314
|
- sq. feet
|
- baths - beds |
show details | |

|
#6
Barrett Way
Big Bear City, CA 92314
|
- sq. feet
|
- baths - beds |
show details | |

|
#7
Baldwin Ln
Big Bear City, CA 92314
|
- sq. feet
|
- baths - beds |
show details | |

|
#8
Sutter Ave
Lucerne Valley, CA 92356
|
1,520 sq. feet
|
2 baths 3 beds |
show details | |

|
#9
Rabbit Springs Rd
Lucerne Valley, CA 92356
|
1,440 sq. feet
|
1 baths 3 beds |
show details | |

|
#10
Zircon Rd
Lucerne Valley, CA 92356
|
1,352 sq. feet
|
2 baths 3 beds |
show details |
| Photo | Address | Area | Beds / Baths | Price | Details |
|---|---|---|---|---|---|

|
#11
Carnelian Rd
Lucerne Valley, CA 92356
|
1,732 sq. feet
|
1 baths 2 beds |
show details | |

|
#12
Fairlane Rd
Lucerne Valley, CA 92356
|
1,001 sq. feet
|
2 baths 2 beds |
show details | |

|
#13
Forest Rd
Big Bear Lake, CA 92315
|
- sq. feet
|
- baths - beds |
show details | |

|
#14
Sheephorn Rd
Big Bear Lake, CA 92315
|
- sq. feet
|
- baths - beds |
show details | |

|
#15
Sutter Rd
Lucerne Valley, CA 92356
|
- sq. feet
|
- baths - beds |
show details | |

|
#16
Imperial Ave
Sugarloaf, CA 92386
|
- sq. feet
|
- baths - beds |
show details | |

|
#17
Old Mill Creek Rd
Mentone, CA 92359
|
- sq. feet
|
- baths - beds |
show details | |

|
#18
Hilltop Dr
Running Springs, CA 92382
|
- sq. feet
|
- baths - beds |
show details | |

|
#19
Overhill Dr
Running Springs, CA 92382
|
- sq. feet
|
- baths - beds |
show details | |

|
#20
Spring Oak Dr
Running Springs, CA 92382
|
- sq. feet
|
- baths - beds |
show details |
| Photo | Address | Area | Beds / Baths | Price | Details |
|---|---|---|---|---|---|

|
#21
Oak Leaf Ln
Running Springs, CA 92382
|
- sq. feet
|
- baths - beds |
show details | |

|
#22
N Shore Dr
Fawnskin, CA 92333
|
- sq. feet
|
- baths - beds |
show details | |

|
#23
Deer Crk Dr
Running Springs, CA 92382
|
- sq. feet
|
- baths - beds |
show details | |

|
#24
Pine Bench Rd
Yucaipa, CA 92399
|
- sq. feet
|
- baths - beds |
show details | |

|
Check over 1 million property listings on Foreclosure.com!
|
browse all offers | |||


 | year-round weather at Big Bear / San Bernadino (45 replies) |
| Weather in Southern California: not paradise (332 replies) |
| Living in Big Bear City (10 replies) |
| Big Bear, Big Bear Lake (10 replies) |
| Big Bear Lake Area - Which areas to stay away from when looking to buy a home (21 replies) |
| Will LA eventually get so dense, that OC and The IE become too far/impossible to commute from by car? (95 replies) |

Median year apartment built: 1978
Household type by relationship:
Households: 12,829- Male householders: 2,966 (786 living alone), Female householders: 2,372 (806 living alone)
2,334 spouses (2,304 opposite-sex spouses), 318 unmarried partners, (308 opposite-sex unmarried partners), 3,262 children (2,860 natural, 135 adopted, 266 stepchildren), 260 grandchildren, 173 brothers or sisters, 334 parents, 80 foster children, 78 other relatives, 614 non-relatives
- In group quarters: 32
Size of family households: 1,576 2-persons, 984 3-persons, 432 4-persons, 239 5-persons, 64 6-persons, 71 7-or-more-persons.
Size of nonfamily households: 1,577 1-person, 409 2-persons, 56 3-persons, 31 5-persons.
1,697 married couples with children.
699 single-parent households (222 men, 477 women).
84.7% of residents of Big Bear City speak English at home.
9.5% of residents speak Spanish at home (73% speak English very well, 11% speak English well, 13% speak English not well, 2% don't speak English at all).
1.5% of residents speak other Indo-European language at home (85% speak English very well, 15% speak English well).
0.9% of residents speak Asian or Pacific Island language at home (36% speak English very well, 47% speak English well, 17% speak English not well).
0.9% of residents speak other language at home (63% speak English very well, 37% speak English well).
Foreign born population: 625 (4.9%)
(62.6% of them are naturalized citizens)
| Here: | 5.1 |
| State: | 6.0 |
| Here: | 4.3 |
| State: | 3.9 |

- Bedrooms in owner-occupied houses and condos in Big Bear City, California
- 25no bedroom
- 1801 bedroom
- 1,2362 bedrooms
- 1,5413 bedrooms
- 6104 bedrooms
- 1165+ bedrooms

- Bedrooms in renter-occupied apartments in Big Bear City, California
- 0no bedroom
- 941 bedroom
- 1,0412 bedrooms
- 4453 bedrooms
- 1344 bedrooms
- 05+ bedrooms

- Cars and other vehicles available in Big Bear City in owner-occupied houses/condos
- 95no vehicle
- 1,0571 vehicle
- 1,4092 vehicles
- 6883 vehicles
- 2314 vehicles
- 2285+ vehicles

- Cars and other vehicles available in Big Bear City in renter-occupied apartments
- 0no vehicle
- 7591 vehicle
- 5402 vehicles
- 3503 vehicles
- 464 vehicles
- 185+ vehicles

- Rooms in owner-occupied houses in Big Bear City, California
- 251 room
- 142 rooms
- 4563 rooms
- 8864 rooms
- 7605 rooms
- 7646 rooms
- 4777 rooms
- 1018 rooms
- 2259+ rooms

- Rooms in renter-occupied apartments in Big Bear City, California
- 01 room
- 422 rooms
- 3183 rooms
- 6224 rooms
- 4325 rooms
- 2146 rooms
- 257 rooms
- 628 rooms
- 09+ rooms


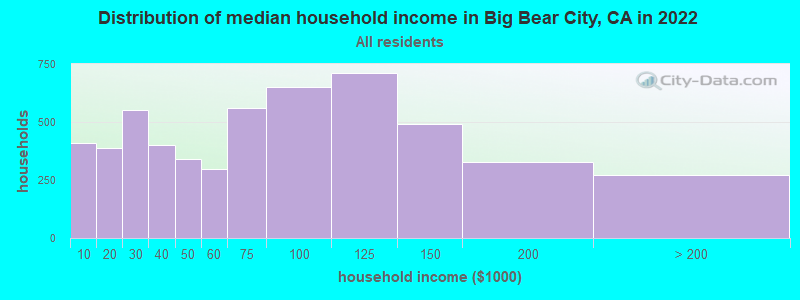
Big Bear City, CA household income distribution

- 411Less than $10,000
- 389$10,000 to $19,999
- 552$20,000 to $29,999
- 403$30,000 to $39,999
- 339$40,000 to $49,999
- 296$50,000 to $59,999
- 561$60,000 to $74,999
- 653$75,000 to $99,999
- 711$100,000 to $124,999
- 490$125,000 to $149,999
- 326$150,000 to $199,999
- 272$200,000 or more
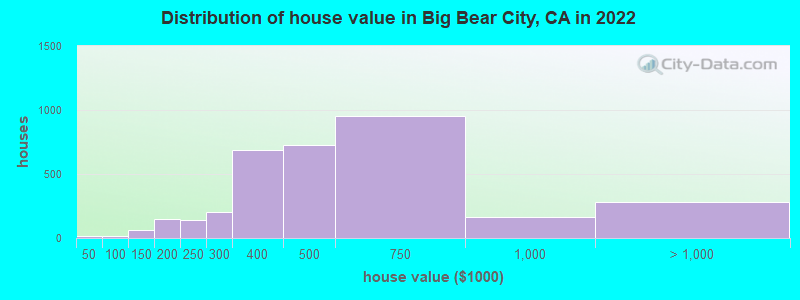
Home value of owner - occupied houses in 2022 in Big Bear City, CA
-
- 4$20,000 to $24,999
- 8$30,000 to $34,999
- 8$50,000 to $59,999
- 8$90,000 to $99,999
- 31$100,000 to $124,999
- 29$125,000 to $149,999
- 84$150,000 to $174,999
- 65$175,000 to $199,999
- 143$200,000 to $249,999
- 205$250,000 to $299,999
- 686$300,000 to $399,999
- 722$400,000 to $499,999
- 956$500,000 to $749,999
- 167$750,000 to $999,999
- 125$1,000,000 to $1,499,999
- 51$1,500,000 to $1,999,999
- 105$2,000,000 or more
Rent paid by renters in 2022 in Big Bear City, CA
-
- 36$350 to $399
- 46$400 to $449
- 17$450 to $499
- 25$500 to $549
- 14$650 to $699
- 31$700 to $749
- 62$750 to $799
- 87$800 to $899
- 186$900 to $999
- 299$1,000 to $1,249
- 218$1,250 to $1,499
- 262$1,500 to $1,999
- 4$2,000 to $2,499
- 31$2,500 to $2,999
- 313No cash rent


Percentage of workers working in this county: 94.4%
Number of people working at home: 954 (18.1% of all workers)
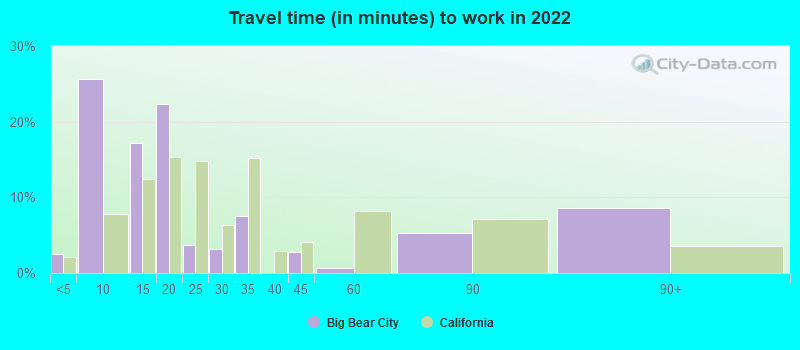
Travel time to work (commute)
- Less than 5 minutes: 81
- 5 to 9 minutes: 857
- 10 to 14 minutes: 898
- 15 to 19 minutes: 788
- 20 to 24 minutes: 539
- 25 to 29 minutes: 71
- 30 to 34 minutes: 146
- 35 to 39 minutes: 5
- 40 to 44 minutes: 55
- 45 to 59 minutes: 76
- 60 to 89 minutes: 411
- 90 or more minutes: 442
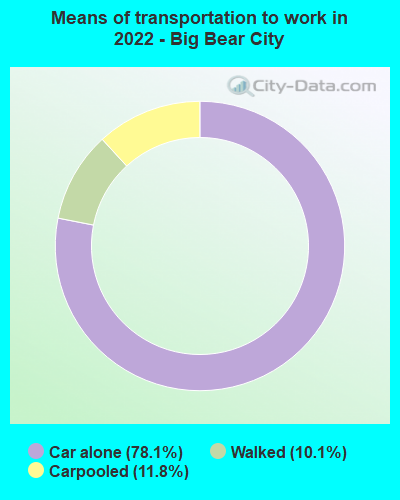
Means of transportation to work:
- Drove a car alone: 946 (46.1%)
- Carpooled: 154 (7.5%)
- Walked: 132 (6.4%)
- Worked at home: 954 (46.5%)

- Unemployment by race in 2022
- Unemployment rate for White non-Hispanic residents
- 8.8%Males
- 5.3%Females
- Unemployment rate for Black residents
- 29.6%Females
- Unemployment rate for two or more race residents
- 19.1%Males
- 5.8%Females
- Unemployment rate for Hispanic or Latino residents
- 7.6%Males
- 6.2%Females

- Year of entry for the foreign-born population in Big Bear City, California
- 402010 or later
- 1052000 to 2009
- 2461990 to 1999
- 1901980 to 1989
- 121970 to 1979
- 89Before 1970

First ancestries reported:
- German: 596 (9.9%)
- English: 463 (7.7%)
- Irish: 348 (5.8%)
- European: 244 (4.0%)
- Dutch: 236 (3.9%)
- Italian: 185 (3.1%)
- Norwegian: 146 (2.4%)
- Welsh: 112 (1.9%)
- Polish: 109 (1.8%)
- American: 109 (1.8%)
- French: 87 (1.4%)
- Scottish: 76 (1.3%)
- Croatian: 69 (1.1%)
- Romanian: 69 (1.1%)
- Scotch-Irish: 63 (1.0%)
- Israeli: 40 (0.7%)
- Swedish: 31 (0.5%)
- Danish: 30 (0.5%)
- German Russian: 30 (0.5%)
- Greek: 26 (0.4%)
- Iranian: 24 (0.4%)
- British: 21 (0.3%)
- Finnish: 21 (0.3%)
- Arab: 17 (0.3%)
- Canadian: 15 (0.2%)
- French Canadian: 15 (0.2%)
- Austrian: 13 (0.2%)
- Czech: 10 (0.2%)
- Portuguese: 10 (0.2%)
- Czechoslovakian: 7 (0.1%)
- Hungarian: 7 (0.1%)
- Syrian: 4 (0.07%)
- Bulgarian: 4 (0.07%)
- Eastern European: 3 (0.05%)
- Swiss: 3 (0.05%)
- Scandinavian: 1 (0.02%)
Most common places of birth for foreign-born residents (%):
| Big Bear City: | 31.7% (193) |
| California: | 37.2% (3,881,193) |
| Big Bear City: | 15.4% (94) |
| California: | 7.8% (818,297) |
| Big Bear City: | 11.2% (68) |
| California: | 1.2% (127,477) |
| Big Bear City: | 7.2% (44) |
| California: | 0.2% (23,058) |
| Big Bear City: | 6.6% (40) |
| California: | 0.6% (66,590) |
| Big Bear City: | 5.7% (35) |
| California: | 0.1% (11,122) |
| Big Bear City: | 3.8% (23) |
| California: | 2.0% (206,004) |
| Big Bear City: | 3.3% (20) |
| California: | 0.3% (33,029) |
| Big Bear City: | 3.3% (20) |
| California: | 0.2% (20,614) |
| Big Bear City: | 2.3% (14) |
| California: | 0.6% (57,953) |
Place of birth for U.S.-born residents:
- This state: 9,423
- Other state: 2,506
- Northeast: 444
- Midwest: 630
- South: 595
- West: 810
93.3% of Big Bear City residents lived in the same house 1 years ago.
Out of people who lived in different houses, 23.6% lived in this county.
Out of people who lived in different counties, 86.1% lived in California.
| Big Bear City: | 93.3% |
| State average: | 88.9% |
Education attainment for males 25 years and older:
- No schooling: 98
- Nursery to 4th grade: 0
- 5th and 6th grade: 65
- 7th and 8th grade: 0
- 9th grade: 0
- 10th grade: 62
- 11th grade: 62
- 12th grade, no diploma: 47
- High school graduate (or equivalency): 1,458
- Less than 1 year of college: 259
- Some college more than 1 year, no degree: 737
- Associate degree: 448
- Bachelor's degree: 900
- Master's degree: 230
- Professional school degree: 24
- Doctorate degree: 76

Education attainment for females 25 years and older:
- No schooling: 22
- Nursery to 4th grade: 10
- 5th and 6th grade: 59
- 7th and 8th grade: 0
- 9th grade: 37
- 10th grade: 112
- 11th grade: 50
- 12th grade, no diploma: 26
- High school graduate (or equivalency): 1,269
- Less than 1 year of college: 345
- Some college more than 1 year, no degree: 930
- Associate degree: 378
- Bachelor's degree: 859
- Master's degree: 384
- Professional school degree: 31
- Doctorate degree: 57


Housing units in structures:
- One, detached: 11,824
- One, attached: 83
- Two: 131
- 3 or 4: 12
- 10 to 19: 16
- 50 or more: 41
- Mobile homes: 407
Median worth of mobile homes: $267,303
Housing units lacking complete kitchen facilities in 2022: 0.8%
House/condo owner moved in on average 10 years ago
Renter moved in on average 3 years ago

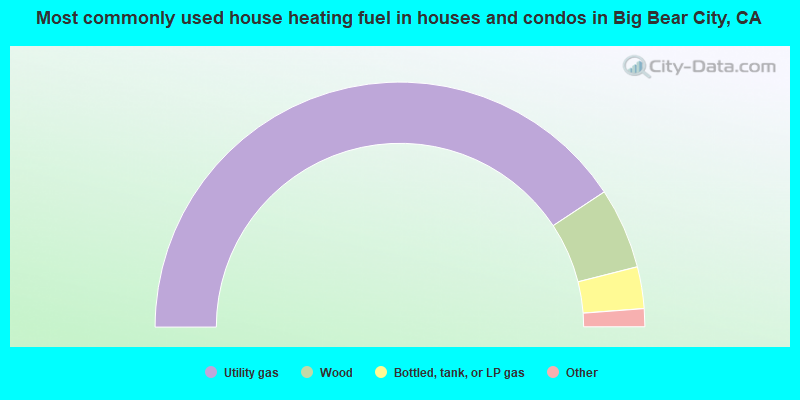
- 81.5%Utility gas
- 10.7%Wood
- 5.5%Bottled, tank, or LP gas
- 2.0%Electricity
- 0.4%No fuel used
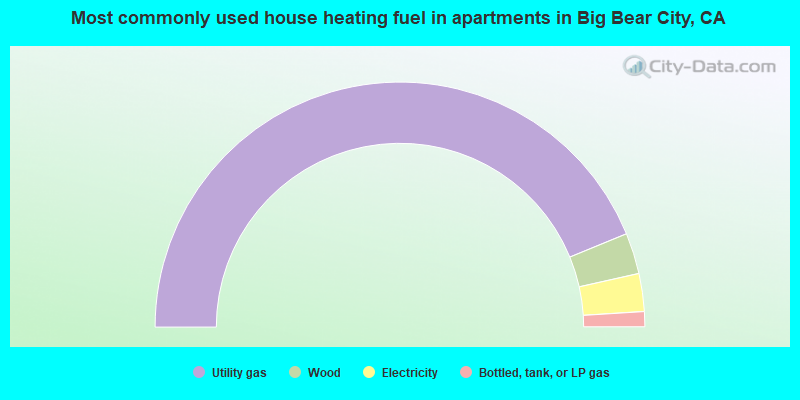
- 87.6%Utility gas
- 5.4%Wood
- 5.0%Electricity
- 2.0%Bottled, tank, or LP gas
Private vs. public school enrollment:
| Here: | 16.7% |
| California: | 10.5% |
| Here: | 0.0% |
| California: | 8.5% |
| Here: | 34.1% |
| California: | 15.9% |


