Bergenfield, NJ (New Jersey) Houses and Residents
| Bergenfield: | $451,030 |
| New Jersey: | $428,900 |
Mean price in 2022:
Detached houses: $503,157
Here: $503,157 State: $537,591 Townhouses or other attached units: $423,971
Here: $423,971 State: $381,113 In 2-unit structures: $513,815
Here: $513,815 State: $444,476 In 3-to-4-unit structures: $258,022
Here: $258,022 State: $457,463 In 5-or-more-unit structures: $194,612
Here: $194,612 State: $368,745
Total population: 27,406 (Urban population: 26,247, Rural population: 0)
Houses: 9,640 (9,364 occupied: 6,548 owner occupied, 2,866 renter occupied)
| % of renters here: | 30% |
| State: | 35% |
Housing density: 3,330 houses/condos per square mile
Median price asked for vacant for-sale houses and condos in 2022: $501,196.
Median contract rent in 2022: $1,571 (lower quartile is $1,197, upper quartile is $1,847)
Median rent asked for vacant for-rent units in 2022: $1,896
Median gross rent in Bergenfield, NJ in 2022: $1,624
Housing units in Bergenfield with a mortgage: 4,413 (358 second mortgage, 4 home equity loan, 317 both second mortgage and home equity loan)
Houses without a mortgage: 179
Median household income for houses/condos with a mortgage: $155,599
Median household income for apartments without a mortgage: $96,338
Median monthly housing costs: $1,880
Compare current foreclosures in Bergenfield, NJ:
| Photo | Address | Area | Beds / Baths | Price | Details |
|---|---|---|---|---|---|

|
#1
S Williams St
Bergenfield, NJ 07621
|
1,747 sq. feet
|
- baths - beds |
show details | |

|
#2
Carnation St
Bergenfield, NJ 07621
|
1,138 sq. feet
|
- baths - beds |
show details | |

|
#3
E Clinton Ave
Bergenfield, NJ 07621
|
1,758 sq. feet
|
- baths - beds |
show details | |

|
#4
Quincy Ln
Bergenfield, NJ 07621
|
1,460 sq. feet
|
- baths - beds |
show details | |

|
#5
W Central Ave
Bergenfield, NJ 07621
|
2,155 sq. feet
|
- baths - beds |
show details | |

|
#6
Greenwich Dr
Bergenfield, NJ 07621
|
2,004 sq. feet
|
- baths - beds |
show details | |

|
#7
Edward St # 1
Bergenfield, NJ 07621
|
1,720 sq. feet
|
- baths - beds |
show details | |

|
#8
Hunt Walk Apt H
Bergenfield, NJ 07621
|
- sq. feet
|
- baths - beds |
show details | |

|
#9
S Washington Ave
Bergenfield, NJ 07621
|
- sq. feet
|
- baths - beds |
show details | |

|
#10
Levitt Ave
Bergenfield, NJ 07621
|
1,826 sq. feet
|
- baths - beds |
show details |
| Photo | Address | Area | Beds / Baths | Price | Details |
|---|---|---|---|---|---|

|
#11
Harcourt Ave
Bergenfield, NJ 07621
|
2,038 sq. feet
|
- baths - beds |
show details | |

|
#12
E Main St
Bergenfield, NJ 07621
|
1,644 sq. feet
|
- baths - beds |
show details | |

|
#13
Grove St
Bergenfield, NJ 07621
|
1,406 sq. feet
|
- baths - beds |
show details | |

|
#14
S Washington Ave
Bergenfield, NJ 07621
|
- sq. feet
|
- baths - beds |
show details | |

|
#15
Beucler Pl
Bergenfield, NJ 07621
|
1,538 sq. feet
|
- baths - beds |
show details | |

|
#16
S Washington Ave # A-6
Bergenfield, NJ 07621
|
- sq. feet
|
- baths - beds |
show details | |

|
#17
Cameron Rd
Bergenfield, NJ 07621
|
1,432 sq. feet
|
- baths - beds |
show details | |

|
#18
Highland Ave
Bergenfield, NJ 07621
|
1,690 sq. feet
|
- baths - beds |
show details | |

|
#19
Vreeland Ave
Bergenfield, NJ 07621
|
1,694 sq. feet
|
- baths - beds |
show details | |

|
#20
Somers Ave
Bergenfield, NJ 07621
|
1,565 sq. feet
|
- baths - beds |
show details |
| Photo | Address | Area | Beds / Baths | Price | Details |
|---|---|---|---|---|---|

|
#21
E Main St
Bergenfield, NJ 07621
|
2,110 sq. feet
|
- baths - beds |
show details | |

|
#22
Anderson Ave
Bergenfield, NJ 07621
|
4,132 sq. feet
|
- baths - beds |
show details | |

|
#23
Graphic Blvd
Bergenfield, NJ 07621
|
2,216 sq. feet
|
- baths - beds |
show details | |

|
#24
Tulip St
Bergenfield, NJ 07621
|
2,539 sq. feet
|
- baths - beds |
show details | |

|
#25
Woods Ave
Bergenfield, NJ 07621
|
1,894 sq. feet
|
- baths - beds |
show details | |

|
#26
Lake St
Bergenfield, NJ 07621
|
1,478 sq. feet
|
- baths - beds |
show details | |

|
#27
S Paula Dr
Bergenfield, NJ 07621
|
1,320 sq. feet
|
- baths - beds |
show details | |

|
#28
Hillside Ave
Bergenfield, NJ 07621
|
1,650 sq. feet
|
- baths - beds |
show details | |

|
#29
Judith Pl
Bergenfield, NJ 07621
|
- sq. feet
|
- baths - beds |
show details | |

|
#30
E Johnson Ave
Bergenfield, NJ 07621
|
1,159 sq. feet
|
- baths - beds |
show details |
| Photo | Address | Area | Beds / Baths | Price | Details |
|---|---|---|---|---|---|

|
#31
Judith Pl
Bergenfield, NJ 07621
|
1,296 sq. feet
|
- baths - beds |
show details | |

|
#32
E Clinton Ave # 1
Bergenfield, NJ 07621
|
1,872 sq. feet
|
- baths - beds |
show details | |

|
#33
E Clinton Ave Apt 9a
Bergenfield, NJ 07621
|
640 sq. feet
|
- baths - beds |
show details | |

|
#34
Anderson Ave
Bergenfield, NJ 07621
|
1,166 sq. feet
|
- baths - beds |
show details | |

|
#35
E Clinton Ave Apt 1b
Bergenfield, NJ 07621
|
640 sq. feet
|
- baths - beds |
show details | |

|
#36
Woodbine St # D1
Bergenfield, NJ 07621
|
- sq. feet
|
- baths - beds |
show details | |

|
#37
Smith Ave
Bergenfield, NJ 07621
|
1,478 sq. feet
|
- baths - beds |
show details | |

|
#38
Woods Ave
Bergenfield, NJ 07621
|
1,776 sq. feet
|
- baths - beds |
show details | |

|
#39
Brewster Pl
Bergenfield, NJ 07621
|
1,554 sq. feet
|
- baths - beds |
show details | |

|
#40
Melrose Ave
Bergenfield, NJ 07621
|
1,296 sq. feet
|
- baths - beds |
show details |
| Photo | Address | Area | Beds / Baths | Price | Details |
|---|---|---|---|---|---|

|
#41
Levitt Ave
Bergenfield, NJ 07621
|
1,558 sq. feet
|
- baths - beds |
show details | |

|
#42
Chestnut St
Bergenfield, NJ 07621
|
1,420 sq. feet
|
- baths - beds |
show details | |

|
#43
E Central Ave
Bergenfield, NJ 07621
|
1,836 sq. feet
|
- baths - beds |
show details | |

|
#44
S 1st St
Bergenfield, NJ 07621
|
- sq. feet
|
- baths - beds |
show details | |

|
#45
Carlson Pl
Bergenfield, NJ 07621
|
1,664 sq. feet
|
- baths - beds |
show details | |

|
#46
Davis Dr
Bergenfield, NJ 07621
|
1,656 sq. feet
|
- baths - beds |
show details | |

|
#47
Westview Dr
Bergenfield, NJ 07621
|
1,678 sq. feet
|
- baths - beds |
show details | |

|
#48
Hickory Ave
Bergenfield, NJ 07621
|
1,224 sq. feet
|
- baths - beds |
show details | |

|
#49
Lincoln Ave
Bergenfield, NJ 07621
|
1,644 sq. feet
|
- baths - beds |
show details | |

|
Check over 1 million property listings on Foreclosure.com!
|
browse all offers | |||

Latest news about housing in Bergenfield, NJ collected exclusively by city-data.com from local newspapers, TV, and radio stations


Median year apartment built: 1961
Household type by relationship:
Households: 28,215- Male householders: 5,044 (837 living alone), Female householders: 4,258 (872 living alone)
5,286 spouses (5,277 opposite-sex spouses), 516 unmarried partners, (505 opposite-sex unmarried partners), 9,773 children (9,441 natural, 147 adopted, 183 stepchildren), 482 grandchildren, 381 brothers or sisters, 823 parents, 0 foster children, 1,097 other relatives, 482 non-relatives
- In group quarters: 65
Size of family households: 2,416 2-persons, 1,630 3-persons, 1,241 4-persons, 1,230 5-persons, 376 6-persons, 350 7-or-more-persons.
Size of nonfamily households: 1,768 1-person, 365 2-persons, 72 3-persons, 65 5-persons.
4,375 married couples with children.
977 single-parent households (136 men, 841 women).
48.3% of residents of Bergenfield speak English at home.
25.0% of residents speak Spanish at home (63% speak English very well, 18% speak English well, 13% speak English not well, 6% don't speak English at all).
4.0% of residents speak other Indo-European language at home (57% speak English very well, 31% speak English well, 8% speak English not well, 4% don't speak English at all).
19.8% of residents speak Asian or Pacific Island language at home (66% speak English very well, 20% speak English well, 12% speak English not well, 2% don't speak English at all).
3.2% of residents speak other language at home (73% speak English very well, 18% speak English well, 7% speak English not well, 1% don't speak English at all).
Foreign born population: 11,209 (39.7%)
(76.3% of them are naturalized citizens)
| Here: | 6.7 |
| State: | 6.8 |
| Here: | 3.6 |
| State: | 3.9 |

- Bedrooms in owner-occupied houses and condos in Bergenfield, New Jersey
- 10no bedroom
- 831 bedroom
- 8872 bedrooms
- 3,2883 bedrooms
- 1,6854 bedrooms
- 5955+ bedrooms

- Bedrooms in renter-occupied apartments in Bergenfield, New Jersey
- 205no bedroom
- 1,3111 bedroom
- 7062 bedrooms
- 5383 bedrooms
- 764 bedrooms
- 295+ bedrooms

- Cars and other vehicles available in Bergenfield in owner-occupied houses/condos
- 328no vehicle
- 1,5291 vehicle
- 2,8242 vehicles
- 1,3103 vehicles
- 3844 vehicles
- 1745+ vehicles

- Cars and other vehicles available in Bergenfield in renter-occupied apartments
- 646no vehicle
- 1,3151 vehicle
- 7312 vehicles
- 1463 vehicles
- 04 vehicles
- 275+ vehicles

- Rooms in owner-occupied houses in Bergenfield, New Jersey
- 101 room
- 02 rooms
- 1043 rooms
- 4164 rooms
- 7335 rooms
- 1,4916 rooms
- 1,6077 rooms
- 1,1558 rooms
- 1,0329+ rooms

- Rooms in renter-occupied apartments in Bergenfield, New Jersey
- 2051 room
- 3392 rooms
- 7743 rooms
- 6354 rooms
- 4375 rooms
- 2616 rooms
- 917 rooms
- 488 rooms
- 769+ rooms


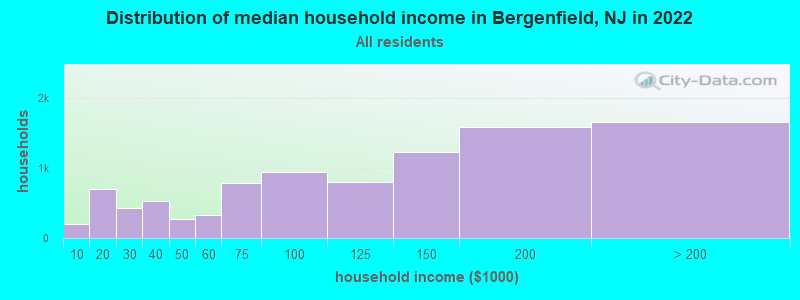
Bergenfield, NJ household income distribution

- 197Less than $10,000
- 695$10,000 to $19,999
- 424$20,000 to $29,999
- 522$30,000 to $39,999
- 275$40,000 to $49,999
- 326$50,000 to $59,999
- 783$60,000 to $74,999
- 933$75,000 to $99,999
- 798$100,000 to $124,999
- 1,225$125,000 to $149,999
- 1,583$150,000 to $199,999
- 1,652$200,000 or more
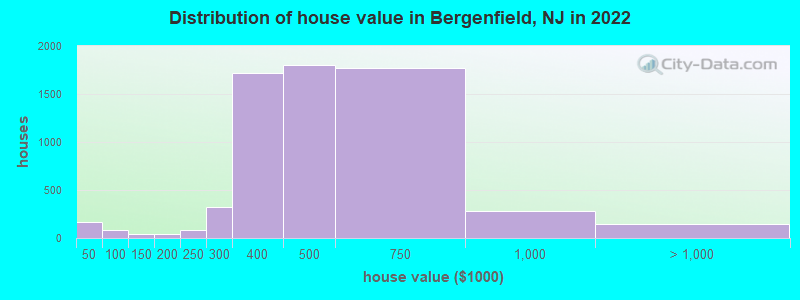
Home value of owner - occupied houses in 2022 in Bergenfield, NJ
-
- 37Less than $10,000
- 18$20,000 to $24,999
- 59$25,000 to $29,999
- 15$35,000 to $39,999
- 32$40,000 to $49,999
- 41$50,000 to $59,999
- 4$90,000 to $99,999
- 39$125,000 to $149,999
- 29$150,000 to $174,999
- 12$175,000 to $199,999
- 83$200,000 to $249,999
- 328$250,000 to $299,999
- 1,723$300,000 to $399,999
- 1,802$400,000 to $499,999
- 1,767$500,000 to $749,999
- 285$750,000 to $999,999
- 103$1,000,000 to $1,499,999
- 15$1,500,000 to $1,999,999
- 26$2,000,000 or more
Rent paid by renters in 2022 in Bergenfield, NJ
-
- 134$200 to $249
- 17$250 to $299
- 5$400 to $449
- 51$500 to $549
- 59$550 to $599
- 11$800 to $899
- 211$900 to $999
- 276$1,000 to $1,249
- 435$1,250 to $1,499
- 1,174$1,500 to $1,999
- 233$2,000 to $2,499
- 30$2,500 to $2,999
- 57$3,000 to $3,499
- 21$3,500 or more
- 110No cash rent

Percentage of workers working in this county: 65.3%
Number of people working at home: 1,197 (8.1% of all workers)
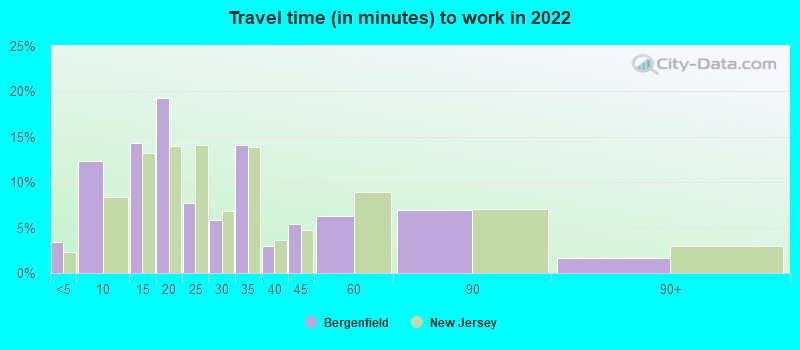
Travel time to work (commute)
- Less than 5 minutes: 177
- 5 to 9 minutes: 435
- 10 to 14 minutes: 1,295
- 15 to 19 minutes: 1,669
- 20 to 24 minutes: 1,870
- 25 to 29 minutes: 1,233
- 30 to 34 minutes: 1,835
- 35 to 39 minutes: 242
- 40 to 44 minutes: 660
- 45 to 59 minutes: 1,532
- 60 to 89 minutes: 1,363
- 90 or more minutes: 676
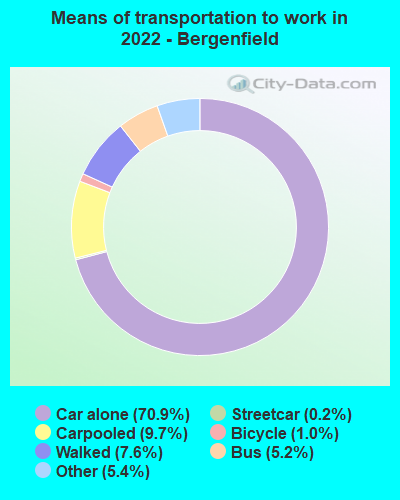
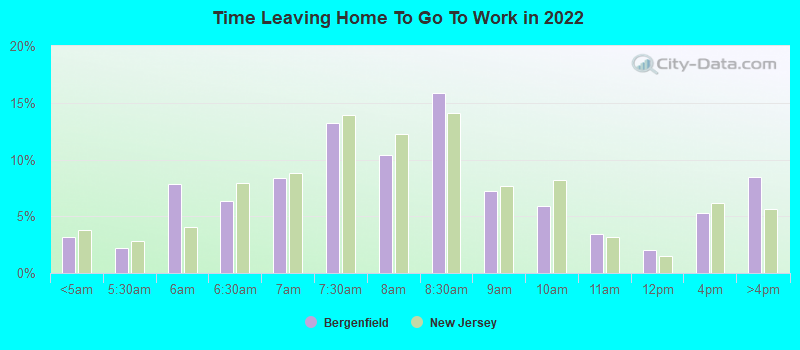
Means of transportation to work:
- Drove a car alone: 2,934 (54.6%)
- Carpooled: 480 (8.9%)
- Bus: 198 (3.7%)
- Subway or elevated rail: 7 (0.1%)
- Taxi: 256 (4.8%)
- Bicycle: 26 (0.5%)
- Walked: 336 (6.3%)
- Worked at home: 1,197 (22.3%)
- Unemployment by race in 2022
- Unemployment rate for White non-Hispanic residents
- 3.8%Males
- 1.4%Females
- Unemployment rate for Black residents
- 1.9%Males
- 6.8%Females
- Unemployment rate for Asian residents
- 8.6%Males
- 3.3%Females
- Unemployment rate for other race residents
- 1.1%Males
- 3.7%Females
- Unemployment rate for two or more race residents
- 5.9%Males
- 14.6%Females
- Unemployment rate for Hispanic or Latino residents
- 5.4%Males
- 7.0%Females

- Year of entry for the foreign-born population in Bergenfield, New Jersey
- 2,4182010 or later
- 2,3472000 to 2009
- 2,4821990 to 1999
- 2,5881980 to 1989
- 1,1621970 to 1979
- 1,432Before 1970

First ancestries reported:
- Italian: 951 (5.7%)
- American: 712 (4.3%)
- Irish: 512 (3.1%)
- Eastern European: 250 (1.5%)
- Polish: 197 (1.2%)
- Jamaican: 189 (1.1%)
- German: 170 (1.0%)
- African: 134 (0.8%)
- Ghanaian: 121 (0.7%)
- Greek: 100 (0.6%)
- Haitian: 90 (0.5%)
- Nigerian: 88 (0.5%)
- English: 76 (0.5%)
- West Indian: 64 (0.4%)
- Trinidadian and Tobagonian: 63 (0.4%)
- European: 62 (0.4%)
- Russian: 61 (0.4%)
- Hungarian: 58 (0.3%)
- Ukrainian: 55 (0.3%)
- Cypriot: 50 (0.3%)
- Armenian: 47 (0.3%)
- Latvian: 27 (0.2%)
- Israeli: 27 (0.2%)
- Dutch: 27 (0.2%)
- Croatian: 25 (0.2%)
- Barbadian: 25 (0.2%)
- Swiss: 24 (0.1%)
- Slavic: 23 (0.1%)
- Portuguese: 22 (0.1%)
- Scottish: 22 (0.1%)
- Turkish: 22 (0.1%)
- Guyanese: 21 (0.1%)
- Jordanian: 15 (0.09%)
- Arab: 15 (0.09%)
- Czech: 14 (0.08%)
- Northern European: 13 (0.08%)
- Pennsylvania German: 12 (0.07%)
- Belizean: 12 (0.07%)
- French: 12 (0.07%)
- Austrian: 9 (0.05%)
- Canadian: 9 (0.05%)
- Norwegian: 9 (0.05%)
- Brazilian: 8 (0.05%)
- French Canadian: 6 (0.04%)
Most common places of birth for foreign-born residents (%):
| Bergenfield: | 27.2% (3,048) |
| New Jersey: | 4.0% (85,934) |
| Bergenfield: | 11.7% (1,317) |
| New Jersey: | 4.2% (90,817) |
| Bergenfield: | 7.2% (810) |
| New Jersey: | 9.7% (209,055) |
| Bergenfield: | 6.3% (706) |
| New Jersey: | 12.8% (274,609) |
| Bergenfield: | 3.2% (358) |
| New Jersey: | 2.1% (45,435) |
| Bergenfield: | 3.1% (349) |
| New Jersey: | 3.3% (70,512) |
| Bergenfield: | 3.1% (345) |
| New Jersey: | 3.7% (78,969) |
| Bergenfield: | 2.4% (267) |
| New Jersey: | 4.8% (102,527) |
| Bergenfield: | 2.0% (226) |
| New Jersey: | 1.2% (25,213) |
| Bergenfield: | 1.7% (196) |
| New Jersey: | 4.4% (95,275) |
| Bergenfield: | 1.7% (191) |
| New Jersey: | 0.2% (3,359) |
| Bergenfield: | 1.7% (186) |
| New Jersey: | 2.2% (46,813) |
| Bergenfield: | 1.6% (183) |
| New Jersey: | 2.2% (47,365) |
| Bergenfield: | 1.5% (172) |
| New Jersey: | 0.7% (15,533) |
Place of birth for U.S.-born residents:
- This state: 9,263
- Other state: 6,985
- Northeast: 6,223
- Midwest: 260
- South: 269
- West: 166
94.8% of Bergenfield residents lived in the same house 1 years ago.
Out of people who lived in different houses, 34.8% lived in this county.
Out of people who lived in different counties, 11.9% lived in New Jersey.
| Bergenfield: | 94.8% |
| State average: | 90.4% |
Education attainment for males 25 years and older:
- No schooling: 137
- Nursery to 4th grade: 54
- 5th and 6th grade: 105
- 7th and 8th grade: 83
- 9th grade: 24
- 10th grade: 92
- 11th grade: 40
- 12th grade, no diploma: 228
- High school graduate (or equivalency): 2,125
- Less than 1 year of college: 502
- Some college more than 1 year, no degree: 1,142
- Associate degree: 624
- Bachelor's degree: 3,254
- Master's degree: 616
- Professional school degree: 173
- Doctorate degree: 189

Education attainment for females 25 years and older:
- No schooling: 234
- Nursery to 4th grade: 34
- 5th and 6th grade: 104
- 7th and 8th grade: 42
- 9th grade: 44
- 10th grade: 230
- 11th grade: 21
- 12th grade, no diploma: 141
- High school graduate (or equivalency): 2,506
- Less than 1 year of college: 444
- Some college more than 1 year, no degree: 715
- Associate degree: 894
- Bachelor's degree: 3,241
- Master's degree: 1,029
- Professional school degree: 247
- Doctorate degree: 93


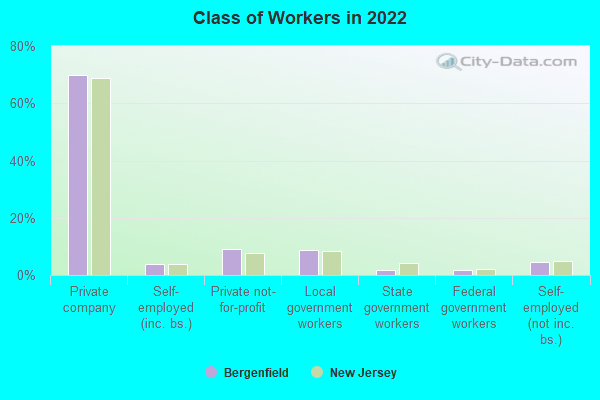
Housing units in structures:
- One, detached: 6,654
- One, attached: 222
- Two: 1,095
- 3 or 4: 440
- 5 to 9: 252
- 10 to 19: 383
- 20 to 49: 254
- 50 or more: 336
Housing units lacking complete kitchen facilities in 2022: 1.3%
House/condo owner moved in on average 18 years ago
Renter moved in on average 6 years ago

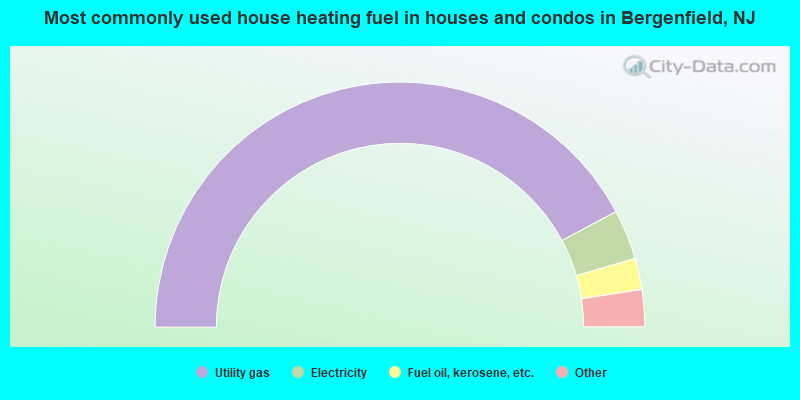
- 84.4%Utility gas
- 6.6%Electricity
- 4.1%Fuel oil, kerosene, etc.
- 3.6%Bottled, tank, or LP gas
- 0.6%No fuel used
- 0.6%Other fuel
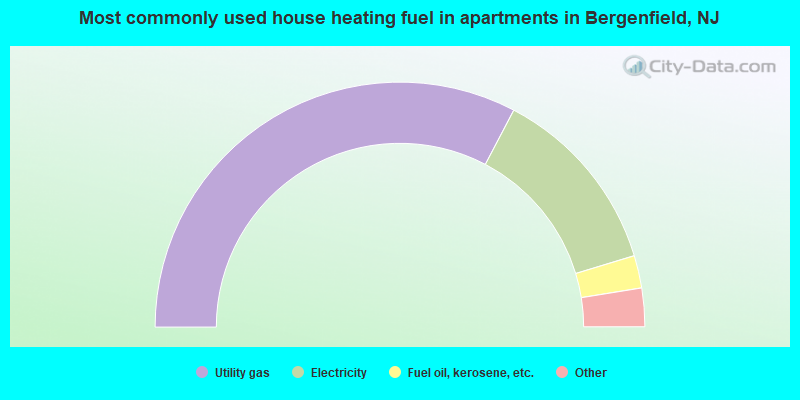
- 65.4%Utility gas
- 25.2%Electricity
- 4.3%Fuel oil, kerosene, etc.
- 3.1%Bottled, tank, or LP gas
- 1.7%No fuel used
- 0.3%Other fuel
Private vs. public school enrollment:
| Here: | 28.4% |
| New Jersey: | 12.3% |
| Here: | 14.3% |
| New Jersey: | 13.1% |
| Here: | 34.6% |
| New Jersey: | 33.2% |


