Ben Avon Heights, PA (Pennsylvania) Houses and Residents
| Ben Avon Heights: | $536,200 |
| Pennsylvania: | $245,500 |
Mean price in 2022:
Detached houses: $523,008
Here: $523,008 State: $317,202
Total population: 372 (All urban)
Houses: 108 (104 occupied: 102 owner occupied, 0 renter occupied)
| % of renters here: | 0% |
| State: | 31% |
Housing density: 642 houses/condos per square mile
Median price asked for vacant for-sale houses and condos in 2022 in this county: $195,117.
Housing units in Ben Avon Heights with a mortgage: 72 (8 second mortgage, 0 home equity loan, 6 both second mortgage and home equity loan)
Houses without a mortgage: 1
Median household income for houses/condos with a mortgage: $240,737
Median household income for apartments without a mortgage: $88,919
Median monthly housing costs: $2,318
Compare current foreclosures near Ben Avon Heights, PA:
| Photo | Address | Area | Beds / Baths | Price | Details |
|---|---|---|---|---|---|

|
#1
Triana St
Pittsburgh, PA 15210
|
1,184 sq. feet
|
1 baths 3 beds |
$151,500
|
show details |

|
#2
Dorothy Dr
Pittsburgh, PA 15235
|
956 sq. feet
|
1 baths 3 beds |
$66,500
|
show details |

|
#3
Punta Gorda St
East Mc Keesport, PA 15035
|
1,200 sq. feet
|
1 baths 3 beds |
$171,500
|
show details |

|
#4
Leslie St
East Mc Keesport, PA 15035
|
1,144 sq. feet
|
1 baths 2 beds |
$64,900
|
show details |

|
#5
Muirfield Dr
Presto, PA 15142
|
4,801 sq. feet
|
4 baths 5 beds |
$709,500
|
show details |

|
#6
Olga St
Ambridge, PA 15003
|
2,629 sq. feet
|
2 baths 4 beds |
$144,900
|
show details |

|
#7
Kirk Ave
Pittsburgh, PA 15227
|
1,500 sq. feet
|
2 baths 3 beds |
$197,500
|
show details |

|
#8
Brinwood Ave
Pittsburgh, PA 15227
|
1,000 sq. feet
|
2 baths 3 beds |
$229,900
|
show details |

|
#9
Shady Ln
Aliquippa, PA 15001
|
1,440 sq. feet
|
2 baths 3 beds |
$159,900
|
show details |

|
#10
Grant St
Carnegie, PA 15106
|
1,345 sq. feet
|
2 baths 4 beds |
$225,500
|
show details |
| Photo | Address | Area | Beds / Baths | Price | Details |
|---|---|---|---|---|---|

|
#11
Adams Ave
West Mifflin, PA 15122
|
3,106 sq. feet
|
4 baths 5 beds |
show details | |

|
#12
Lautner St
Pittsburgh, PA 15212
|
1,232 sq. feet
|
1 baths 2 beds |
show details | |

|
#13
Arizona Dr
Allison Park, PA 15101
|
1,191 sq. feet
|
1 baths 3 beds |
show details | |

|
#14
Black Oak Dr
Pittsburgh, PA 15235
|
1,508 sq. feet
|
3 baths 4 beds |
show details | |

|
#15
Fort Duquesne Blvd Apt 4a
Pittsburgh, PA 15222
|
1,032 sq. feet
|
1 baths 1 beds |
show details | |

|
#16
Everglade Dr
Pittsburgh, PA 15235
|
1,387 sq. feet
|
1 baths 3 beds |
show details | |

|
#17
Dublin Rd
Bethel Park, PA 15102
|
1,184 sq. feet
|
1 baths 3 beds |
show details | |

|
#18
Genessee
Pittsburgh, PA 15223
|
1,778 sq. feet
|
3 baths 4 beds |
show details | |

|
#19
Saratoga Dr
Pittsburgh, PA 15236
|
1,000 sq. feet
|
1 baths 2 beds |
show details | |

|
#20
Vesper St
Bridgeville, PA 15017
|
936 sq. feet
|
1 baths 3 beds |
show details |
| Photo | Address | Area | Beds / Baths | Price | Details |
|---|---|---|---|---|---|

|
#21
Outlook Dr
West Mifflin, PA 15122
|
1,075 sq. feet
|
1 baths 2 beds |
show details | |

|
#22
Florida Ave
Bethel Park, PA 15102
|
1,334 sq. feet
|
1 baths 3 beds |
show details | |

|
#23
Lehr Ave
Pittsburgh, PA 15223
|
1,242 sq. feet
|
1 baths 3 beds |
show details | |

|
#24
Washington St
Pittsburgh, PA 15223
|
1,488 sq. feet
|
1 baths 4 beds |
show details | |

|
#25
Wilson St
Pittsburgh, PA 15223
|
1,681 sq. feet
|
2 baths 3 beds |
show details | |

|
#26
Garrick Dr
Pittsburgh, PA 15235
|
1,397 sq. feet
|
2 baths 3 beds |
show details | |

|
#27
Hatfield St
Pittsburgh, PA 15201
|
1,798 sq. feet
|
1 baths 2 beds |
show details | |

|
#28
Oneill Dr
Bethel Park, PA 15102
|
1,954 sq. feet
|
2 baths 4 beds |
show details | |

|
#29
Vistaview St
West Mifflin, PA 15122
|
924 sq. feet
|
1 baths 3 beds |
show details | |

|
#30
Long Rd
Pittsburgh, PA 15235
|
1,780 sq. feet
|
1 baths 3 beds |
show details |
| Photo | Address | Area | Beds / Baths | Price | Details |
|---|---|---|---|---|---|

|
#31
Rodgers St
Pittsburgh, PA 15207
|
2,048 sq. feet
|
2 baths 4 beds |
show details | |

|
#32
Parkway Dr
Harwick, PA 15049
|
1,914 sq. feet
|
2 baths 4 beds |
show details | |

|
#33
Mckenzie Dr
Pittsburgh, PA 15235
|
1,428 sq. feet
|
1 baths 3 beds |
show details | |

|
#34
Mortimer Ave
Turtle Creek, PA 15145
|
1,090 sq. feet
|
1 baths 3 beds |
show details | |

|
#35
Greenway Dr
Pittsburgh, PA 15204
|
956 sq. feet
|
1 baths 3 beds |
show details | |

|
#36
Chartiers Ave
Pittsburgh, PA 15204
|
1,531 sq. feet
|
1 baths 4 beds |
show details | |

|
#37
5th Ave
Freedom, PA 15042
|
1,456 sq. feet
|
1 baths 3 beds |
show details | |

|
#38
Morton Ave
Mckeesport, PA 15133
|
1,328 sq. feet
|
1 baths 2 beds |
show details | |

|
#39
Donmor Dr
Pittsburgh, PA 15237
|
1,802 sq. feet
|
1 baths 3 beds |
show details | |

|
#40
Greensburg Pike
North Versailles, PA 15137
|
1,109 sq. feet
|
1 baths 2 beds |
show details |
| Photo | Address | Area | Beds / Baths | Price | Details |
|---|---|---|---|---|---|

|
#41
Muse Bishop Rd
Mc Donald, PA 15057
|
1,032 sq. feet
|
1 baths 3 beds |
show details | |

|
#42
Sunset Boulavard
Aliquippa, PA 15001
|
- sq. feet
|
1 baths 3 beds |
show details | |

|
#43
Kevin Dr
Sewickley, PA 15143
|
4,590 sq. feet
|
4 baths 5 beds |
show details | |

|
#44
Cypress Hill Dr
Pittsburgh, PA 15235
|
2,080 sq. feet
|
2 baths 4 beds |
show details | |

|
#45
Oak Avenue Ext
Turtle Creek, PA 15145
|
1,462 sq. feet
|
1 baths 2 beds |
show details | |

|
#46
Central Ave
North Versailles, PA 15137
|
1,285 sq. feet
|
1 baths 3 beds |
show details | |

|
#47
W Burgess St
Pittsburgh, PA 15214
|
1,764 sq. feet
|
1 baths 3 beds |
show details | |

|
#48
Walnut Ave
Pittsburgh, PA 15209
|
1,585 sq. feet
|
1 baths 3 beds |
show details | |

|
#49
Spring Garden Rd
Pittsburgh, PA 15212
|
1,088 sq. feet
|
1 baths 2 beds |
show details | |

|
Check over 1 million property listings on Foreclosure.com!
|
browse all offers | |||


 | Is there a contractor who builds "historic" homes? (101 replies) |
| Relocating to Pittsburgh! (47 replies) |
| Suburb(s) of the week: Ben Avon/Ben Avon Heights (10 replies) |
| Thoughts on Living in Ben Avon? (39 replies) |
| Back to Pittsburgh we Go (24 replies) |
| Ben Avon & Ross Township - Neighborhood Questions (13 replies) |

Household type by relationship:
Households: 308- Male householders: 45 (3 living alone), Female householders: 57 (13 living alone)
91 spouses (90 opposite-sex spouses), 4 unmarried partners, (2 opposite-sex unmarried partners), 105 children (100 natural, 3 adopted, 1 stepchildren), 0 grandchildren, 1 brothers or sisters, 0 parents, 0 foster children, 0 other relatives, 0 non-relatives
Size of family households: 30 2-persons, 19 3-persons, 19 4-persons, 8 5-persons.
Size of nonfamily households: 18 1-person, 5 2-persons.
77 married couples with children.
3 single-parent households (2 men, 1 women).
97.6% of residents of Ben Avon Heights speak English at home.
1.4% of residents speak other Indo-European language at home (50% speak English very well, 50% speak English not well).
Foreign born population: 8 (2.6%)
(100.0% of them are naturalized citizens)
| Here: | 8.4 |
| State: | 6.8 |
| Here: | -666666666.0 |
| State: | 4.3 |

- Bedrooms in owner-occupied houses and condos in Ben Avon Heights, Pennsylvania
- 0no bedroom
- 01 bedroom
- 72 bedrooms
- 433 bedrooms
- 334 bedrooms
- 205+ bedrooms

- Cars and other vehicles available in Ben Avon Heights in owner-occupied houses/condos
- 2no vehicle
- 151 vehicle
- 642 vehicles
- 103 vehicles
- 84 vehicles
- 45+ vehicles

- Rooms in owner-occupied houses in Ben Avon Heights, Pennsylvania
- 01 room
- 02 rooms
- 03 rooms
- 14 rooms
- 35 rooms
- 136 rooms
- 197 rooms
- 178 rooms
- 509+ rooms


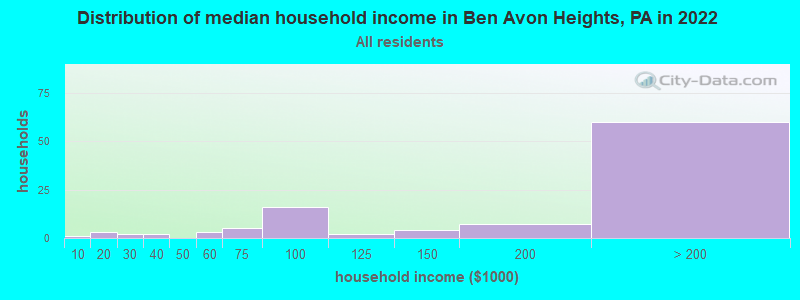
Ben Avon Heights, PA household income distribution

- 1Less than $10,000
- 3$10,000 to $19,999
- 2$20,000 to $29,999
- 2$30,000 to $39,999
- 3$50,000 to $59,999
- 5$60,000 to $74,999
- 16$75,000 to $99,999
- 2$100,000 to $124,999
- 4$125,000 to $149,999
- 7$150,000 to $199,999
- 60$200,000 or more
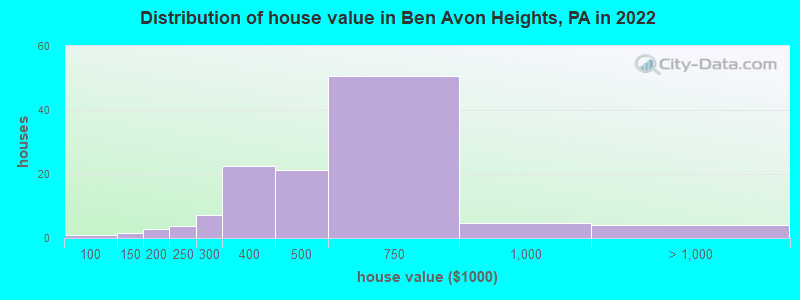
Home value of owner - occupied houses in 2022 in Ben Avon Heights, PA
-
- 0$80,000 to $89,999
- 0$100,000 to $124,999
- 0$125,000 to $149,999
- 2$150,000 to $174,999
- 3$200,000 to $249,999
- 7$250,000 to $299,999
- 22$300,000 to $399,999
- 21$400,000 to $499,999
- 50$500,000 to $749,999
- 4$750,000 to $999,999
- 3$1,000,000 to $1,499,999

Percentage of workers working in this county: 94.2%
Number of people working at home: 67 (39.2% of all workers)
Travel time to work (commute)
- Less than 5 minutes: 4
- 5 to 9 minutes: 3
- 10 to 14 minutes: 1
- 15 to 19 minutes: 13
- 20 to 24 minutes: 38
- 25 to 29 minutes: 13
- 30 to 34 minutes: 13
- 35 to 39 minutes: 11
- 40 to 44 minutes: 5
- 45 to 59 minutes: 5
- 60 to 89 minutes: 1
- 90 or more minutes: 1
Means of transportation to work:
- Drove a car alone: 124 (76.1%)
- Carpooled: 16 (9.8%)
- Bus or trolley bus: 1 (0.6%)
- Walked: 7 (4.3%)
- Other means: 4 (2.5%)
- Worked at home: 11 (6.7%)

- Unemployment by race in 2022
- Unemployment rate for White non-Hispanic residents
- 4.8%Males

- Year of entry for the foreign-born population in Ben Avon Heights, Pennsylvania
- 12010 or later
- 02000 to 2009
- 11990 to 1999
- 21980 to 1989
- 01970 to 1979
- 0Before 1970
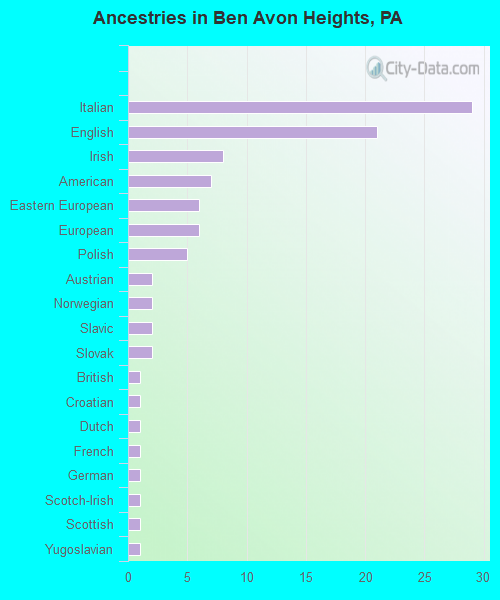
First ancestries reported:
- Italian: 29 (26.7%)
- English: 21 (19.3%)
- Irish: 8 (7.4%)
- American: 7 (6.4%)
- Eastern European: 6 (5.5%)
- European: 6 (5.5%)
- Polish: 5 (4.6%)
- Austrian: 2 (1.8%)
- Norwegian: 2 (1.8%)
- Slavic: 2 (1.8%)
- Slovak: 2 (1.8%)
- British: 1 (0.9%)
- Croatian: 1 (0.9%)
- Dutch: 1 (0.9%)
- French: 1 (0.9%)
- German: 1 (0.9%)
- Scotch-Irish: 1 (0.9%)
- Scottish: 1 (0.9%)
- Yugoslavian: 1 (0.9%)
Most common places of birth for foreign-born residents (%):
| Ben Avon Heights: | 22.2% (2) |
| Pennsylvania: | 2.9% (27,433) |
| Ben Avon Heights: | 22.2% (2) |
| Pennsylvania: | 1.8% (17,032) |
| Ben Avon Heights: | 11.1% (1) |
| Pennsylvania: | 0.2% (2,004) |
| Ben Avon Heights: | 11.1% (1) |
| Pennsylvania: | 7.2% (67,704) |
| Ben Avon Heights: | 11.1% (1) |
| Pennsylvania: | 0.6% (5,598) |
Place of birth for U.S.-born residents:
- This state: 223
- Other state: 78
- Northeast: 27
- Midwest: 26
- South: 14
- West: 8
98.1% of Ben Avon Heights residents lived in the same house 1 years ago.
Out of people who lived in different houses, 38.5% lived in this county.
Out of people who lived in different counties, 0.0% lived in Pennsylvania.
| Ben Avon Heights: | 98.1% |
| State average: | 89.3% |
Education attainment for males 25 years and older:
- No schooling: 0
- Nursery to 4th grade: 0
- 5th and 6th grade: 0
- 7th and 8th grade: 0
- 9th grade: 0
- 10th grade: 0
- 11th grade: 0
- 12th grade, no diploma: 4
- High school graduate (or equivalency): 8
- Less than 1 year of college: 0
- Some college more than 1 year, no degree: 1
- Associate degree: 5
- Bachelor's degree: 41
- Master's degree: 27
- Professional school degree: 12
- Doctorate degree: 1

Education attainment for females 25 years and older:
- No schooling: 0
- Nursery to 4th grade: 0
- 5th and 6th grade: 0
- 7th and 8th grade: 0
- 9th grade: 0
- 10th grade: 0
- 11th grade: 0
- 12th grade, no diploma: 0
- High school graduate (or equivalency): 2
- Less than 1 year of college: 2
- Some college more than 1 year, no degree: 4
- Associate degree: 6
- Bachelor's degree: 49
- Master's degree: 34
- Professional school degree: 7
- Doctorate degree: 0


Housing units in structures:
- One, detached: 108

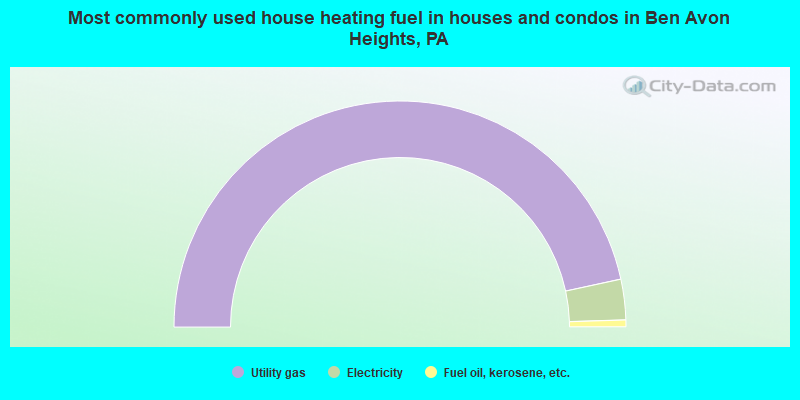
- 93.3%Utility gas
- 5.8%Electricity
- 1.0%Fuel oil, kerosene, etc.
Private vs. public school enrollment:
| Here: | 9.5% |
| Pennsylvania: | 15.7% |
| Here: | 27.3% |
| Pennsylvania: | 13.4% |
| Here: | 20.0% |
| Pennsylvania: | 39.8% |


