Belmont, CA (California) Houses and Residents
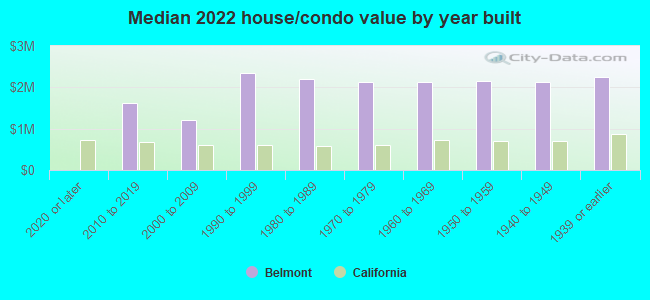
| Belmont: | $2,201,486 |
| California: | $715,900 |
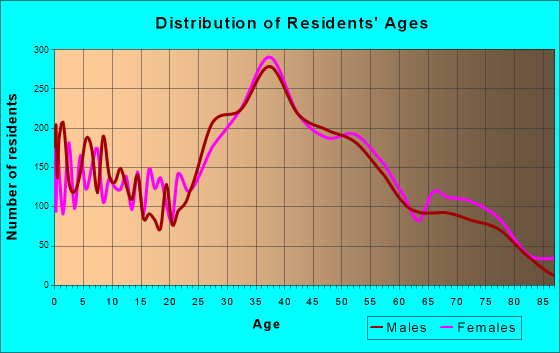
Total population: 27,073 (Urban population: 25,138, Rural population: 0)
Houses: 11,665 (10,932 occupied: 6,071 owner occupied, 4,649 renter occupied)
| % of renters here: | 43% |
| State: | 44% |
Housing density: 2,577 houses/condos per square mile
Median price asked for vacant for-sale houses and condos in 2022: $4,320,860.
Median contract rent in 2022: over $2,000 (lower quartile is over $2,000, upper quartile is over $2,000)
Median rent asked for vacant for-rent units in 2022: $4,312
Median gross rent in Belmont, CA in 2022: over $2,000
Housing units in Belmont with a mortgage: 4,094 (619 second mortgage, 28 home equity loan, 514 both second mortgage and home equity loan)
Houses without a mortgage: 25
Median household income for houses/condos with a mortgage: $258,196
Median household income for apartments without a mortgage: $162,153
Median monthly housing costs: $3,021
Compare current foreclosures near Belmont, CA:
| Photo | Address | Area | Beds / Baths | Price | Details |
|---|---|---|---|---|---|

|
#1
San Juan Blvd
Belmont, CA 94002
|
1,430 sq. feet
|
2 baths 3 beds |
show details | |

|
#2
Continentals Way Apt 302
Belmont, CA 94002
|
1,107 sq. feet
|
2 baths 2 beds |
show details | |

|
#3
Continentals Way Apt 302
Belmont, CA 94002
|
1,107 sq. feet
|
2 baths 2 beds |
show details | |

|
#4
6th Ave
Belmont, CA 94002
|
1,610 sq. feet
|
2 baths 3 beds |
show details | |

|
#5
Carlmont Dr Apt 401c
Belmont, CA 94002
|
- sq. feet
|
- baths - beds |
show details | |

|
#6
El Camino Real
Belmont, CA 94002
|
- sq. feet
|
- baths - beds |
show details | |

|
#7
Wickman Pl
San Lorenzo, CA 94580
|
900 sq. feet
|
1 baths 2 beds |
show details | |

|
#8
Woodside Way Apt
San Mateo, CA 94401
|
4,387 sq. feet
|
5 baths 8 beds |
show details | |

|
#9
Dewey Pl
Fremont, CA 94538
|
1,232 sq. feet
|
2 baths 3 beds |
show details | |

|
#10
Alameda De Las Pulgas
Redwood City, CA 94061
|
1,250 sq. feet
|
2 baths 3 beds |
show details |
| Photo | Address | Area | Beds / Baths | Price | Details |
|---|---|---|---|---|---|

|
#11
Cayuga Ave
San Francisco, CA 94112
|
1,340 sq. feet
|
1 baths 3 beds |
show details | |

|
#12
Lobos St
San Francisco, CA 94112
|
750 sq. feet
|
1 baths 2 beds |
show details | |

|
#13
Hemlock Ave
Redwood City, CA 94061
|
1,440 sq. feet
|
2 baths 4 beds |
show details | |

|
#14
Hurlingame Ave
Redwood City, CA 94063
|
1,397 sq. feet
|
2 baths 4 beds |
show details | |

|
#15
Madrid St
San Francisco, CA 94112
|
1,745 sq. feet
|
2 baths 3 beds |
show details | |

|
#16
Hempstead Pl
Redwood City, CA 94061
|
1,020 sq. feet
|
1 baths 3 beds |
show details | |

|
#17
Cymbidium Cir
South San Francisco, CA 94080
|
1,610 sq. feet
|
2 baths 3 beds |
show details | |

|
#18
Nevada St
Oakland, CA 94603
|
782 sq. feet
|
1 baths 2 beds |
show details | |

|
#19
Raymond Ave
San Francisco, CA 94134
|
975 sq. feet
|
1 baths 3 beds |
show details | |

|
#20
S Humboldt St
San Mateo, CA 94401
|
1,290 sq. feet
|
2 baths 3 beds |
show details |
| Photo | Address | Area | Beds / Baths | Price | Details |
|---|---|---|---|---|---|

|
#21
7th Ave
Menlo Park, CA 94025
|
1,689 sq. feet
|
2 baths 3 beds |
show details | |

|
#22
Cedar Ct
Daly City, CA 94014
|
1,200 sq. feet
|
2 baths 3 beds |
show details | |

|
#23
3rd St
Hayward, CA 94541
|
1,324 sq. feet
|
1 baths 2 beds |
show details | |

|
#24
Vienna St
San Francisco, CA 94112
|
760 sq. feet
|
1 baths 3 beds |
show details | |

|
#25
Manor Dr
Pacifica, CA 94044
|
1,360 sq. feet
|
2 baths 3 beds |
show details | |

|
#26
Sevier Ave
Menlo Park, CA 94025
|
1,030 sq. feet
|
1 baths 3 beds |
show details | |

|
#27
Hollister Ave
San Francisco, CA 94124
|
1,000 sq. feet
|
3 baths 5 beds |
show details | |

|
#28
Saratoga Ave
Palo Alto, CA 94303
|
750 sq. feet
|
1 baths 3 beds |
show details | |

|
#29
Madrid St
San Francisco, CA 94112
|
1,018 sq. feet
|
1 baths 4 beds |
show details | |

|
#30
Harkness Ave
San Francisco, CA 94134
|
1,412 sq. feet
|
2 baths 3 beds |
show details |
| Photo | Address | Area | Beds / Baths | Price | Details |
|---|---|---|---|---|---|

|
#31
Marcella St
San Leandro, CA 94578
|
1,426 sq. feet
|
1 baths 3 beds |
show details | |

|
#32
Fleetwood Dr
San Bruno, CA 94066
|
1,440 sq. feet
|
3 baths 5 beds |
show details | |

|
#33
Quesada Ave
San Francisco, CA 94124
|
2,220 sq. feet
|
4 baths 10 beds |
show details | |

|
#34
Sherman Dr
Union City, CA 94587
|
1,463 sq. feet
|
2 baths 4 beds |
show details | |

|
#35
Mirada Rd
Half Moon Bay, CA 94019
|
2,450 sq. feet
|
4 baths 4 beds |
show details | |

|
#36
Early Rivers Pl
Union City, CA 94587
|
1,550 sq. feet
|
2 baths 4 beds |
show details | |

|
#37
Munich St
San Francisco, CA 94112
|
1,103 sq. feet
|
1 baths 2 beds |
show details | |

|
#38
Tribune Ave
Hayward, CA 94542
|
2,234 sq. feet
|
2 baths 4 beds |
show details | |

|
#39
105th Ave
Oakland, CA 94603
|
780 sq. feet
|
1 baths 2 beds |
show details | |

|
#40
Endicott St
San Leandro, CA 94579
|
1,164 sq. feet
|
1 baths 2 beds |
show details |
| Photo | Address | Area | Beds / Baths | Price | Details |
|---|---|---|---|---|---|

|
#41
Lorenzo Ave
San Lorenzo, CA 94580
|
2,037 sq. feet
|
2 baths 2 beds |
show details | |

|
#42
F St
Oakland, CA 94603
|
842 sq. feet
|
1 baths 2 beds |
show details | |

|
#43
Mulberry St
Newark, CA 94560
|
984 sq. feet
|
1 baths 3 beds |
show details | |

|
#44
Peralta Ave
San Francisco, CA 94110
|
1,222 sq. feet
|
1 baths 2 beds |
show details | |

|
#45
Chestnut St
San Carlos, CA 94070
|
1,390 sq. feet
|
2 baths 3 beds |
show details | |

|
#46
Byxbee St
San Francisco, CA 94132
|
800 sq. feet
|
1 baths 1 beds |
show details | |

|
#47
D St
Oakland, CA 94603
|
1,140 sq. feet
|
1 baths 3 beds |
show details | |

|
#48
Lorenzo Ave
San Lorenzo, CA 94580
|
1,937 sq. feet
|
1 baths 3 beds |
show details | |

|
#49
Chapman Dr
Newark, CA 94560
|
2,456 sq. feet
|
2 baths 5 beds |
show details | |

|
Check over 1 million property listings on Foreclosure.com!
|
browse all offers | |||

Latest news about housing in Belmont, CA collected exclusively by city-data.com from local newspapers, TV, and radio stations


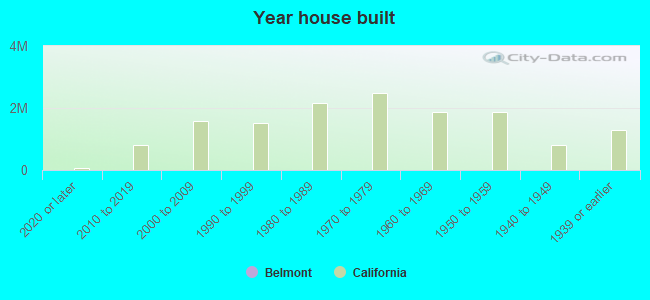
Median year apartment built: 1972
Household type by relationship:
Households: 26,895- Male householders: 6,078 (1,110 living alone), Female householders: 4,373 (1,362 living alone)
6,102 spouses (6,009 opposite-sex spouses), 699 unmarried partners, (685 opposite-sex unmarried partners), 7,694 children (7,281 natural, 185 adopted, 227 stepchildren), 67 grandchildren, 121 brothers or sisters, 179 parents, 0 foster children, 210 other relatives, 653 non-relatives
- In group quarters: 713
Size of family households: 2,843 2-persons, 2,091 3-persons, 1,544 4-persons, 400 5-persons, 34 6-persons, 30 7-or-more-persons.
Size of nonfamily households: 2,796 1-person, 918 2-persons, 59 3-persons, 18 4-persons.
5,033 married couples with children.
763 single-parent households (240 men, 523 women).
65.4% of residents of Belmont speak English at home.
7.3% of residents speak Spanish at home (79% speak English very well, 14% speak English well, 5% speak English not well, 2% don't speak English at all).
10.0% of residents speak other Indo-European language at home (83% speak English very well, 13% speak English well, 4% speak English not well).
16.4% of residents speak Asian or Pacific Island language at home (75% speak English very well, 17% speak English well, 7% speak English not well, 1% don't speak English at all).
0.9% of residents speak other language at home (52% speak English very well, 17% speak English well, 31% speak English not well).
Foreign born population: 8,157 (30.3%)
(57.3% of them are naturalized citizens)
| Here: | 6.3 |
| State: | 6.0 |
| Here: | 3.3 |
| State: | 3.9 |
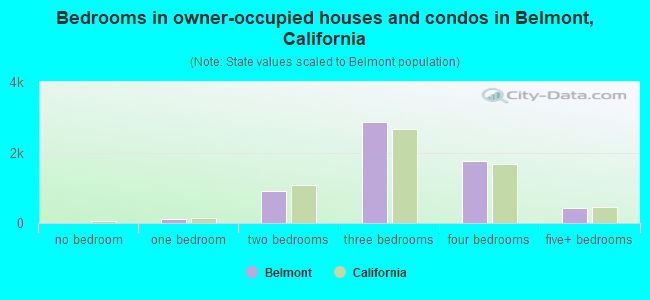
- Bedrooms in owner-occupied houses and condos in Belmont, California
- 0no bedroom
- 1001 bedroom
- 9192 bedrooms
- 2,8713 bedrooms
- 1,7544 bedrooms
- 4265+ bedrooms
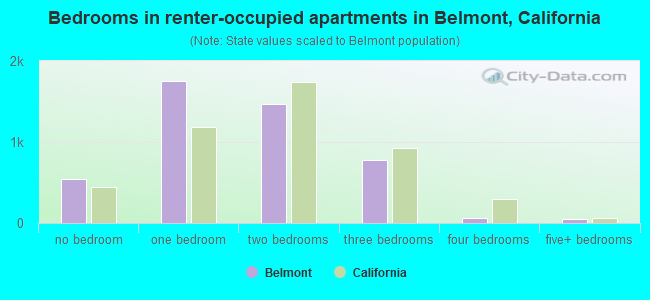
- Bedrooms in renter-occupied apartments in Belmont, California
- 543no bedroom
- 1,7481 bedroom
- 1,4642 bedrooms
- 7793 bedrooms
- 654 bedrooms
- 505+ bedrooms
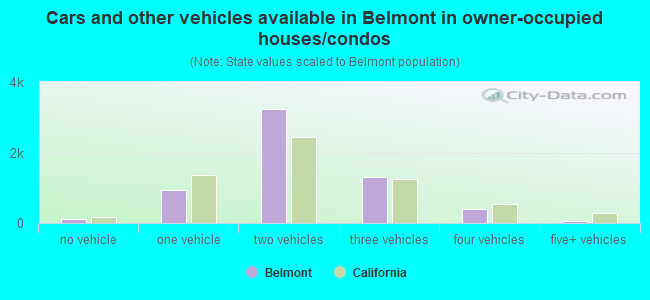
- Cars and other vehicles available in Belmont in owner-occupied houses/condos
- 107no vehicle
- 9381 vehicle
- 3,2402 vehicles
- 1,3143 vehicles
- 4084 vehicles
- 645+ vehicles
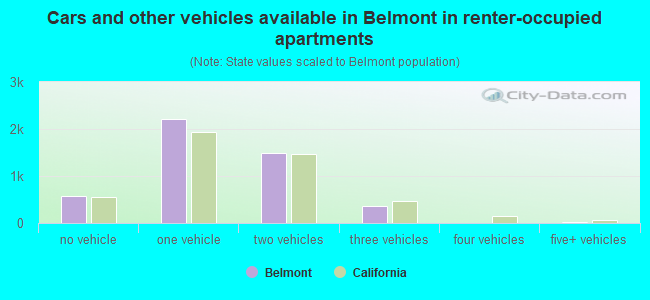
- Cars and other vehicles available in Belmont in renter-occupied apartments
- 580no vehicle
- 2,2211 vehicle
- 1,4842 vehicles
- 3533 vehicles
- 04 vehicles
- 125+ vehicles
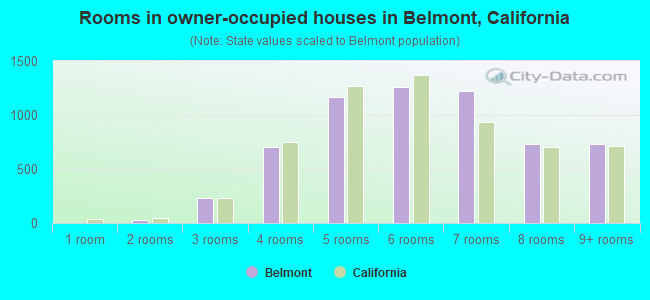
- Rooms in owner-occupied houses in Belmont, California
- 01 room
- 322 rooms
- 2363 rooms
- 7004 rooms
- 1,1655 rooms
- 1,2626 rooms
- 1,2187 rooms
- 7278 rooms
- 7319+ rooms
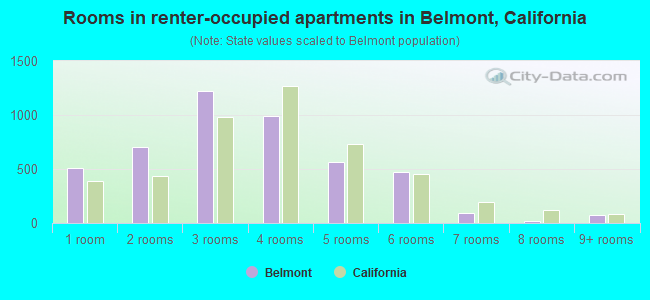
- Rooms in renter-occupied apartments in Belmont, California
- 5121 room
- 7022 rooms
- 1,2223 rooms
- 9894 rooms
- 5685 rooms
- 4696 rooms
- 967 rooms
- 228 rooms
- 709+ rooms
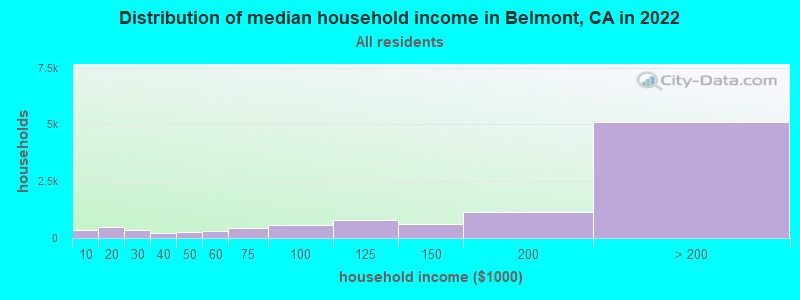
Belmont, CA household income distribution

- 335Less than $10,000
- 477$10,000 to $19,999
- 363$20,000 to $29,999
- 224$30,000 to $39,999
- 246$40,000 to $49,999
- 317$50,000 to $59,999
- 461$60,000 to $74,999
- 571$75,000 to $99,999
- 774$100,000 to $124,999
- 635$125,000 to $149,999
- 1,140$150,000 to $199,999
- 5,105$200,000 or more
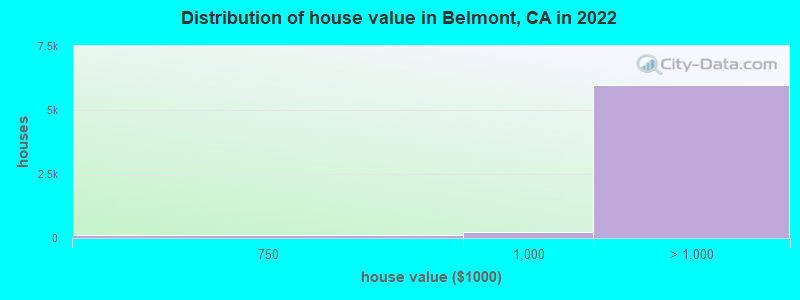
Home value of owner - occupied houses in 2022 in Belmont, CA
-
- 34Less than $10,000
- 7$25,000 to $29,999
- 3$90,000 to $99,999
- 2$125,000 to $149,999
- 12$150,000 to $174,999
- 8$175,000 to $199,999
- 24$200,000 to $249,999
- 12$300,000 to $399,999
- 121$500,000 to $749,999
- 226$750,000 to $999,999
- 819$1,000,000 to $1,499,999
- 1,590$1,500,000 to $1,999,999
- 3,569$2,000,000 or more
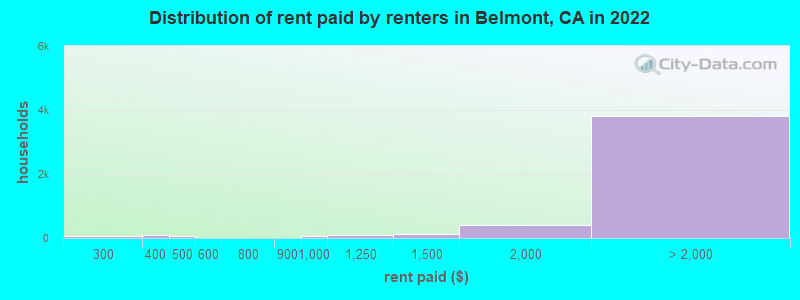
Rent paid by renters in 2022 in Belmont, CA
-
- 24$150 to $199
- 55$200 to $249
- 103$300 to $349
- 77$400 to $449
- 8$500 to $549
- 12$800 to $899
- 60$900 to $999
- 93$1,000 to $1,249
- 130$1,250 to $1,499
- 397$1,500 to $1,999
- 966$2,000 to $2,499
- 1,220$2,500 to $2,999
- 807$3,000 to $3,499
- 713$3,500 or more
- 117No cash rent
Percentage of workers working in this county: 80.8%
Number of people working at home: 5,092 (37.3% of all workers)
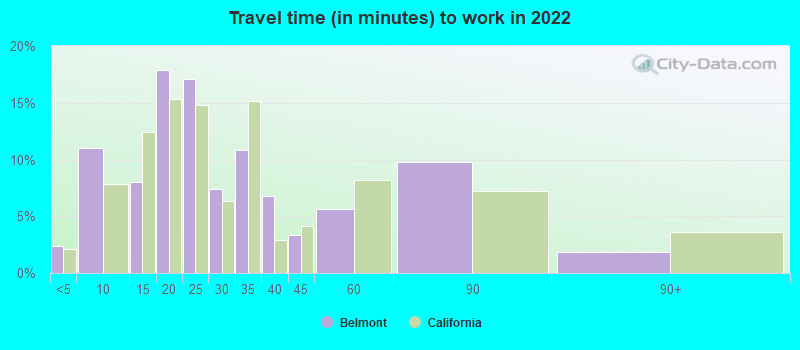
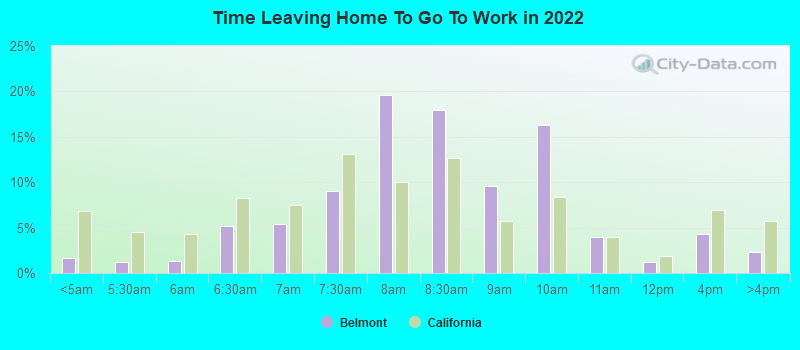
Travel time to work (commute)
- Less than 5 minutes: 89
- 5 to 9 minutes: 667
- 10 to 14 minutes: 1,436
- 15 to 19 minutes: 1,330
- 20 to 24 minutes: 1,378
- 25 to 29 minutes: 573
- 30 to 34 minutes: 1,094
- 35 to 39 minutes: 541
- 40 to 44 minutes: 512
- 45 to 59 minutes: 666
- 60 to 89 minutes: 507
- 90 or more minutes: 203
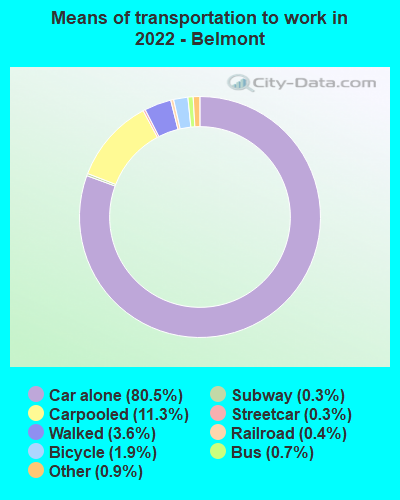
Means of transportation to work:
- Drove a car alone: 4,037 (43.2%)
- Carpooled: 617 (6.6%)
- Bus: 33 (0.4%)
- Subway or elevated rail: 13 (0.1%)
- Long-distance train or commuter rail: 16 (0.2%)
- Light rail, streetcar or trolley: 20 (0.2%)
- Taxi: 38 (0.4%)
- Bicycle: 107 (1.1%)
- Walked: 203 (2.2%)
- Worked at home: 5,092 (54.5%)
- Unemployment by race in 2022
- Unemployment rate for White non-Hispanic residents
- 1.5%Males
- 8.6%Females
- Unemployment rate for Asian residents
- 4.1%Males
- 8.6%Females
- Unemployment rate for other race residents
- 3.7%Males
- Unemployment rate for two or more race residents
- 0.7%Males
- 1.1%Females
- Unemployment rate for Hispanic or Latino residents
- 4.2%Males
- 2.2%Females
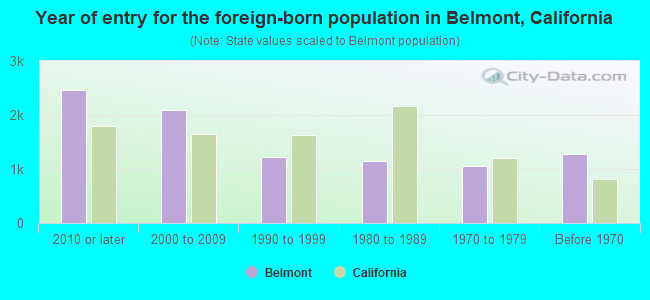
- Year of entry for the foreign-born population in Belmont, California
- 2,4552010 or later
- 2,0982000 to 2009
- 1,2261990 to 1999
- 1,1511980 to 1989
- 1,0561970 to 1979
- 1,287Before 1970
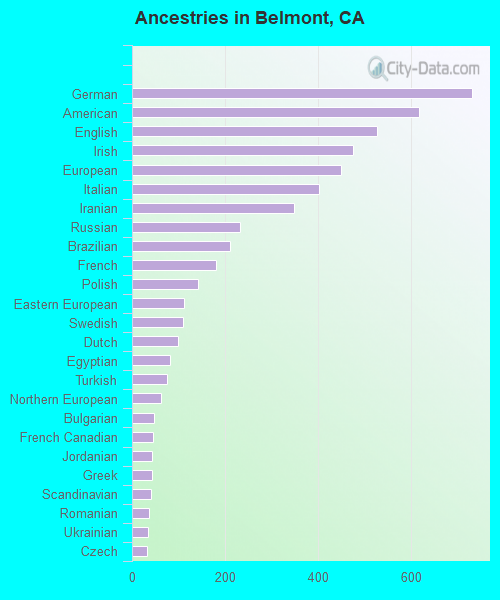
First ancestries reported:
- German: 732 (5.1%)
- American: 617 (4.3%)
- English: 528 (3.7%)
- Irish: 475 (3.3%)
- European: 450 (3.1%)
- Italian: 402 (2.8%)
- Iranian: 349 (2.4%)
- Russian: 232 (1.6%)
- Brazilian: 212 (1.5%)
- French: 181 (1.3%)
- Polish: 142 (1.0%)
- Eastern European: 111 (0.8%)
- Swedish: 109 (0.8%)
- Dutch: 98 (0.7%)
- Egyptian: 82 (0.6%)
- Turkish: 75 (0.5%)
- Northern European: 63 (0.4%)
- Bulgarian: 48 (0.3%)
- French Canadian: 45 (0.3%)
- Jordanian: 44 (0.3%)
- Greek: 44 (0.3%)
- Scandinavian: 41 (0.3%)
- Romanian: 36 (0.3%)
- Ukrainian: 35 (0.2%)
- Czech: 33 (0.2%)
- Maltese: 33 (0.2%)
- Armenian: 33 (0.2%)
- Portuguese: 31 (0.2%)
- Norwegian: 25 (0.2%)
- Celtic: 22 (0.2%)
- Hungarian: 18 (0.1%)
- Croatian: 18 (0.1%)
- British: 18 (0.1%)
- Slovene: 17 (0.1%)
- Lebanese: 16 (0.1%)
- Danish: 13 (0.09%)
- Scotch-Irish: 12 (0.08%)
- Scottish: 12 (0.08%)
- Ethiopian: 12 (0.08%)
- Latvian: 11 (0.08%)
- Australian: 11 (0.08%)
- Assyrian: 10 (0.07%)
- Finnish: 8 (0.06%)
- Slovak: 8 (0.06%)
- Moroccan: 6 (0.04%)
- New Zealander: 2 (0.01%)
Most common places of birth for foreign-born residents (%):
| Belmont: | 17.4% (1,435) |
| California: | 5.2% (539,184) |
| Belmont: | 14.0% (1,153) |
| California: | 6.6% (684,672) |
| Belmont: | 6.1% (507) |
| California: | 7.8% (818,297) |
| Belmont: | 5.4% (449) |
| California: | 37.2% (3,881,193) |
| Belmont: | 4.1% (335) |
| California: | 1.0% (105,215) |
| Belmont: | 3.6% (299) |
| California: | 2.0% (206,004) |
| Belmont: | 3.5% (291) |
| California: | 4.9% (512,335) |
| Belmont: | 3.5% (290) |
| California: | 3.0% (315,248) |
| Belmont: | 3.3% (274) |
| California: | 1.7% (176,274) |
| Belmont: | 3.1% (257) |
| California: | 0.5% (53,222) |
| Belmont: | 2.3% (186) |
| California: | 1.2% (127,477) |
| Belmont: | 2.1% (170) |
| California: | 4.2% (440,287) |
| Belmont: | 1.9% (158) |
| California: | 0.7% (73,304) |
| Belmont: | 1.9% (156) |
| California: | 0.4% (40,224) |
| Belmont: | 1.8% (148) |
| California: | 0.3% (31,439) |
| Belmont: | 1.7% (138) |
| California: | 1.0% (103,575) |
| Belmont: | 1.6% (129) |
| California: | 0.2% (16,541) |
Place of birth for U.S.-born residents:
- This state: 13,039
- Other state: 5,268
- Northeast: 1,729
- Midwest: 1,316
- South: 1,213
- West: 977
84.4% of Belmont residents lived in the same house 1 years ago.
Out of people who lived in different houses, 36.2% lived in this county.
Out of people who lived in different counties, 71.2% lived in California.
| Belmont: | 84.4% |
| State average: | 88.9% |
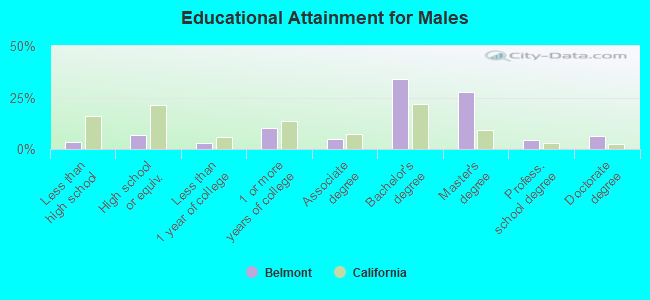
Education attainment for males 25 years and older:
- No schooling: 162
- Nursery to 4th grade: 0
- 5th and 6th grade: 46
- 7th and 8th grade: 19
- 9th grade: 10
- 10th grade: 24
- 11th grade: 31
- 12th grade, no diploma: 30
- High school graduate (or equivalency): 672
- Less than 1 year of college: 277
- Some college more than 1 year, no degree: 999
- Associate degree: 454
- Bachelor's degree: 3,305
- Master's degree: 2,717
- Professional school degree: 429
- Doctorate degree: 613
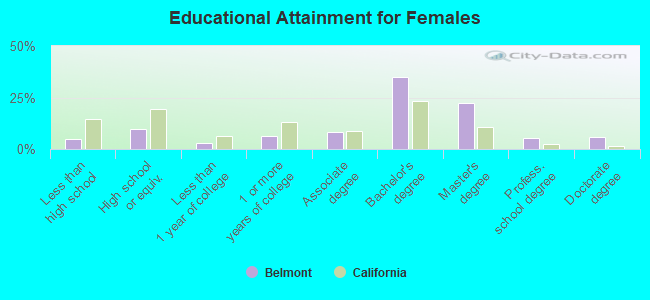
Education attainment for females 25 years and older:
- No schooling: 85
- Nursery to 4th grade: 12
- 5th and 6th grade: 169
- 7th and 8th grade: 3
- 9th grade: 9
- 10th grade: 4
- 11th grade: 8
- 12th grade, no diploma: 201
- High school graduate (or equivalency): 955
- Less than 1 year of college: 293
- Some college more than 1 year, no degree: 624
- Associate degree: 844
- Bachelor's degree: 3,475
- Master's degree: 2,229
- Professional school degree: 525
- Doctorate degree: 564
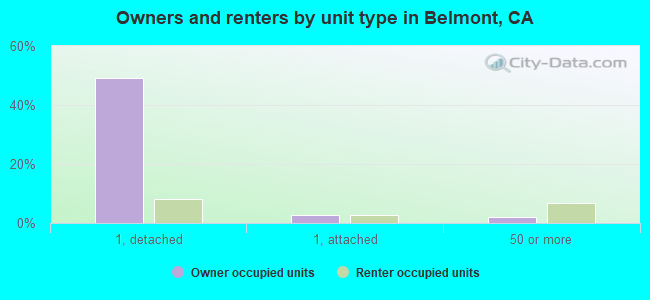
Housing units in structures:
- One, detached: 6,333
- One, attached: 636
- Two: 193
- 3 or 4: 200
- 5 to 9: 689
- 10 to 19: 1,008
- 20 to 49: 1,448
- 50 or more: 1,142
- Mobile homes: 14
Housing units lacking complete kitchen facilities in 2022: 2.7%
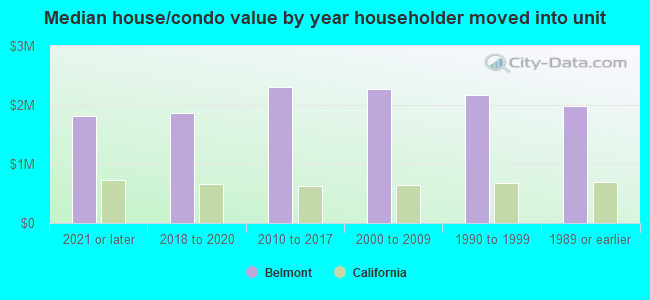
House/condo owner moved in on average 16 years ago
Renter moved in on average 2 years ago
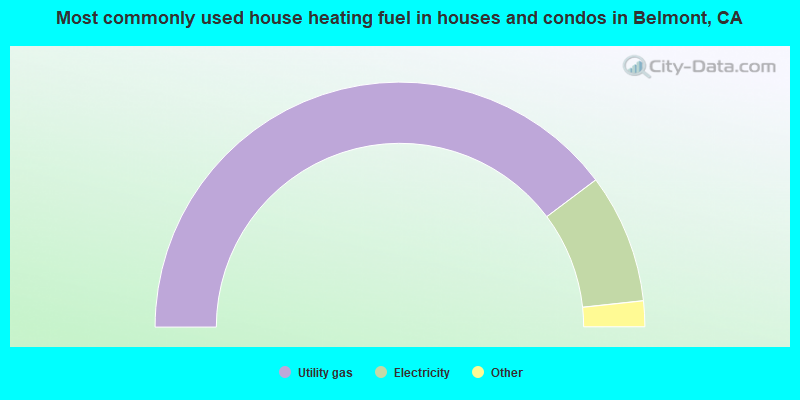
- 79.5%Utility gas
- 17.1%Electricity
- 1.9%Bottled, tank, or LP gas
- 0.7%Wood
- 0.6%Solar energy
- 0.2%No fuel used
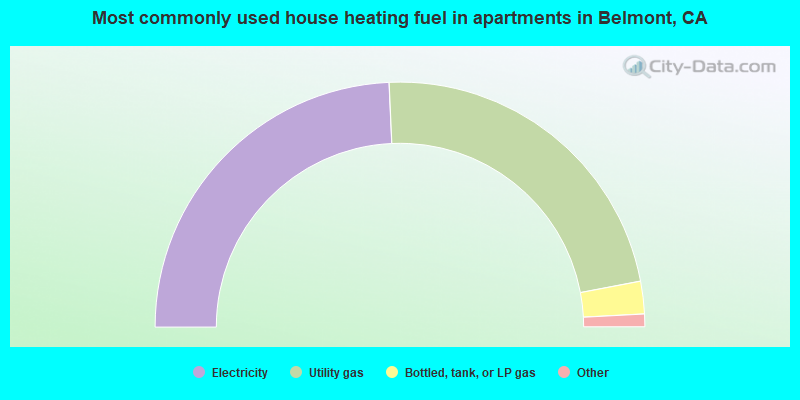
- 48.6%Electricity
- 45.4%Utility gas
- 4.3%Bottled, tank, or LP gas
- 1.4%No fuel used
- 0.3%Other fuel
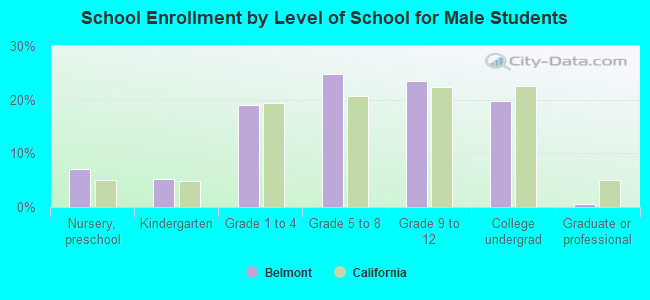
Private vs. public school enrollment:
| Here: | 10.0% |
| California: | 10.5% |
| Here: | 9.0% |
| California: | 8.5% |
| Here: | 20.0% |
| California: | 15.9% |