Belmar, NJ (New Jersey) Houses and Residents
| Belmar: | $795,946 |
| New Jersey: | $428,900 |
Mean price in 2022:
Detached houses: $1,106,354
Here: $1,106,354 State: $537,591 Townhouses or other attached units: $1,161,742
Here: $1,161,742 State: $381,113 In 2-unit structures: $722,952
Here: $722,952 State: $444,476 In 3-to-4-unit structures: $755,983
Here: $755,983 State: $457,463 In 5-or-more-unit structures: $560,749
Here: $560,749 State: $368,745
Total population: 5,719 (All urban)
Houses: 3,851 (2,713 occupied: 1,404 owner occupied, 1,356 renter occupied)
| % of renters here: | 49% |
| State: | 35% |
Housing density: 3,772 houses/condos per square mile
Median price asked for vacant for-sale houses and condos in 2022: $286,522.
Median contract rent in 2022: $1,570 (lower quartile is $1,145, upper quartile is over $2,000)
Median rent asked for vacant for-rent units in 2022: $3,681
Median gross rent in Belmar, NJ in 2022: $1,698
Housing units in Belmar with a mortgage: 694 (90 second mortgage, 0 home equity loan, 89 both second mortgage and home equity loan)
Houses without a mortgage: 13
Median household income for houses/condos with a mortgage: $140,903
Median household income for apartments without a mortgage: $92,111
Median monthly housing costs: $1,618
Compare current foreclosures in Belmar, NJ:
| Photo | Address | Area | Beds / Baths | Price | Details |
|---|---|---|---|---|---|

|
#1
Tennis Ct
Belmar, NJ 07719
|
1,700 sq. feet
|
- baths 3 beds |
show details | |

|
#2
11th Ave
Belmar, NJ 07719
|
1,044 sq. feet
|
- baths - beds |
show details | |

|
#3
Main St Unit 203
Belmar, NJ 07719
|
- sq. feet
|
- baths - beds |
show details | |

|
#4
Ocean Ave Apt 24a
Belmar, NJ 07719
|
- sq. feet
|
- baths - beds |
show details | |

|
#5
Carmerville Rd
Belmar, NJ 07719
|
1,922 sq. feet
|
- baths - beds |
show details | |

|
#6
Carmerville Rd
Belmar, NJ 07719
|
1,922 sq. feet
|
- baths - beds |
show details | |

|
#7
Inlet Ter
Belmar, NJ 07719
|
3,532 sq. feet
|
- baths - beds |
show details | |

|
#8
M St
Belmar, NJ 07719
|
1,441 sq. feet
|
- baths - beds |
show details | |

|
#9
Ocean Ave
Belmar, NJ 07719
|
- sq. feet
|
- baths - beds |
show details | |

|
#10
Shore Dr
Belmar, NJ 07719
|
1,096 sq. feet
|
- baths - beds |
show details |
| Photo | Address | Area | Beds / Baths | Price | Details |
|---|---|---|---|---|---|

|
#11
16th Ave
Belmar, NJ 07719
|
- sq. feet
|
- baths - beds |
show details | |

|
#12
Brighton Ave
Belmar, NJ 07719
|
- sq. feet
|
- baths - beds |
show details | |

|
#13
Tennis Ct
Belmar, NJ 07719
|
1,516 sq. feet
|
- baths - beds |
show details | |

|
#14
D St
Belmar, NJ 07719
|
456 sq. feet
|
- baths - beds |
show details | |

|
#15
Oxford Ln
Belmar, NJ 07719
|
- sq. feet
|
- baths - beds |
show details | |

|
#16
Deuce Dr
Belmar, NJ 07719
|
1,558 sq. feet
|
- baths - beds |
show details | |

|
#17
Tiltons Corner Rd
Belmar, NJ 07719
|
- sq. feet
|
- baths - beds |
show details | |

|
#18
Cottage Pl
Belmar, NJ 07719
|
- sq. feet
|
- baths - beds |
show details | |

|
#19
6th Ave
Belmar, NJ 07719
|
1,765 sq. feet
|
- baths - beds |
show details | |

|
#20
Monmouth Blvd
Belmar, NJ 07719
|
1,786 sq. feet
|
- baths - beds |
show details |
| Photo | Address | Area | Beds / Baths | Price | Details |
|---|---|---|---|---|---|

|
#21
Brighton Ave
Belmar, NJ 07719
|
- sq. feet
|
- baths - beds |
show details | |

|
#22
Maple St
Belmar, NJ 07719
|
2,314 sq. feet
|
- baths - beds |
show details | |

|
#23
Allenwood Rd
Belmar, NJ 07719
|
- sq. feet
|
- baths - beds |
show details | |

|
#24
Glendola Rd
Belmar, NJ 07719
|
4,158 sq. feet
|
- baths - beds |
show details | |

|
#25
W Hurley Pond Rd
Belmar, NJ 07719
|
2,259 sq. feet
|
- baths - beds |
show details | |

|
#26
M St
Belmar, NJ 07719
|
2,200 sq. feet
|
- baths - beds |
show details | |

|
#27
New Bedford Rd Apt 316
Belmar, NJ 07719
|
- sq. feet
|
- baths - beds |
show details | |

|
#28
Adams St
Belmar, NJ 07719
|
2,288 sq. feet
|
- baths - beds |
show details | |

|
#29
Clinton Ave
Belmar, NJ 07719
|
1,008 sq. feet
|
- baths - beds |
show details | |

|
#30
Highway 35
Belmar, NJ 07719
|
- sq. feet
|
- baths - beds |
show details |
| Photo | Address | Area | Beds / Baths | Price | Details |
|---|---|---|---|---|---|

|
#31
14th Ave
Belmar, NJ 07719
|
- sq. feet
|
- baths - beds |
show details | |

|
#32
K St
Belmar, NJ 07719
|
- sq. feet
|
- baths - beds |
show details | |

|
#33
Deuce Dr
Belmar, NJ 07719
|
- sq. feet
|
- baths - beds |
show details | |

|
#34
Garrett Dr
Belmar, NJ 07719
|
- sq. feet
|
- baths - beds |
show details | |

|
#35
Squirrel Rd
Belmar, NJ 07719
|
- sq. feet
|
- baths - beds |
show details | |

|
#36
Pomerton Rd
Belmar, NJ 07719
|
- sq. feet
|
- baths - beds |
show details | |

|
#37
Garrett Dr
Belmar, NJ 07719
|
- sq. feet
|
- baths - beds |
show details | |

|
#38
16th Ave
Belmar, NJ 07719
|
- sq. feet
|
- baths - beds |
show details | |

|
#39
Hurley Pond Rd
Belmar, NJ 07719
|
- sq. feet
|
- baths - beds |
show details | |

|
#40
Concord Dr
Belmar, NJ 07719
|
- sq. feet
|
- baths - beds |
show details |
| Photo | Address | Area | Beds / Baths | Price | Details |
|---|---|---|---|---|---|

|
#41
19th Ave
Belmar, NJ 07719
|
- sq. feet
|
- baths - beds |
show details | |

|
#42
Hurley Pond Rd
Belmar, NJ 07719
|
- sq. feet
|
- baths - beds |
show details | |

|
#43
5th Ave
Belmar, NJ 07719
|
- sq. feet
|
- baths - beds |
show details | |

|
Check over 1 million property listings on Foreclosure.com!
|
browse all offers | |||

Latest news about housing in Belmar, NJ collected exclusively by city-data.com from local newspapers, TV, and radio stations


Median year apartment built: 1964
Household type by relationship:
Households: 5,886- Male householders: 1,717 (750 living alone), Female householders: 985 (445 living alone)
876 spouses (876 opposite-sex spouses), 162 unmarried partners, (162 opposite-sex unmarried partners), 1,415 children (1,385 natural, 10 adopted, 20 stepchildren), 95 grandchildren, 88 brothers or sisters, 61 parents, 0 foster children, 133 other relatives, 341 non-relatives
- In group quarters: 10
Size of family households: 569 2-persons, 301 3-persons, 359 4-persons, 37 5-persons, 22 6-persons, 9 7-or-more-persons.
Size of nonfamily households: 1,192 1-person, 179 2-persons, 39 3-persons, 30 4-persons.
520 married couples with children.
150 single-parent households (13 men, 137 women).
82.7% of residents of Belmar speak English at home.
10.9% of residents speak Spanish at home (38% speak English very well, 18% speak English well, 41% speak English not well, 3% don't speak English at all).
5.6% of residents speak other Indo-European language at home (78% speak English very well, 18% speak English well, 5% speak English not well).
0.3% of residents speak Asian or Pacific Island language at home (100% speak English very well).
0.2% of residents speak other language at home (100% speak English very well).
Foreign born population: 557 (9.5%)
(45.6% of them are naturalized citizens)
| Here: | 6.8 |
| State: | 6.8 |
| Here: | 3.7 |
| State: | 3.9 |

- Bedrooms in owner-occupied houses and condos in Belmar, New Jersey
- 40no bedroom
- 1561 bedroom
- 2382 bedrooms
- 4503 bedrooms
- 2964 bedrooms
- 2245+ bedrooms

- Bedrooms in renter-occupied apartments in Belmar, New Jersey
- 48no bedroom
- 6291 bedroom
- 3052 bedrooms
- 2993 bedrooms
- 634 bedrooms
- 125+ bedrooms

- Cars and other vehicles available in Belmar in owner-occupied houses/condos
- 42no vehicle
- 4741 vehicle
- 4862 vehicles
- 2593 vehicles
- 1094 vehicles
- 355+ vehicles

- Cars and other vehicles available in Belmar in renter-occupied apartments
- 290no vehicle
- 6161 vehicle
- 3292 vehicles
- 893 vehicles
- 324 vehicles
- 05+ vehicles

- Rooms in owner-occupied houses in Belmar, New Jersey
- 401 room
- 482 rooms
- 903 rooms
- 1634 rooms
- 1055 rooms
- 2126 rooms
- 1727 rooms
- 3058 rooms
- 2709+ rooms

- Rooms in renter-occupied apartments in Belmar, New Jersey
- 481 room
- 852 rooms
- 4703 rooms
- 3164 rooms
- 1465 rooms
- 1976 rooms
- 147 rooms
- 638 rooms
- 159+ rooms


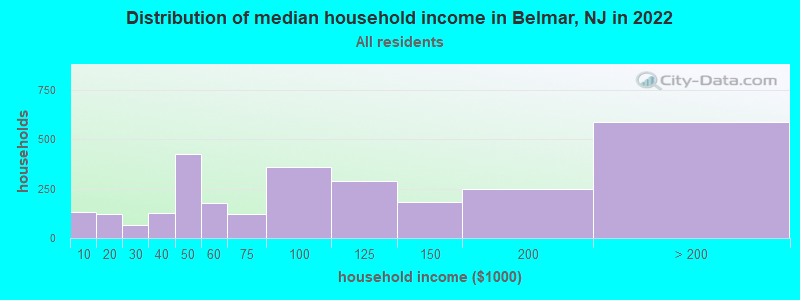
Belmar, NJ household income distribution

- 132Less than $10,000
- 123$10,000 to $19,999
- 65$20,000 to $29,999
- 129$30,000 to $39,999
- 423$40,000 to $49,999
- 175$50,000 to $59,999
- 123$60,000 to $74,999
- 357$75,000 to $99,999
- 288$100,000 to $124,999
- 182$125,000 to $149,999
- 246$150,000 to $199,999
- 587$200,000 or more
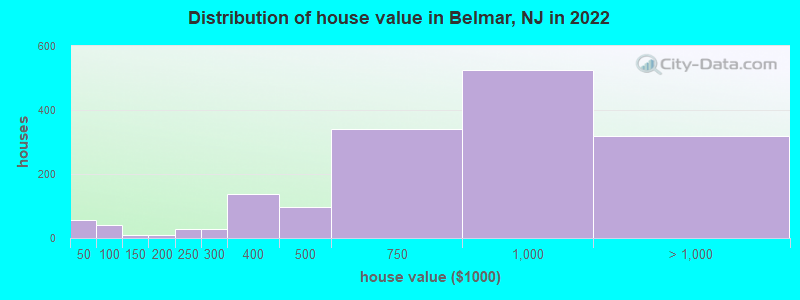
Home value of owner - occupied houses in 2022 in Belmar, NJ
-
- 22Less than $10,000
- 9$10,000 to $14,999
- 8$35,000 to $39,999
- 14$40,000 to $49,999
- 26$60,000 to $69,999
- 7$100,000 to $124,999
- 5$150,000 to $174,999
- 2$175,000 to $199,999
- 28$200,000 to $249,999
- 28$250,000 to $299,999
- 137$300,000 to $399,999
- 95$400,000 to $499,999
- 342$500,000 to $749,999
- 524$750,000 to $999,999
- 120$1,000,000 to $1,499,999
- 121$1,500,000 to $1,999,999
- 77$2,000,000 or more
Rent paid by renters in 2022 in Belmar, NJ
-
- 14$450 to $499
- 47$700 to $749
- 9$750 to $799
- 59$800 to $899
- 281$1,000 to $1,249
- 163$1,250 to $1,499
- 264$1,500 to $1,999
- 324$2,000 to $2,499
- 18$2,500 to $2,999
- 10$3,000 to $3,499
- 46$3,500 or more
- 102No cash rent


Percentage of workers working in this county: 76.3%
Number of people working at home: 427 (12.9% of all workers)

Travel time to work (commute)
- Less than 5 minutes: 98
- 5 to 9 minutes: 484
- 10 to 14 minutes: 384
- 15 to 19 minutes: 252
- 20 to 24 minutes: 193
- 25 to 29 minutes: 108
- 30 to 34 minutes: 628
- 35 to 39 minutes: 110
- 40 to 44 minutes: 53
- 45 to 59 minutes: 148
- 60 to 89 minutes: 222
- 90 or more minutes: 181

Means of transportation to work:
- Drove a car alone: 2,493 (69.0%)
- Carpooled: 166 (4.6%)
- Bus: 3 (0.1%)
- Long-distance train or commuter rail: 182 (5.0%)
- Taxi: 159 (4.4%)
- Bicycle: 30 (0.8%)
- Walked: 137 (3.8%)
- Worked at home: 427 (11.8%)

- Unemployment by race in 2022
- Unemployment rate for White non-Hispanic residents
- 4.1%Males
- 3.6%Females
- Unemployment rate for Black residents
- 15.6%Females
- Unemployment rate for Hispanic or Latino residents
- 7.2%Males
- 8.1%Females

- Year of entry for the foreign-born population in Belmar, New Jersey
- 1362010 or later
- 1102000 to 2009
- 1221990 to 1999
- 461980 to 1989
- 451970 to 1979
- 141Before 1970

First ancestries reported:
- Italian: 455 (22.6%)
- Irish: 419 (20.8%)
- Polish: 81 (4.0%)
- German: 63 (3.1%)
- Greek: 54 (2.7%)
- European: 49 (2.4%)
- Scottish: 37 (1.8%)
- Portuguese: 31 (1.5%)
- French: 27 (1.3%)
- Slavic: 26 (1.3%)
- American: 25 (1.2%)
- English: 24 (1.2%)
- Hungarian: 20 (1.0%)
- Russian: 17 (0.8%)
- Eastern European: 13 (0.6%)
- Ghanaian: 13 (0.6%)
- Welsh: 11 (0.5%)
- Lithuanian: 10 (0.5%)
- French Canadian: 7 (0.3%)
- Norwegian: 7 (0.3%)
- West Indian: 7 (0.3%)
- Bulgarian: 3 (0.1%)
Most common places of birth for foreign-born residents (%):
| Belmar: | 34.4% (191) |
| New Jersey: | 0.7% (14,848) |
| Belmar: | 32.2% (179) |
| New Jersey: | 4.8% (102,527) |
| Belmar: | 7.7% (43) |
| New Jersey: | 0.5% (10,607) |
| Belmar: | 5.4% (30) |
| New Jersey: | 2.1% (45,435) |
| Belmar: | 4.5% (25) |
| New Jersey: | 1.3% (28,871) |
| Belmar: | 2.3% (13) |
| New Jersey: | 2.1% (46,020) |
| Belmar: | 2.0% (11) |
| New Jersey: | 0.7% (15,533) |
| Belmar: | 1.8% (10) |
| New Jersey: | 0.4% (8,146) |
| Belmar: | 1.8% (10) |
| New Jersey: | 0.8% (17,217) |
| Belmar: | 1.8% (10) |
| New Jersey: | 3.7% (78,969) |
| Belmar: | 1.8% (10) |
| New Jersey: | 0.8% (17,949) |
| Belmar: | 1.6% (9) |
| New Jersey: | 0.7% (15,548) |
Place of birth for U.S.-born residents:
- This state: 3,990
- Other state: 1,247
- Northeast: 971
- Midwest: 65
- South: 189
- West: 18
89.4% of Belmar residents lived in the same house 1 years ago.
Out of people who lived in different houses, 35.3% lived in this county.
Out of people who lived in different counties, 57.0% lived in New Jersey.
| Belmar: | 89.4% |
| State average: | 90.4% |
Education attainment for males 25 years and older:
- No schooling: 16
- Nursery to 4th grade: 0
- 5th and 6th grade: 49
- 7th and 8th grade: 24
- 9th grade: 22
- 10th grade: 48
- 11th grade: 14
- 12th grade, no diploma: 2
- High school graduate (or equivalency): 404
- Less than 1 year of college: 220
- Some college more than 1 year, no degree: 280
- Associate degree: 255
- Bachelor's degree: 982
- Master's degree: 153
- Professional school degree: 138
- Doctorate degree: 45

Education attainment for females 25 years and older:
- No schooling: 0
- Nursery to 4th grade: 0
- 5th and 6th grade: 9
- 7th and 8th grade: 0
- 9th grade: 15
- 10th grade: 32
- 11th grade: 13
- 12th grade, no diploma: 57
- High school graduate (or equivalency): 372
- Less than 1 year of college: 64
- Some college more than 1 year, no degree: 215
- Associate degree: 88
- Bachelor's degree: 796
- Master's degree: 327
- Professional school degree: 16
- Doctorate degree: 6


Housing units in structures:
- One, detached: 2,138
- One, attached: 271
- Two: 328
- 3 or 4: 313
- 5 to 9: 111
- 10 to 19: 215
- 20 to 49: 266
- 50 or more: 199
- Mobile homes: 7
Housing units lacking complete kitchen facilities in 2022: 1.3%
House/condo owner moved in on average 14 years ago
Renter moved in on average 5 years ago

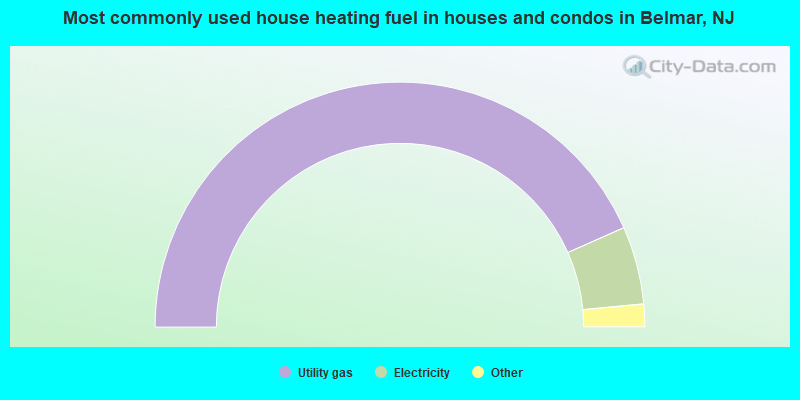
- 86.8%Utility gas
- 10.3%Electricity
- 1.7%Fuel oil, kerosene, etc.
- 1.2%Bottled, tank, or LP gas
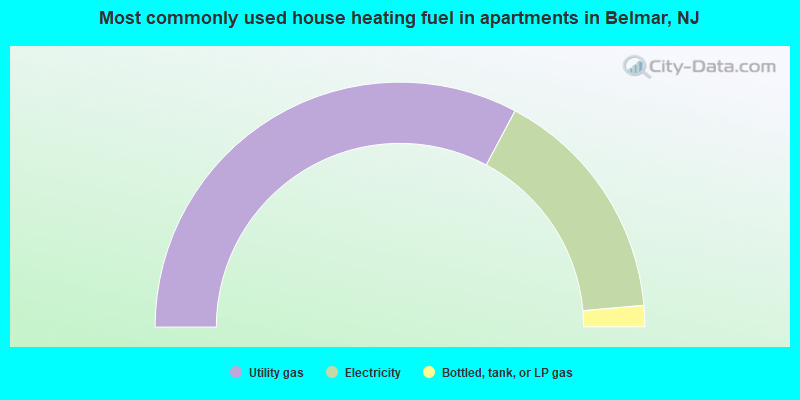
- 65.6%Utility gas
- 31.6%Electricity
- 2.8%Bottled, tank, or LP gas
Private vs. public school enrollment:
| Here: | 2.1% |
| New Jersey: | 12.3% |
| Here: | 19.3% |
| New Jersey: | 13.1% |
| Here: | 59.1% |
| New Jersey: | 33.2% |


