Bellmont, IL (Illinois) Houses and Residents
| Bellmont: | $46,616 |
| Illinois: | $251,600 |
Mean price in 2022:
Detached houses: $71,723
Here: $71,723 State: $310,164 Mobile homes: $33,041
Here: $33,041 State: $78,855
Total population: 269 (Urban population: 0, Rural population: 303 (2 farm, 301 nonfarm))
Houses: 120 (98 occupied: 75 owner occupied, 24 renter occupied)
| % of renters here: | 24% |
| State: | 33% |
Housing density: 329 houses/condos per square mile
Median price asked for vacant for-sale houses and condos in 2022 in this county: $69,370.
Median contract rent in 2022: $474 (lower quartile is $429, upper quartile is $815)
Median gross rent in Bellmont, IL in 2022: $818
Housing units in Bellmont with a mortgage: 23 (1 second mortgage, 0 home equity loan, 1 both second mortgage and home equity loan)
Houses without a mortgage: 0
Median household income for houses/condos with a mortgage: $72,757
Median household income for apartments without a mortgage: $39,497
Median monthly housing costs: $488
Compare current foreclosures near Bellmont, IL:
| Photo | Address | Area | Beds / Baths | Price | Details |
|---|---|---|---|---|---|

|
#1
N Main St
Grayville, IL 62844
|
- sq. feet
|
- baths - beds |
$17,900
|
show details |

|
#2
N Main St
Owensville, IN 47665
|
1,120 sq. feet
|
1 baths 2 beds |
show details | |

|
#3
N State St
Allendale, IL 62410
|
- sq. feet
|
- baths - beds |
$5,500
|
show details |

|
#4
W 450 S
Owensville, IN 47665
|
1,861 sq. feet
|
1 baths - beds |
show details | |

|
#5
N Old Us Highway 41
Patoka, IN 47666
|
- sq. feet
|
- baths - beds |
show details | |

|
#6
E Brummitt St
Owensville, IN 47665
|
- sq. feet
|
- baths - beds |
show details | |

|
#7
S Old State Road 65, # 25
Princeton, IN 47670
|
- sq. feet
|
- baths - beds |
show details | |

|
#8
N Main St
Owensville, IN 47665
|
- sq. feet
|
- baths - beds |
show details | |

|
#9
S Koch Dr
Poseyville, IN 47633
|
- sq. feet
|
- baths - beds |
show details | |

|
#10
N 1st St
Owensville, IN 47665
|
- sq. feet
|
- baths - beds |
show details |
| Photo | Address | Area | Beds / Baths | Price | Details |
|---|---|---|---|---|---|

|
#11
W 550 S
Owensville, IN 47665
|
- sq. feet
|
- baths - beds |
show details | |

|
#12
E Montgomery St
Owensville, IN 47665
|
- sq. feet
|
- baths - beds |
show details | |

|
#13
S Highway 65
Owensville, IN 47665
|
- sq. feet
|
- baths - beds |
show details | |

|
#14
W 1050 S
Poseyville, IN 47633
|
- sq. feet
|
- baths - beds |
show details | |

|
#15
N 2350 Blvd
Saint Francisville, IL 62460
|
- sq. feet
|
- baths - beds |
show details | |

|
#16
Lukin Rd
Saint Francisville, IL 62460
|
- sq. feet
|
- baths - beds |
show details | |

|
#17
Lee Rd
New Harmony, IN 47631
|
- sq. feet
|
- baths - beds |
show details | |

|
#18
W Oak St
Poseyville, IN 47633
|
- sq. feet
|
- baths - beds |
show details | |

|
#19
W Stalheim Ave
Owensville, IN 47665
|
- sq. feet
|
- baths - beds |
show details | |

|
#20
N 2300 Ln
West Salem, IL 62476
|
- sq. feet
|
- baths - beds |
show details |
| Photo | Address | Area | Beds / Baths | Price | Details |
|---|---|---|---|---|---|

|
#21
Mulberry St
Grayville, IL 62844
|
- sq. feet
|
- baths - beds |
show details | |

|
#22
N 1st St
Grayville, IL 62844
|
- sq. feet
|
- baths - beds |
show details | |

|
#23
S State Road 165
Owensville, IN 47665
|
- sq. feet
|
- baths - beds |
show details | |

|
#24
E South St
West Salem, IL 62476
|
- sq. feet
|
- baths - beds |
show details | |

|
#25
W 4th St
Mount Carmel, IL 62863
|
- sq. feet
|
- baths - beds |
show details | |

|
#26
N 900 Blvd
Mount Carmel, IL 62863
|
- sq. feet
|
- baths - beds |
show details | |

|
#27
N Mesa Lake Dr
Mount Carmel, IL 62863
|
- sq. feet
|
- baths - beds |
show details | |

|
#28
Hurley Ln
Mount Carmel, IL 62863
|
- sq. feet
|
- baths - beds |
show details | |

|
#29
S 1225 W
Owensville, IN 47665
|
- sq. feet
|
- baths - beds |
show details | |

|
#30
E Wayne Ln
Parkersburg, IL 62452
|
- sq. feet
|
- baths - beds |
show details |
| Photo | Address | Area | Beds / Baths | Price | Details |
|---|---|---|---|---|---|

|
#31
E Pine St
Albion, IL 62806
|
- sq. feet
|
- baths - beds |
show details | |

|
#32
E 8th St
Mount Carmel, IL 62863
|
- sq. feet
|
- baths - beds |
show details | |

|
#33
W North St
Bone Gap, IL 62815
|
- sq. feet
|
- baths - beds |
show details | |

|
#34
Cedar Hills St
Albion, IL 62806
|
- sq. feet
|
- baths - beds |
show details | |

|
#35
E Plum St
Grayville, IL 62844
|
- sq. feet
|
- baths - beds |
show details | |

|
#36
New St
West Salem, IL 62476
|
- sq. feet
|
- baths - beds |
show details | |

|
#37
S Prairie St
West Salem, IL 62476
|
- sq. feet
|
- baths - beds |
show details | |

|
#38
Seminary St
West Salem, IL 62476
|
- sq. feet
|
- baths - beds |
show details | |

|
#39
S 950 W
Owensville, IN 47665
|
- sq. feet
|
- baths - beds |
show details | |

|
#40
County Road 850 E
Browns, IL 62818
|
- sq. feet
|
- baths - beds |
show details |
| Photo | Address | Area | Beds / Baths | Price | Details |
|---|---|---|---|---|---|

|
Check over 1 million property listings on Foreclosure.com!
|
browse all offers | |||
| Photo | Address | Area | Beds / Baths | Price | Details |
|---|


 | Earthquake in S. IL (24 replies) |

Median year apartment built: 1958
Household type by relationship:
Households: 221- Male householders: 25 (2 living alone), Female householders: 71 (29 living alone)
44 spouses (44 opposite-sex spouses), 1 unmarried partners, (1 opposite-sex unmarried partners), 63 children (56 natural, 0 adopted, 6 stepchildren), 5 grandchildren, 0 brothers or sisters, 0 parents, 6 foster children, 0 other relatives, 2 non-relatives
Size of family households: 25 2-persons, 24 3-persons, 9 4-persons, 3 5-persons, 1 7-or-more-persons.
Size of nonfamily households: 34 1-person, 2 2-persons.
23 married couples with children.
27 single-parent households (2 men, 25 women).
94.9% of residents of Bellmont speak English at home.
5.5% of residents speak Spanish at home (100% speak English not well).
| Here: | 6.1 |
| State: | 6.4 |
| Here: | 5.2 |
| State: | 4.1 |

- Bedrooms in owner-occupied houses and condos in Bellmont, Illinois
- 0no bedroom
- 01 bedroom
- 182 bedrooms
- 443 bedrooms
- 104 bedrooms
- 35+ bedrooms

- Bedrooms in renter-occupied apartments in Bellmont, Illinois
- 0no bedroom
- 01 bedroom
- 32 bedrooms
- 213 bedrooms
- 04 bedrooms
- 05+ bedrooms

- Cars and other vehicles available in Bellmont in owner-occupied houses/condos
- 0no vehicle
- 321 vehicle
- 272 vehicles
- 123 vehicles
- 34 vehicles
- 15+ vehicles

- Cars and other vehicles available in Bellmont in renter-occupied apartments
- 4no vehicle
- 161 vehicle
- 42 vehicles
- 03 vehicles
- 04 vehicles
- 05+ vehicles

- Rooms in owner-occupied houses in Bellmont, Illinois
- 01 room
- 02 rooms
- 03 rooms
- 04 rooms
- 335 rooms
- 96 rooms
- 177 rooms
- 78 rooms
- 99+ rooms

- Rooms in renter-occupied apartments in Bellmont, Illinois
- 01 room
- 02 rooms
- 33 rooms
- 04 rooms
- 115 rooms
- 76 rooms
- 37 rooms
- 08 rooms
- 09+ rooms


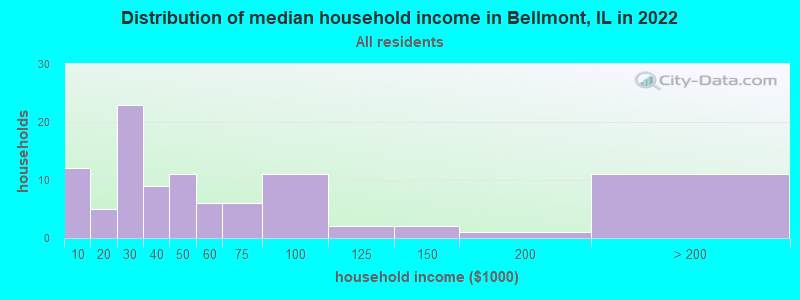
Bellmont, IL household income distribution

- 12Less than $10,000
- 5$10,000 to $19,999
- 23$20,000 to $29,999
- 9$30,000 to $39,999
- 11$40,000 to $49,999
- 6$50,000 to $59,999
- 6$60,000 to $74,999
- 11$75,000 to $99,999
- 2$100,000 to $124,999
- 2$125,000 to $149,999
- 1$150,000 to $199,999
- 11$200,000 or more
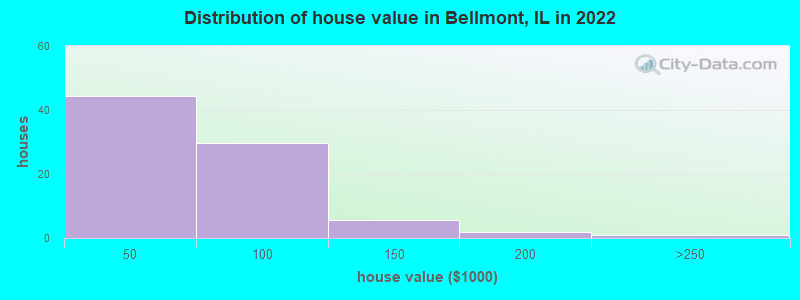
Home value of owner - occupied houses in 2022 in Bellmont, IL
-
- 4Less than $10,000
- 1$10,000 to $14,999
- 4$15,000 to $19,999
- 2$20,000 to $24,999
- 14$25,000 to $29,999
- 4$35,000 to $39,999
- 13$40,000 to $49,999
- 4$50,000 to $59,999
- 3$70,000 to $79,999
- 8$90,000 to $99,999
- 4$100,000 to $124,999
- 0$125,000 to $149,999
- 1$175,000 to $199,999
- 0$200,000 to $249,999
Rent paid by renters in 2022 in Bellmont, IL
-
- 3$300 to $349
- 3$400 to $449
- 5$450 to $499
- 1$600 to $649
- 6$800 to $899
- 4No cash rent


Percentage of workers working in this county: 47.7%
Number of people working at home: 6 (9.2% of all workers)
Travel time to work (commute)
- Less than 5 minutes: 2
- 5 to 9 minutes: 0
- 10 to 14 minutes: 7
- 15 to 19 minutes: 18
- 20 to 24 minutes: 0
- 25 to 29 minutes: 0
- 30 to 34 minutes: 2
- 35 to 39 minutes: 6
- 40 to 44 minutes: 0
- 45 to 59 minutes: 4
- 60 to 89 minutes: 6
- 90 or more minutes: 5
Means of transportation to work:
- Drove a car alone: 87 (64.4%)
- Carpooled: 39 (28.9%)
- Walked: 6 (4.4%)
- Worked at home: 3 (2.2%)

- Unemployment by race in 2022
- Unemployment rate for White non-Hispanic residents
- 15.6%Males

- Year of entry for the foreign-born population in Bellmont, Illinois
- 01995 to March 2000
- 01990 to 1994
- 31985 to 1989
- 01980 to 1984
- 01975 to 1979
- 01970 to 1974
- 01965 to 1969
- 0Before 1965

First ancestries reported:
- German: 51 (51.7%)
- American: 17 (17.2%)
- English: 14 (14.2%)
- Irish: 3 (3.0%)
- Italian: 3 (3.0%)
- Swedish: 3 (3.0%)
Most common places of birth for foreign-born residents (%):
| Bellmont: | 100.0% (3) |
| Illinois: | 2.1% (32,764) |
Place of birth for U.S.-born residents:
- This state: 111
- Other state: 110
- Northeast: 0
- Midwest: 98
- South: 10
- West: 2
80.2% of Bellmont residents lived in the same house 1 years ago.
Out of people who lived in different houses, 49.4% lived in this county.
| Bellmont: | 80.2% |
| State average: | 88.3% |
Education attainment for males 25 years and older:
- No schooling: 0
- Nursery to 4th grade: 0
- 5th and 6th grade: 0
- 7th and 8th grade: 0
- 9th grade: 0
- 10th grade: 0
- 11th grade: 0
- 12th grade, no diploma: 0
- High school graduate (or equivalency): 25
- Less than 1 year of college: 6
- Some college more than 1 year, no degree: 4
- Associate degree: 16
- Bachelor's degree: 1
- Master's degree: 0
- Professional school degree: 0
- Doctorate degree: 0

Education attainment for females 25 years and older:
- No schooling: 0
- Nursery to 4th grade: 0
- 5th and 6th grade: 0
- 7th and 8th grade: 0
- 9th grade: 0
- 10th grade: 0
- 11th grade: 2
- 12th grade, no diploma: 2
- High school graduate (or equivalency): 39
- Less than 1 year of college: 6
- Some college more than 1 year, no degree: 19
- Associate degree: 15
- Bachelor's degree: 1
- Master's degree: 1
- Professional school degree: 0
- Doctorate degree: 0


Housing units in structures:
- One, detached: 75
- Mobile homes: 45
Median worth of mobile homes: $33,108
Housing units lacking complete kitchen facilities in 2022: 13.3%
House/condo owner moved in on average 15 years ago
Renter moved in on average 6 years ago

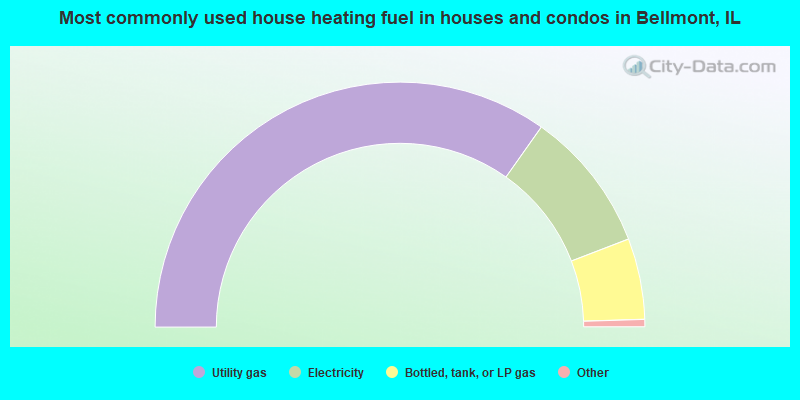
- 70.3%Utility gas
- 18.9%Electricity
- 10.8%Bottled, tank, or LP gas
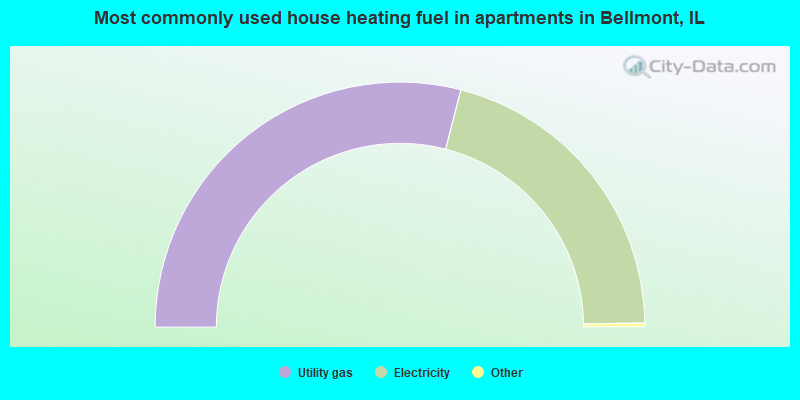
- 58.3%Utility gas
- 41.7%Electricity
Private vs. public school enrollment:
| Here: | 0.0% |
| Illinois: | 13.3% |
| Here: | 0.0% |
| Illinois: | 9.9% |
| Here: | 33.3% |
| Illinois: | 27.4% |


