Bellevue, NE (Nebraska) Houses and Residents
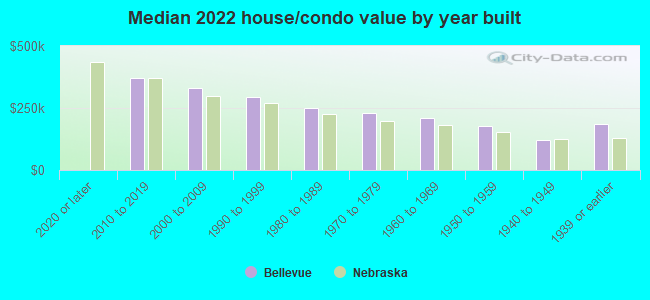
| Bellevue: | $237,716 |
| Nebraska: | $232,400 |
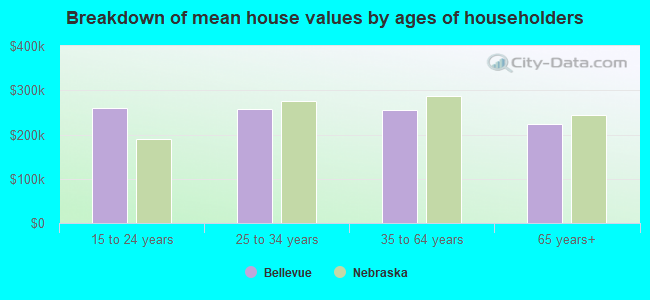
Mean price in 2022:
Detached houses: $239,126
Here: $239,126 State: $274,677 Townhouses or other attached units: $185,833
Here: $185,833 State: $245,619 In 2-unit structures: $220,190
Here: $220,190 State: $168,724 In 3-to-4-unit structures: $196,907
Here: $196,907 State: $405,971 In 5-or-more-unit structures: $380,437
Here: $380,437 State: $476,911 Mobile homes: $105,474
Here: $105,474 State: $67,339
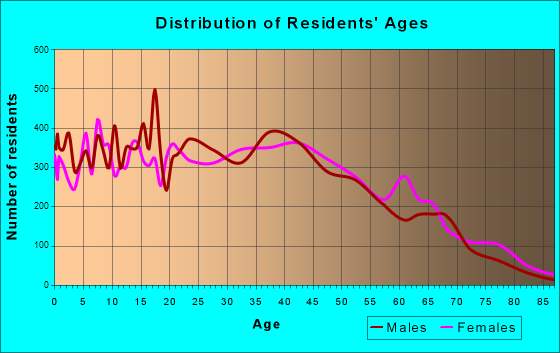
Total population: 53,936 (Urban population: 44,320, Rural population: 0)
Houses: 26,843 (25,628 occupied: 16,432 owner occupied, 9,493 renter occupied)
| % of renters here: | 37% |
| State: | 34% |
Housing density: 2,024 houses/condos per square mile
Median price asked for vacant for-sale houses and condos in 2022: $132,936.
Median contract rent in 2022: $993 (lower quartile is $808, upper quartile is $1,288)
Median rent asked for vacant for-rent units in 2022: $1,694
Median gross rent in Bellevue, NE in 2022: $1,170
Housing units in Bellevue with a mortgage: 11,184 (935 second mortgage, 0 home equity loan, 719 both second mortgage and home equity loan)
Houses without a mortgage: 264
Median household income for houses/condos with a mortgage: $114,377
Median household income for apartments without a mortgage: $74,099
Median monthly housing costs: $1,216
Compare current foreclosures in Bellevue, NE:
| Photo | Address | Area | Beds / Baths | Price | Details |
|---|---|---|---|---|---|

|
#1
Winnie Dr Apt 9
Bellevue, NE 68005
|
1,020 sq. feet
|
1 baths 2 beds |
show details | |

|
#2
Chad St
Bellevue, NE 68123
|
2,243 sq. feet
|
2 baths 4 beds |
show details | |

|
#3
S 27th St
Bellevue, NE 68147
|
2,189 sq. feet
|
2 baths 4 beds |
show details | |

|
#4
Sheridan Rd
Bellevue, NE 68123
|
2,063 sq. feet
|
2 baths 3 beds |
show details | |

|
#5
Daniell Cir
Bellevue, NE 68123
|
2,211 sq. feet
|
2 baths 3 beds |
show details | |

|
#6
Lois Ln
Bellevue, NE 68005
|
1,212 sq. feet
|
1 baths 3 beds |
show details | |

|
#7
S 41st St
Bellevue, NE 68147
|
1,008 sq. feet
|
1 baths 3 beds |
show details | |

|
#8
S 32nd Ave
Bellevue, NE 68147
|
1,586 sq. feet
|
1 baths 3 beds |
show details | |

|
#9
Bellevue Blvd N
Bellevue, NE 68005
|
864 sq. feet
|
1 baths 3 beds |
show details | |

|
#10
Heartland Dr
Bellevue, NE 68123
|
2,179 sq. feet
|
2 baths 2 beds |
show details |
| Photo | Address | Area | Beds / Baths | Price | Details |
|---|---|---|---|---|---|

|
#11
Jackson St
Bellevue, NE 68005
|
2,286 sq. feet
|
1 baths 3 beds |
show details | |

|
#12
Jackson St
Bellevue, NE 68005
|
1,350 sq. feet
|
1 baths 2 beds |
show details | |

|
#13
Olive St
Bellevue, NE 68147
|
936 sq. feet
|
1 baths 3 beds |
show details | |

|
#14
Pointer Cir
Bellevue, NE 68123
|
2,236 sq. feet
|
2 baths 3 beds |
show details | |

|
#15
S 33rd St
Bellevue, NE 68147
|
1,464 sq. feet
|
1 baths 3 beds |
show details | |

|
#16
Calhoun St
Bellevue, NE 68005
|
1,590 sq. feet
|
1 baths 3 beds |
show details | |

|
#17
Kay Lynn Dr
Bellevue, NE 68005
|
1,524 sq. feet
|
1 baths 3 beds |
show details | |

|
#18
S 25th Ave
Bellevue, NE 68147
|
2,462 sq. feet
|
2 baths 4 beds |
show details | |

|
#19
Yorktown St
Bellevue, NE 68123
|
1,497 sq. feet
|
2 baths 3 beds |
show details | |

|
#20
Irene St
Bellevue, NE 68147
|
1,376 sq. feet
|
1 baths 3 beds |
show details |
| Photo | Address | Area | Beds / Baths | Price | Details |
|---|---|---|---|---|---|

|
#21
Willow St
Bellevue, NE 68147
|
1,656 sq. feet
|
2 baths 3 beds |
show details | |

|
#22
Lochmoor Cir
Bellevue, NE 68123
|
4,143 sq. feet
|
3 baths 4 beds |
show details | |

|
#23
Briarwood Ln
Bellevue, NE 68147
|
1,620 sq. feet
|
2 baths 3 beds |
show details | |

|
#24
S 9th Ave
Bellevue, NE 68123
|
1,433 sq. feet
|
1 baths 3 beds |
show details | |

|
#25
Hansen Cir
Bellevue, NE 68005
|
2,042 sq. feet
|
2 baths 3 beds |
show details | |

|
#26
Kelly Dr
Bellevue, NE 68123
|
2,459 sq. feet
|
2 baths 3 beds |
show details | |

|
#27
S 38th Ave
Bellevue, NE 68147
|
1,968 sq. feet
|
2 baths 3 beds |
show details | |

|
#28
S 25th Ave
Bellevue, NE 68123
|
1,724 sq. feet
|
2 baths 2 beds |
show details | |

|
#29
Forestdale Dr
Bellevue, NE 68123
|
2,332 sq. feet
|
2 baths 4 beds |
show details | |

|
#30
S 42nd St
Bellevue, NE 68147
|
1,440 sq. feet
|
2 baths 3 beds |
show details |
| Photo | Address | Area | Beds / Baths | Price | Details |
|---|---|---|---|---|---|

|
#31
Hillcrest Dr
Bellevue, NE 68005
|
1,972 sq. feet
|
1 baths 3 beds |
show details | |

|
#32
Mclaughlin Cir
Bellevue, NE 68005
|
1,645 sq. feet
|
1 baths 2 beds |
show details | |

|
#33
Parkway Dr
Bellevue, NE 68005
|
1,584 sq. feet
|
1 baths 3 beds |
show details | |

|
#34
Hancock St
Bellevue, NE 68005
|
1,383 sq. feet
|
1 baths 3 beds |
show details | |

|
#35
Chandler Hills Dr
Bellevue, NE 68147
|
1,032 sq. feet
|
1 baths 2 beds |
show details | |

|
#36
Calhoun St
Bellevue, NE 68005
|
1,680 sq. feet
|
1 baths 3 beds |
show details | |

|
#37
Vicki Cir
Bellevue, NE 68005
|
1,612 sq. feet
|
2 baths 3 beds |
show details | |

|
#38
Sarpy Ave
Bellevue, NE 68147
|
1,438 sq. feet
|
1 baths 2 beds |
show details | |

|
#39
Greene Ave
Bellevue, NE 68147
|
1,623 sq. feet
|
2 baths 3 beds |
show details | |

|
#40
S 27th St
Bellevue, NE 68123
|
1,733 sq. feet
|
2 baths 4 beds |
show details |
| Photo | Address | Area | Beds / Baths | Price | Details |
|---|---|---|---|---|---|

|
#41
Columbus Ave
Bellevue, NE 68005
|
1,554 sq. feet
|
2 baths 3 beds |
show details | |

|
#42
S 29th Ave
Bellevue, NE 68123
|
2,233 sq. feet
|
2 baths 3 beds |
show details | |

|
#43
Englewood Dr
Bellevue, NE 68005
|
1,445 sq. feet
|
1 baths 3 beds |
show details | |

|
#44
Margo St
Bellevue, NE 68147
|
660 sq. feet
|
1 baths 2 beds |
show details | |

|
#45
Randall Dr
Bellevue, NE 68005
|
2,022 sq. feet
|
2 baths 3 beds |
show details | |

|
#46
Lynnwood Dr
Bellevue, NE 68123
|
2,355 sq. feet
|
2 baths 3 beds |
show details | |

|
#47
Hancock St
Bellevue, NE 68005
|
884 sq. feet
|
1 baths 2 beds |
show details | |

|
#48
Golden Blvd
Bellevue, NE 68123
|
1,648 sq. feet
|
2 baths 3 beds |
show details | |

|
#49
Jefferson St
Bellevue, NE 68005
|
1,240 sq. feet
|
1 baths 2 beds |
show details | |

|
Check over 1 million property listings on Foreclosure.com!
|
browse all offers | |||

Latest news about housing in Bellevue, NE collected exclusively by city-data.com from local newspapers, TV, and radio stations

 | changes in rentals Lincoln (18 replies) |
| Just moved back - good/bad apartments and areas? (7 replies) |
| Cheap, safe apartments in Bellevue/Omaha area. (9 replies) |
| Bellevue Area Apartments (5 replies) |
| Identify Old School Chandler & 28th Bellevue (2 replies) |
| good area to rent in (1 reply) |
Median year apartment built: 1985
Household type by relationship:
Households: 65,084- Male householders: 13,173 (3,271 living alone), Female householders: 11,942 (3,318 living alone)
12,121 spouses (12,088 opposite-sex spouses), 2,129 unmarried partners, (2,116 opposite-sex unmarried partners), 19,721 children (18,156 natural, 376 adopted, 1,188 stepchildren), 1,269 grandchildren, 730 brothers or sisters, 626 parents, 84 foster children, 743 other relatives, 2,243 non-relatives
- In group quarters: 296
Size of family households: 7,416 2-persons, 3,644 3-persons, 2,975 4-persons, 2,305 5-persons, 472 6-persons, 604 7-or-more-persons.
Size of nonfamily households: 6,755 1-person, 1,222 2-persons, 299 3-persons, 68 4-persons, 140 5-persons.
10,051 married couples with children.
4,214 single-parent households (1,123 men, 3,091 women).
86.4% of residents of Bellevue speak English at home.
9.1% of residents speak Spanish at home (69% speak English very well, 14% speak English well, 11% speak English not well, 6% don't speak English at all).
1.2% of residents speak other Indo-European language at home (73% speak English very well, 20% speak English well, 6% speak English not well, 1% don't speak English at all).
2.1% of residents speak Asian or Pacific Island language at home (63% speak English very well, 32% speak English well, 5% speak English not well).
1.0% of residents speak other language at home (55% speak English very well, 32% speak English well, 13% speak English not well).
Foreign born population: 6,421 (9.9%)
(56.6% of them are naturalized citizens)
| Here: | 7.1 |
| State: | 7.1 |
| Here: | 4.4 |
| State: | 4.2 |
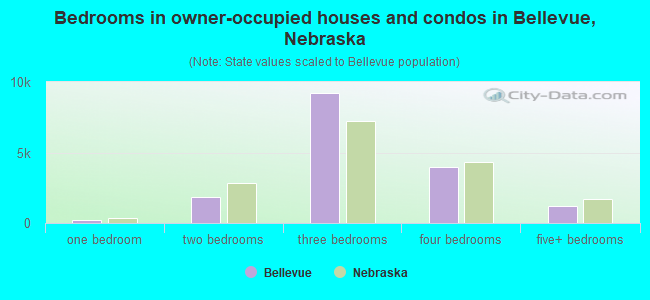
- Bedrooms in owner-occupied houses and condos in Bellevue, Nebraska
- 0no bedroom
- 2271 bedroom
- 1,8252 bedrooms
- 9,2033 bedrooms
- 3,9844 bedrooms
- 1,1935+ bedrooms
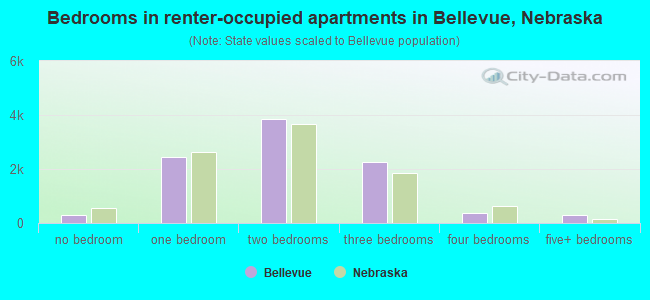
- Bedrooms in renter-occupied apartments in Bellevue, Nebraska
- 311no bedroom
- 2,4271 bedroom
- 3,8372 bedrooms
- 2,2493 bedrooms
- 3744 bedrooms
- 2965+ bedrooms
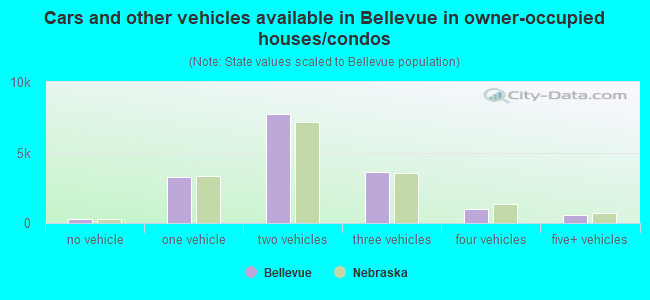
- Cars and other vehicles available in Bellevue in owner-occupied houses/condos
- 258no vehicle
- 3,2651 vehicle
- 7,7052 vehicles
- 3,6163 vehicles
- 1,0164 vehicles
- 5735+ vehicles
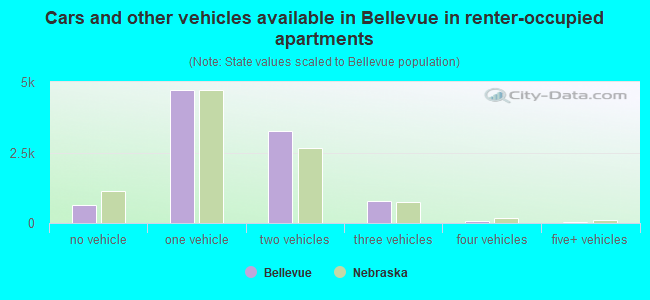
- Cars and other vehicles available in Bellevue in renter-occupied apartments
- 647no vehicle
- 4,7031 vehicle
- 3,2712 vehicles
- 7633 vehicles
- 864 vehicles
- 235+ vehicles
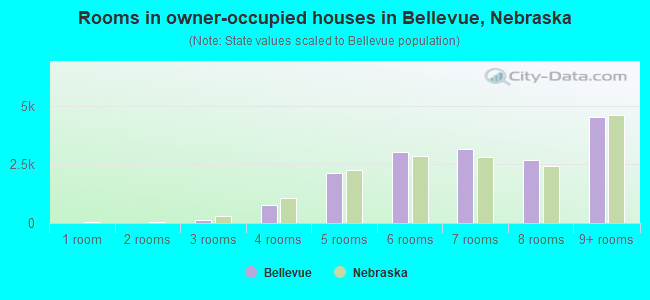
- Rooms in owner-occupied houses in Bellevue, Nebraska
- 01 room
- 142 rooms
- 1113 rooms
- 7854 rooms
- 2,1325 rooms
- 3,0086 rooms
- 3,1697 rooms
- 2,6828 rooms
- 4,5309+ rooms
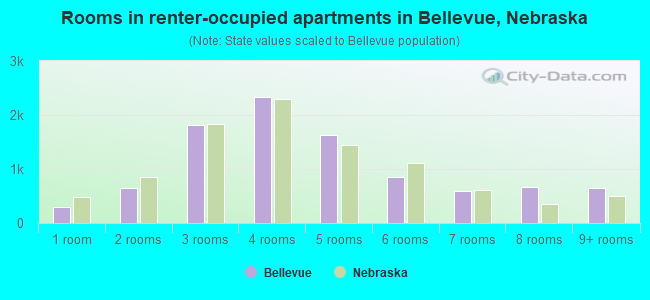
- Rooms in renter-occupied apartments in Bellevue, Nebraska
- 2951 room
- 6572 rooms
- 1,8113 rooms
- 2,3294 rooms
- 1,6295 rooms
- 8546 rooms
- 5967 rooms
- 6678 rooms
- 6569+ rooms
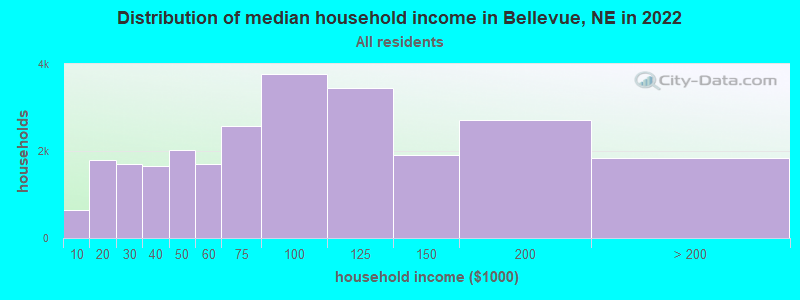
Bellevue, NE household income distribution

- 651Less than $10,000
- 1,786$10,000 to $19,999
- 1,708$20,000 to $29,999
- 1,666$30,000 to $39,999
- 2,025$40,000 to $49,999
- 1,707$50,000 to $59,999
- 2,585$60,000 to $74,999
- 3,763$75,000 to $99,999
- 3,457$100,000 to $124,999
- 1,902$125,000 to $149,999
- 2,703$150,000 to $199,999
- 1,839$200,000 or more
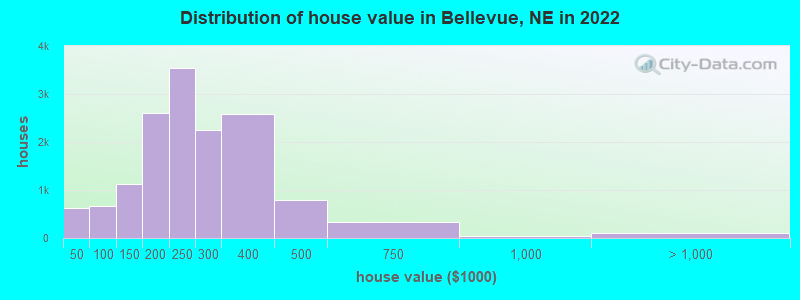
Home value of owner - occupied houses in 2022 in Bellevue, NE
-
- 72Less than $10,000
- 199$10,000 to $14,999
- 109$15,000 to $19,999
- 18$20,000 to $24,999
- 64$25,000 to $29,999
- 39$30,000 to $34,999
- 11$35,000 to $39,999
- 107$40,000 to $49,999
- 75$50,000 to $59,999
- 10$60,000 to $69,999
- 9$70,000 to $79,999
- 286$80,000 to $89,999
- 179$90,000 to $99,999
- 531$100,000 to $124,999
- 597$125,000 to $149,999
- 1,067$150,000 to $174,999
- 1,532$175,000 to $199,999
- 3,548$200,000 to $249,999
- 2,257$250,000 to $299,999
- 2,590$300,000 to $399,999
- 786$400,000 to $499,999
- 330$500,000 to $749,999
- 48$750,000 to $999,999
- 60$1,000,000 to $1,499,999
- 8$1,500,000 to $1,999,999
- 31$2,000,000 or more
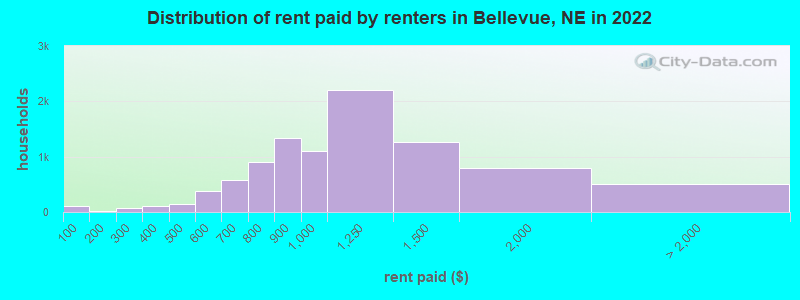
Rent paid by renters in 2022 in Bellevue, NE
-
- 111Less than $100
- 15$100 to $149
- 30$200 to $249
- 38$250 to $299
- 33$300 to $349
- 82$350 to $399
- 43$400 to $449
- 105$450 to $499
- 270$500 to $549
- 101$550 to $599
- 154$600 to $649
- 417$650 to $699
- 522$700 to $749
- 379$750 to $799
- 1,335$800 to $899
- 1,103$900 to $999
- 2,197$1,000 to $1,249
- 1,265$1,250 to $1,499
- 790$1,500 to $1,999
- 67$2,000 to $2,499
- 35$2,500 to $2,999
- 16$3,000 to $3,499
- 23$3,500 or more
- 372No cash rent
Percentage of workers working in this county: 53.1%
Number of people working at home: 3,791 (11.3% of all workers)
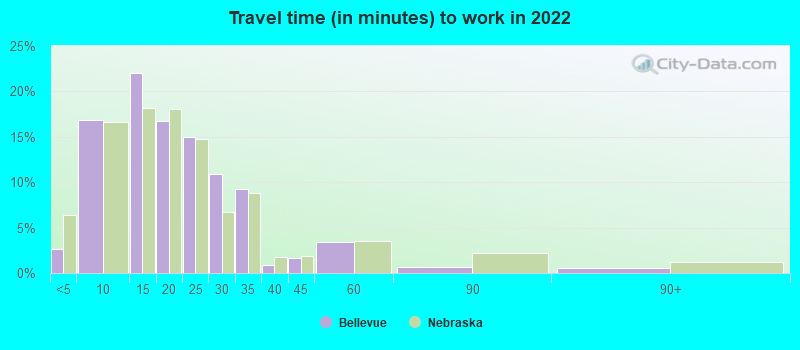
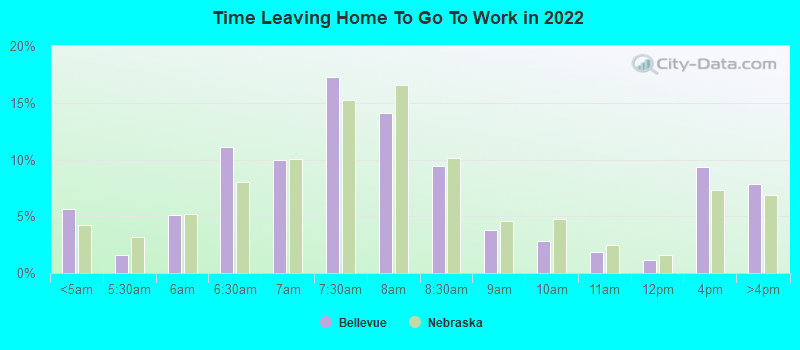
Travel time to work (commute)
- Less than 5 minutes: 655
- 5 to 9 minutes: 3,263
- 10 to 14 minutes: 5,608
- 15 to 19 minutes: 5,079
- 20 to 24 minutes: 6,188
- 25 to 29 minutes: 2,897
- 30 to 34 minutes: 2,562
- 35 to 39 minutes: 649
- 40 to 44 minutes: 753
- 45 to 59 minutes: 1,043
- 60 to 89 minutes: 393
- 90 or more minutes: 277
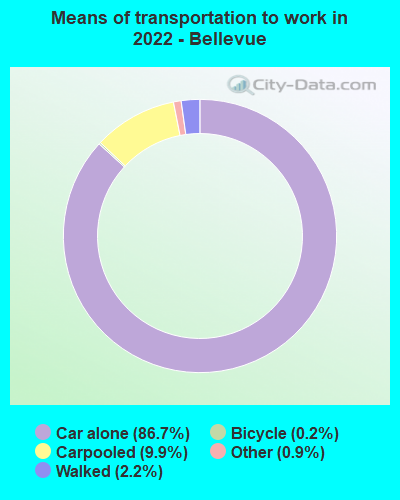
Means of transportation to work:
- Drove a car alone: 13,618 (73.1%)
- Carpooled: 1,629 (8.7%)
- Taxi: 149 (0.8%)
- Bicycle: 26 (0.1%)
- Walked: 331 (1.8%)
- Worked at home: 3,116 (16.7%)
- Unemployment by race in 2022
- Unemployment rate for White non-Hispanic residents
- 1.1%Males
- 1.5%Females
- Unemployment rate for Black residents
- 1.3%Males
- 4.0%Females
- Unemployment rate for American Indian and Alaska Native residents
- 5.4%Females
- Unemployment rate for other race residents
- 12.4%Males
- 3.7%Females
- Unemployment rate for two or more race residents
- 1.5%Males
- 0.7%Females
- Unemployment rate for Hispanic or Latino residents
- 2.0%Males
- 5.0%Females
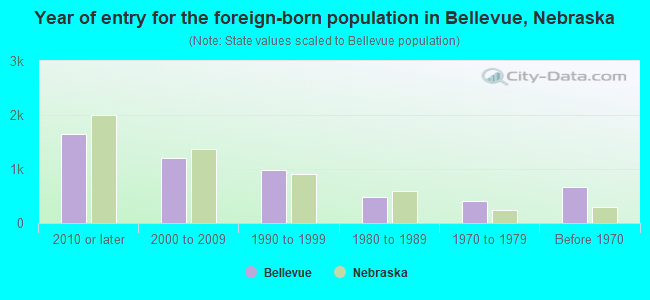
- Year of entry for the foreign-born population in Bellevue, Nebraska
- 1,6462010 or later
- 1,2122000 to 2009
- 9821990 to 1999
- 4821980 to 1989
- 4091970 to 1979
- 668Before 1970
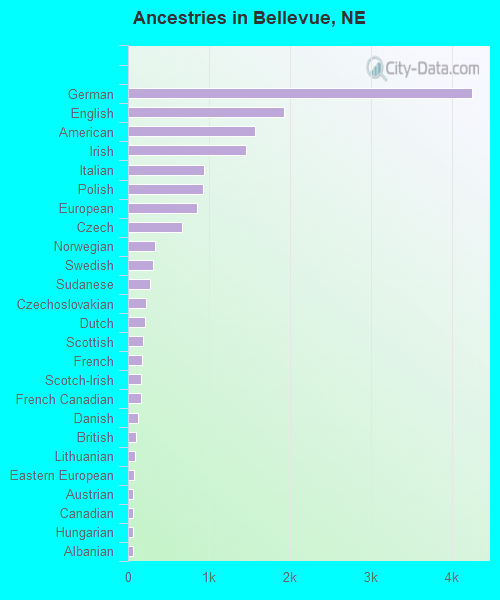
First ancestries reported:
- German: 4,249 (15.9%)
- English: 1,927 (7.2%)
- American: 1,574 (5.9%)
- Irish: 1,462 (5.5%)
- Italian: 939 (3.5%)
- Polish: 928 (3.5%)
- European: 851 (3.2%)
- Czech: 667 (2.5%)
- Norwegian: 328 (1.2%)
- Swedish: 306 (1.1%)
- Sudanese: 274 (1.0%)
- Czechoslovakian: 220 (0.8%)
- Dutch: 205 (0.8%)
- Scottish: 186 (0.7%)
- French: 172 (0.6%)
- Scotch-Irish: 163 (0.6%)
- French Canadian: 156 (0.6%)
- Danish: 120 (0.4%)
- British: 99 (0.4%)
- Lithuanian: 91 (0.3%)
- Eastern European: 71 (0.3%)
- Austrian: 66 (0.2%)
- Canadian: 60 (0.2%)
- Hungarian: 60 (0.2%)
- Albanian: 57 (0.2%)
- British West Indian: 53 (0.2%)
- Iranian: 48 (0.2%)
- Portuguese: 48 (0.2%)
- Croatian: 44 (0.2%)
- African: 39 (0.1%)
- Kenyan: 38 (0.1%)
- Scandinavian: 36 (0.1%)
- Swiss: 32 (0.1%)
- Welsh: 29 (0.1%)
- Northern European: 28 (0.1%)
- Belgian: 27 (0.1%)
- Russian: 27 (0.1%)
- Ghanaian: 25 (0.09%)
- Greek: 23 (0.09%)
- Slavic: 17 (0.06%)
- Ukrainian: 15 (0.06%)
- Pennsylvania German: 14 (0.05%)
- Finnish: 12 (0.04%)
- Romanian: 10 (0.04%)
- Slovak: 8 (0.03%)
- Bahamian: 8 (0.03%)
- West Indian: 8 (0.03%)
- Australian: 7 (0.03%)
- South African: 7 (0.03%)
- Celtic: 6 (0.02%)
- Assyrian: 5 (0.02%)
Most common places of birth for foreign-born residents (%):
| Bellevue: | 35.8% (2,074) |
| Nebraska: | 31.7% (46,610) |
| Bellevue: | 9.2% (531) |
| Nebraska: | 2.2% (3,185) |
| Bellevue: | 4.5% (261) |
| Nebraska: | 4.0% (5,832) |
| Bellevue: | 4.5% (259) |
| Nebraska: | 1.6% (2,312) |
| Bellevue: | 4.1% (235) |
| Nebraska: | 1.1% (1,685) |
| Bellevue: | 3.7% (213) |
| Nebraska: | 0.8% (1,158) |
| Bellevue: | 3.4% (198) |
| Nebraska: | 3.7% (5,421) |
| Bellevue: | 3.1% (182) |
| Nebraska: | 1.4% (2,029) |
| Bellevue: | 2.9% (170) |
| Nebraska: | 0.8% (1,178) |
| Bellevue: | 2.4% (136) |
| Nebraska: | 0.5% (808) |
| Bellevue: | 1.7% (99) |
| Nebraska: | 7.2% (10,604) |
| Bellevue: | 1.6% (93) |
| Nebraska: | 0.4% (610) |
Place of birth for U.S.-born residents:
- This state: 33,184
- Other state: 23,480
- Northeast: 1,959
- Midwest: 9,984
- South: 5,260
- West: 6,242
88.4% of Bellevue residents lived in the same house 1 years ago.
Out of people who lived in different houses, 38.5% lived in this county.
Out of people who lived in different counties, 59.6% lived in Nebraska.
| Bellevue: | 88.4% |
| State average: | 87.4% |
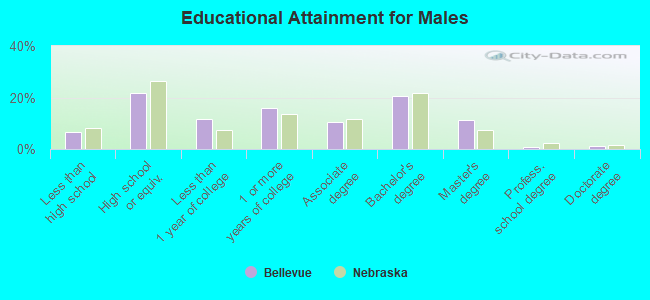
Education attainment for males 25 years and older:
- No schooling: 572
- Nursery to 4th grade: 10
- 5th and 6th grade: 154
- 7th and 8th grade: 118
- 9th grade: 99
- 10th grade: 65
- 11th grade: 119
- 12th grade, no diploma: 339
- High school graduate (or equivalency): 4,736
- Less than 1 year of college: 2,505
- Some college more than 1 year, no degree: 3,475
- Associate degree: 2,258
- Bachelor's degree: 4,486
- Master's degree: 2,442
- Professional school degree: 190
- Doctorate degree: 280
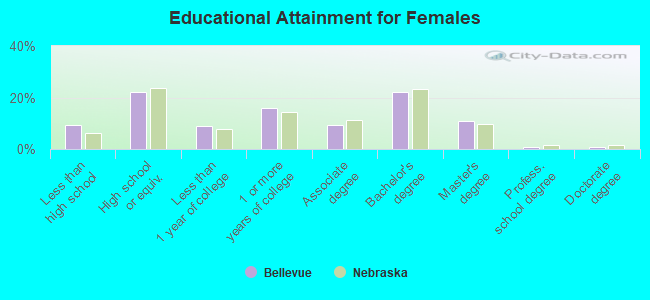
Education attainment for females 25 years and older:
- No schooling: 411
- Nursery to 4th grade: 56
- 5th and 6th grade: 63
- 7th and 8th grade: 38
- 9th grade: 237
- 10th grade: 206
- 11th grade: 296
- 12th grade, no diploma: 702
- High school graduate (or equivalency): 4,666
- Less than 1 year of college: 1,869
- Some college more than 1 year, no degree: 3,413
- Associate degree: 1,935
- Bachelor's degree: 4,655
- Master's degree: 2,307
- Professional school degree: 157
- Doctorate degree: 173
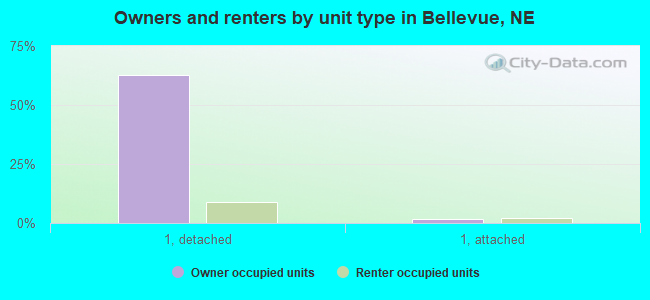
Housing units in structures:
- One, detached: 18,370
- One, attached: 1,011
- Two: 89
- 3 or 4: 423
- 5 to 9: 2,219
- 10 to 19: 1,936
- 20 to 49: 1,308
- 50 or more: 944
- Mobile homes: 525
- Boats, RVs, vans, etc.: 13
Housing units lacking complete kitchen facilities in 2022: 1.2%
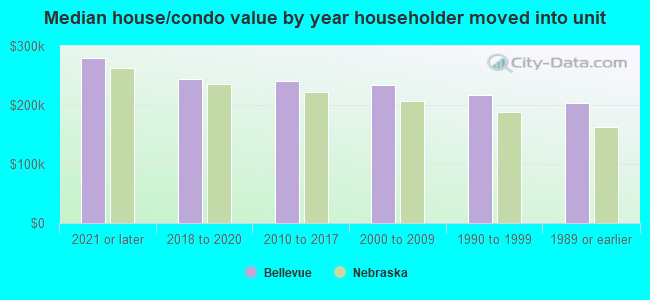
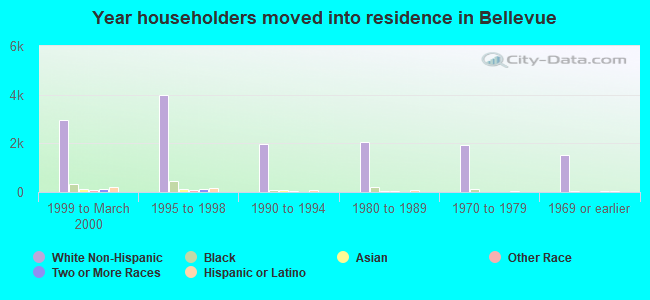
House/condo owner moved in on average 13 years ago
Renter moved in on average 3 years ago
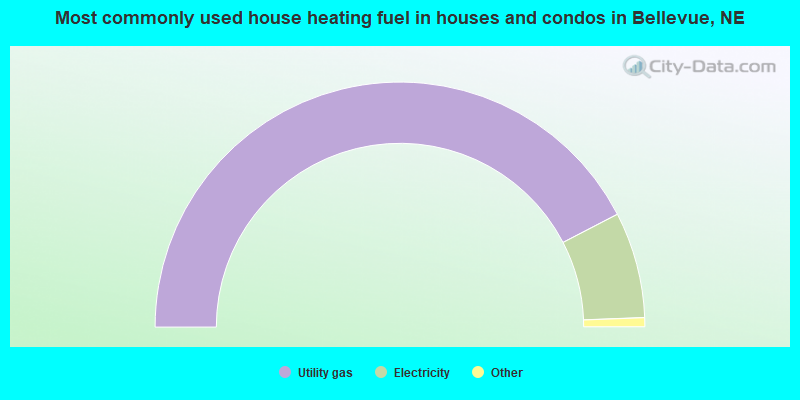
- 84.7%Utility gas
- 14.0%Electricity
- 0.7%Bottled, tank, or LP gas
- 0.4%Wood
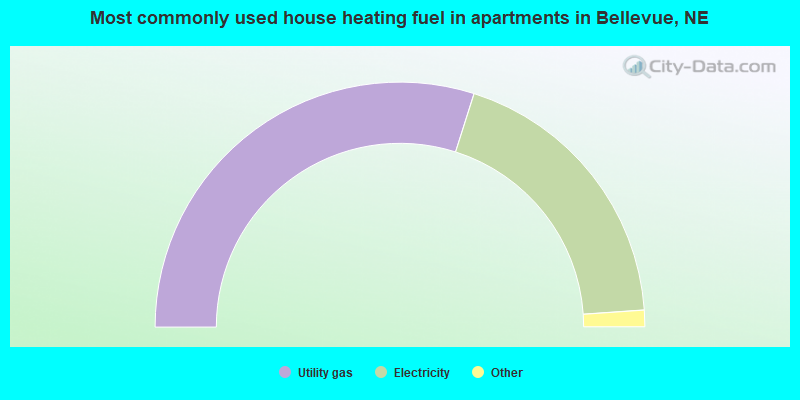
- 59.8%Utility gas
- 38.0%Electricity
- 1.5%Bottled, tank, or LP gas
- 0.6%No fuel used
- 0.1%Other fuel
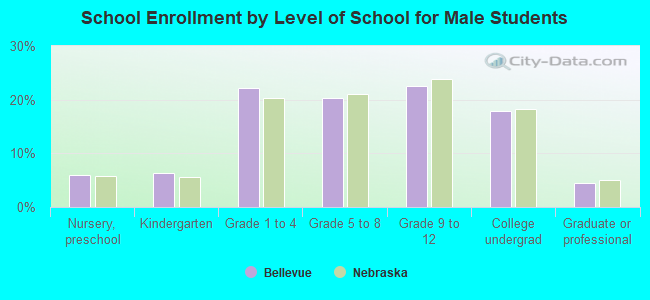
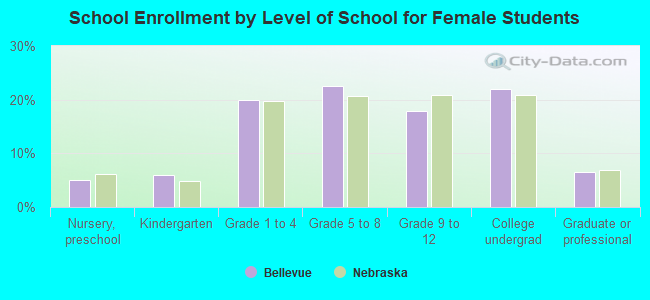
Private vs. public school enrollment:
| Here: | 17.4% |
| Nebraska: | 14.1% |
| Here: | 9.6% |
| Nebraska: | 12.5% |
| Here: | 20.9% |
| Nebraska: | 18.0% |