Belleville, PA (Pennsylvania) Houses and Residents
| Belleville: | $161,496 |
| Pennsylvania: | $245,500 |
Total population: 1,827 (Urban population: 0, Rural population: 1,410 (all nonfarm))
Houses: 768 (746 occupied: 460 owner occupied, 292 renter occupied)
| % of renters here: | 39% |
| State: | 31% |
Housing density: 370 houses/condos per square mile
Median price asked for vacant for-sale houses and condos in 2022 in this county: $276,782.
Median contract rent in 2022: $572 (lower quartile is $469, upper quartile is $636)
Median rent asked for vacant for-rent units in 2022: $802
Median gross rent in Belleville, PA in 2022: $704
Housing units in Belleville with a mortgage: 255 (38 second mortgage, 0 home equity loan, 35 both second mortgage and home equity loan)
Houses without a mortgage: 55
Median household income for houses/condos with a mortgage: $80,504
Median household income for apartments without a mortgage: $65,383
Median monthly housing costs: $724
Compare current foreclosures near Belleville, PA:
| Photo | Address | Area | Beds / Baths | Price | Details |
|---|---|---|---|---|---|

|
#1
E Main St
Belleville, PA 17004
|
- sq. feet
|
- baths - beds |
show details | |

|
#2
Upper Stone Mountain Rd
Belleville, PA 17004
|
1,528 sq. feet
|
- baths - beds |
show details | |

|
#3
Moore St
Huntingdon, PA 16652
|
1,232 sq. feet
|
- baths 3 beds |
$8,900
|
show details |

|
#4
W 6th St
Lewistown, PA 17044
|
1,044 sq. feet
|
1 baths 3 beds |
show details | |

|
#5
Warm Springs Ave
Huntingdon, PA 16652
|
1,916 sq. feet
|
1 baths 3 beds |
show details | |

|
#6
West Dr
Boalsburg, PA 16827
|
1,416 sq. feet
|
1 baths 3 beds |
show details | |

|
#7
Buchenhorst Rd
State College, PA 16801
|
1,492 sq. feet
|
1 baths 3 beds |
show details | |

|
#8
Anthony Dr
Pennsylvania Furnace, PA 16865
|
1,816 sq. feet
|
2 baths 3 beds |
show details | |

|
#9
Bayberry Dr
State College, PA 16801
|
1,723 sq. feet
|
2 baths 4 beds |
show details | |

|
#10
W Whitehall Rd
Pennsylvania Furnace, PA 16865
|
950 sq. feet
|
2 baths 3 beds |
show details |
| Photo | Address | Area | Beds / Baths | Price | Details |
|---|---|---|---|---|---|

|
#11
W Whitehall Rd
Pennsylvania Furnace, PA 16865
|
950 sq. feet
|
2 baths 3 beds |
show details | |

|
#12
Chaumont Ave
State College, PA 16801
|
2,795 sq. feet
|
2 baths 4 beds |
show details | |

|
#13
Cedar Ln
State College, PA 16801
|
2,456 sq. feet
|
2 baths 3 beds |
show details | |

|
#14
N Allen St
State College, PA 16803
|
1,406 sq. feet
|
1 baths 2 beds |
show details | |

|
#15
N Allen St
State College, PA 16803
|
1,484 sq. feet
|
1 baths 2 beds |
show details | |

|
#16
Devonshire Dr
State College, PA 16803
|
3,108 sq. feet
|
3 baths 5 beds |
show details | |

|
#17
Cottontail Ln
Centre Hall, PA 16828
|
960 sq. feet
|
1 baths 3 beds |
show details | |

|
#18
Brittany Dr
State College, PA 16803
|
2,122 sq. feet
|
3 baths 6 beds |
show details | |

|
#19
Brittany Dr
State College, PA 16803
|
2,122 sq. feet
|
3 baths 6 beds |
show details | |

|
#20
Miller Ln
Granville, PA 17029
|
1,128 sq. feet
|
1 baths 1 beds |
show details |
| Photo | Address | Area | Beds / Baths | Price | Details |
|---|---|---|---|---|---|

|
#21
Oneida St
Huntingdon, PA 16652
|
1,040 sq. feet
|
- baths 4 beds |
show details | |

|
#22
Cold Springs Rd
Huntingdon, PA 16652
|
- sq. feet
|
- baths - beds |
show details | |

|
#23
Wisteria Ln
Mc Veytown, PA 17051
|
1,904 sq. feet
|
- baths - beds |
show details | |

|
#24
Cold Springs Rd
Huntingdon, PA 16652
|
- sq. feet
|
- baths - beds |
show details | |

|
#25
Mountain Rd
Mill Creek, PA 17060
|
- sq. feet
|
- baths - beds |
show details | |

|
#26
Old Gatesburg Rd
State College, PA 16803
|
- sq. feet
|
- baths - beds |
show details | |

|
#27
Snook Rd
Mc Clure, PA 17841
|
- sq. feet
|
- baths - beds |
show details | |

|
#28
S Buckhout St
State College, PA 16801
|
- sq. feet
|
- baths - beds |
show details | |

|
#29
Ferne Ridge Ln
Spring Mills, PA 16875
|
- sq. feet
|
- baths - beds |
show details | |

|
#30
Stratford Ct
State College, PA 16801
|
- sq. feet
|
- baths - beds |
show details |
| Photo | Address | Area | Beds / Baths | Price | Details |
|---|---|---|---|---|---|

|
#31
Caldwell Hill Rd
Lewistown, PA 17044
|
1,484 sq. feet
|
- baths - beds |
show details | |

|
#32
Jacks Mill Dr # 8
Boalsburg, PA 16827
|
- sq. feet
|
- baths - beds |
show details | |

|
#33
E Walnut St
Lewistown, PA 17044
|
1,440 sq. feet
|
- baths - beds |
show details | |

|
#34
S Wayne St
Lewistown, PA 17044
|
1,556 sq. feet
|
- baths - beds |
show details | |

|
#35
E Logan Street Ext
Reedsville, PA 17084
|
1,008 sq. feet
|
- baths - beds |
show details | |

|
#36
S Spruce St
Lewistown, PA 17044
|
- sq. feet
|
- baths - beds |
show details | |

|
#37
Pannebaker Ave
Lewistown, PA 17044
|
1,152 sq. feet
|
- baths - beds |
show details | |

|
#38
E Walnut St
Lewistown, PA 17044
|
1,485 sq. feet
|
- baths - beds |
show details | |

|
#39
E Walnut St
Lewistown, PA 17044
|
1,344 sq. feet
|
- baths - beds |
show details | |

|
#40
W Freedom Ave, Trlr B29
Burnham, PA 17009
|
- sq. feet
|
- baths - beds |
show details |
| Photo | Address | Area | Beds / Baths | Price | Details |
|---|---|---|---|---|---|

|
#41
Spanogle Ave
Lewistown, PA 17044
|
1,456 sq. feet
|
- baths - beds |
show details | |

|
#42
Us Highway 522 S
Lewistown, PA 17044
|
- sq. feet
|
- baths - beds |
show details | |

|
#43
Fairview Pl
Lewistown, PA 17044
|
1,456 sq. feet
|
- baths - beds |
show details | |

|
#44
Briar Patch Ln Apt A
Lewistown, PA 17044
|
- sq. feet
|
- baths - beds |
show details | |

|
#45
E Walnut St
Lewistown, PA 17044
|
1,192 sq. feet
|
- baths - beds |
show details | |

|
#46
Glenbrook Ln
Lewistown, PA 17044
|
- sq. feet
|
- baths - beds |
show details | |

|
#47
E Back Mountain Rd
Milroy, PA 17063
|
- sq. feet
|
- baths - beds |
show details | |

|
#48
Vira Rd
Lewistown, PA 17044
|
768 sq. feet
|
- baths - beds |
show details | |

|
#49
Maclay St
Milroy, PA 17063
|
1,448 sq. feet
|
- baths - beds |
show details | |

|
Check over 1 million property listings on Foreclosure.com!
|
browse all offers | |||

Latest news about housing in Belleville, PA collected exclusively by city-data.com from local newspapers, TV, and radio stations

 | Why have Italian Americans remained in Philadelphia and not entirely disperse to the suburbs? (15 replies) |
| PA turnpike wildly behind on payments (23 replies) |
| Owners Who live in A POCONO COUNTRY PLACE (430 replies) |
| mountains (7 replies) |
| Relocating From Hackettstown ... Any suggestions (17 replies) |
| Any info on Mifflin Co. Belleville, Mechanicsville, Lewistown? (6 replies) |

Median year apartment built: 1978
Household type by relationship:
Households: 1,817- Male householders: 291 (66 living alone), Female householders: 446 (135 living alone)
421 spouses (421 opposite-sex spouses), 47 unmarried partners, (47 opposite-sex unmarried partners), 366 children (357 natural, 8 adopted, 0 stepchildren), 27 grandchildren, 25 brothers or sisters, 0 parents, 0 foster children, 37 other relatives, 5 non-relatives
- In group quarters: 145
Size of family households: 276 2-persons, 123 3-persons, 63 4-persons, 20 5-persons, 12 6-persons.
Size of nonfamily households: 209 1-person, 47 2-persons.
228 married couples with children.
30 single-parent households (0 men, 30 women).
94.9% of residents of Belleville speak English at home.
3.8% of residents speak Spanish at home (100% speak English not well).
2.8% of residents speak other Indo-European language at home (40% speak English very well, 60% speak English well).
| Here: | 7.5 |
| State: | 6.8 |
| Here: | 3.7 |
| State: | 4.3 |

- Bedrooms in owner-occupied houses and condos in Belleville, Pennsylvania
- 0no bedroom
- 01 bedroom
- 562 bedrooms
- 2403 bedrooms
- 1124 bedrooms
- 535+ bedrooms

- Bedrooms in renter-occupied apartments in Belleville, Pennsylvania
- 38no bedroom
- 681 bedroom
- 1392 bedrooms
- 483 bedrooms
- 04 bedrooms
- 05+ bedrooms

- Cars and other vehicles available in Belleville in owner-occupied houses/condos
- 16no vehicle
- 701 vehicle
- 2582 vehicles
- 923 vehicles
- 74 vehicles
- 175+ vehicles

- Cars and other vehicles available in Belleville in renter-occupied apartments
- 93no vehicle
- 691 vehicle
- 1112 vehicles
- 193 vehicles
- 04 vehicles
- 05+ vehicles

- Rooms in owner-occupied houses in Belleville, Pennsylvania
- 01 room
- 02 rooms
- 03 rooms
- 84 rooms
- 465 rooms
- 636 rooms
- 1127 rooms
- 1198 rooms
- 1129+ rooms

- Rooms in renter-occupied apartments in Belleville, Pennsylvania
- 381 room
- 02 rooms
- 973 rooms
- 514 rooms
- 625 rooms
- 396 rooms
- 07 rooms
- 68 rooms
- 09+ rooms


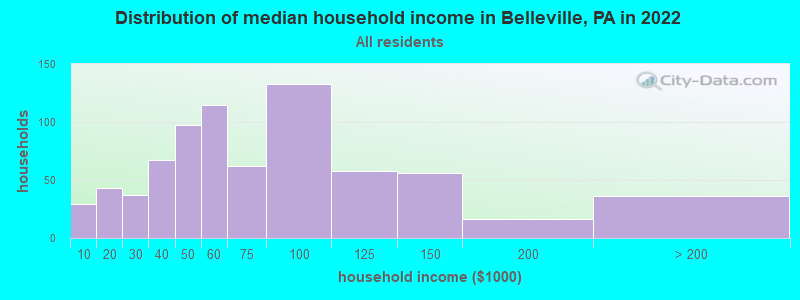
Belleville, PA household income distribution

- 29Less than $10,000
- 43$10,000 to $19,999
- 37$20,000 to $29,999
- 67$30,000 to $39,999
- 97$40,000 to $49,999
- 115$50,000 to $59,999
- 62$60,000 to $74,999
- 133$75,000 to $99,999
- 58$100,000 to $124,999
- 56$125,000 to $149,999
- 16$150,000 to $199,999
- 36$200,000 or more
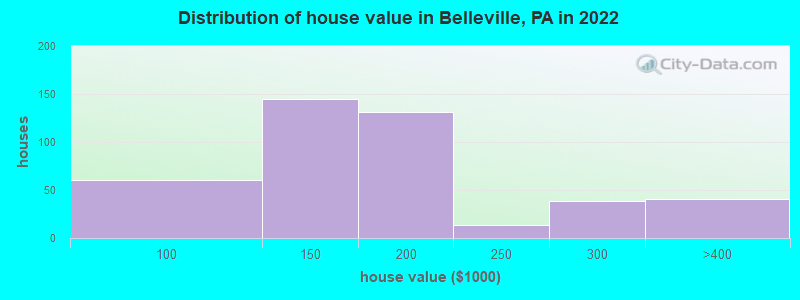
Home value of owner - occupied houses in 2022 in Belleville, PA
-
- 4$50,000 to $59,999
- 26$70,000 to $79,999
- 29$80,000 to $89,999
- 113$100,000 to $124,999
- 31$125,000 to $149,999
- 77$150,000 to $174,999
- 53$175,000 to $199,999
- 14$200,000 to $249,999
- 38$250,000 to $299,999
- 41$300,000 to $399,999
Rent paid by renters in 2022 in Belleville, PA
-
- 9$200 to $249
- 47$400 to $449
- 42$450 to $499
- 7$500 to $549
- 63$550 to $599
- 35$600 to $649
- 8$700 to $749
- 5$750 to $799
- 12$800 to $899
- 25$3,500 or more
- 23No cash rent


Percentage of workers working in this county: 90.0%
Number of people working at home: 71 (10.2% of all workers)
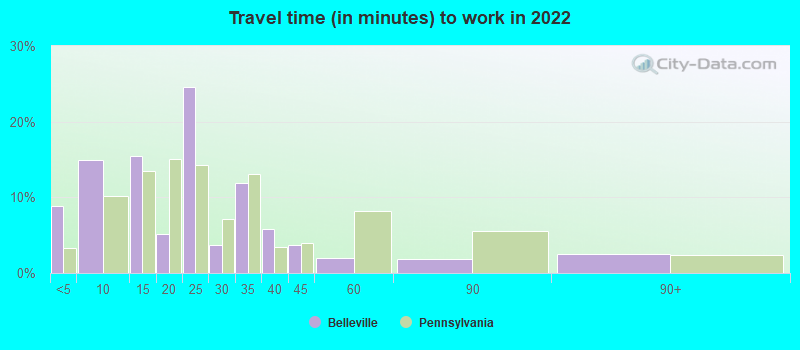
Travel time to work (commute)
- Less than 5 minutes: 116
- 5 to 9 minutes: 110
- 10 to 14 minutes: 29
- 15 to 19 minutes: 89
- 20 to 24 minutes: 188
- 25 to 29 minutes: 0
- 30 to 34 minutes: 0
- 35 to 39 minutes: 24
- 40 to 44 minutes: 35
- 45 to 59 minutes: 0
- 60 to 89 minutes: 16
- 90 or more minutes: 14
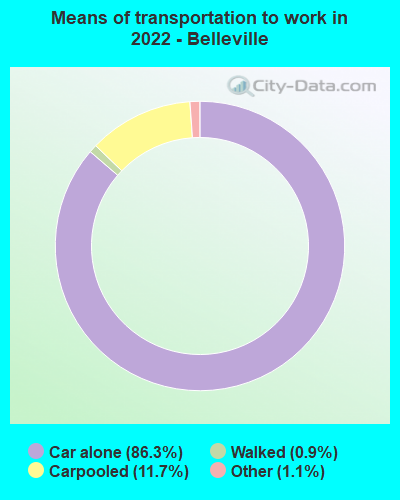
Means of transportation to work:
- Drove a car alone: 1,193 (80.3%)
- Carpooled: 161 (10.8%)
- Taxi: 17 (1.1%)
- Walked: 12 (0.8%)
- Worked at home: 71 (4.8%)

- Unemployment by race in 2022
- Unemployment rate for White non-Hispanic residents
- 6.3%Males
- 6.3%Females

- Year of entry for the foreign-born population in Belleville, Pennsylvania
- 71995 to March 2000
- 101990 to 1994
- 471985 to 1989
- 41980 to 1984
- 01975 to 1979
- 01970 to 1974
- 41965 to 1969
- 7Before 1965

First ancestries reported:
- German: 298 (36.1%)
- American: 155 (18.8%)
- English: 79 (9.6%)
- Irish: 71 (8.6%)
- Scotch-Irish: 45 (5.4%)
- Italian: 24 (2.9%)
- Scottish: 17 (2.1%)
- European: 8 (1.0%)
- French: 8 (1.0%)
- Polish: 8 (1.0%)
- Swedish: 8 (1.0%)
- Austrian: 6 (0.7%)
- Dutch: 5 (0.6%)
- Norwegian: 5 (0.6%)
- Pennsylvania German: 5 (0.6%)
Most common places of birth for foreign-born residents (%):
| Belleville: | 81.0% (64) |
| Pennsylvania: | 2.7% (13,885) |
| Belleville: | 5.1% (4) |
| Pennsylvania: | 4.6% (23,171) |
| Belleville: | 5.1% (4) |
| Pennsylvania: | 5.3% (26,703) |
| Belleville: | 5.1% (4) |
| Pennsylvania: | 3.0% (15,200) |
| Belleville: | 3.8% (3) |
| Pennsylvania: | 1.7% (8,574) |
Place of birth for U.S.-born residents:
- This state: 1,424
- Other state: 388
- Northeast: 89
- Midwest: 127
- South: 135
- West: 36
93.4% of Belleville residents lived in the same house 1 years ago.
Out of people who lived in different houses, 34.9% lived in this county.
Out of people who lived in different counties, 63.2% lived in Pennsylvania.
| Belleville: | 93.4% |
| State average: | 89.3% |
Education attainment for males 25 years and older:
- No schooling: 0
- Nursery to 4th grade: 0
- 5th and 6th grade: 0
- 7th and 8th grade: 7
- 9th grade: 4
- 10th grade: 24
- 11th grade: 4
- 12th grade, no diploma: 0
- High school graduate (or equivalency): 246
- Less than 1 year of college: 40
- Some college more than 1 year, no degree: 101
- Associate degree: 21
- Bachelor's degree: 129
- Master's degree: 31
- Professional school degree: 6
- Doctorate degree: 0

Education attainment for females 25 years and older:
- No schooling: 0
- Nursery to 4th grade: 0
- 5th and 6th grade: 0
- 7th and 8th grade: 13
- 9th grade: 0
- 10th grade: 0
- 11th grade: 5
- 12th grade, no diploma: 5
- High school graduate (or equivalency): 370
- Less than 1 year of college: 34
- Some college more than 1 year, no degree: 100
- Associate degree: 112
- Bachelor's degree: 76
- Master's degree: 99
- Professional school degree: 0
- Doctorate degree: 0


Housing units in structures:
- One, detached: 503
- One, attached: 47
- Two: 6
- 3 or 4: 46
- 5 to 9: 7
- 20 to 49: 24
- 50 or more: 74
- Mobile homes: 58
House/condo owner moved in on average 17 years ago
Renter moved in on average 3 years ago

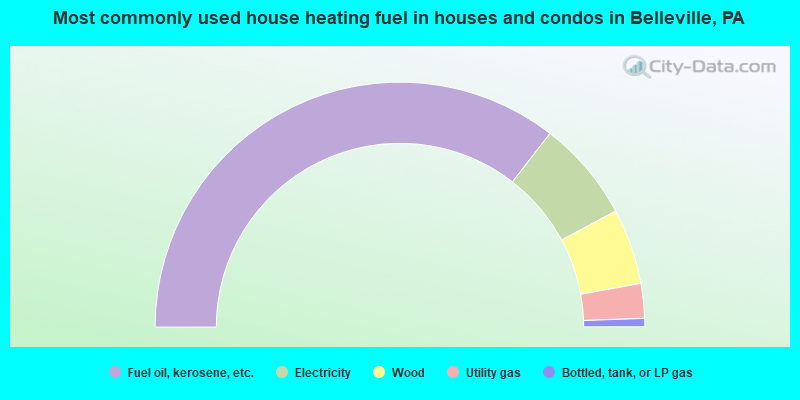
- 71.0%Fuel oil, kerosene, etc.
- 13.3%Electricity
- 10.0%Wood
- 4.6%Utility gas
- 1.1%Bottled, tank, or LP gas
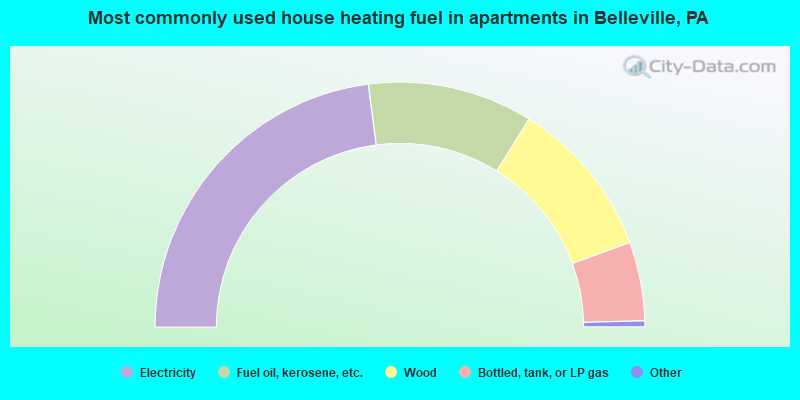
- 46.3%Electricity
- 22.0%Fuel oil, kerosene, etc.
- 21.3%Wood
- 10.5%Bottled, tank, or LP gas
Private vs. public school enrollment:
| Here: | 0.0% |
| Pennsylvania: | 15.7% |
| Here: | 37.2% |
| Pennsylvania: | 13.4% |
| Here: | 53.3% |
| Pennsylvania: | 39.8% |


