Bellaire, MI (Michigan) Houses and Residents
| Bellaire: | $173,405 |
| Michigan: | $224,400 |
Mean price in 2022:
Detached houses: $216,997
Here: $216,997 State: $280,038 Mobile homes: $81,322
Here: $81,322 State: $72,868
Total population: 1,071 (Urban population: 0, Rural population: 1,183 (all nonfarm))
Houses: 546 (455 occupied: 335 owner occupied, 126 renter occupied)
| % of renters here: | 27% |
| State: | 27% |
Housing density: 298 houses/condos per square mile
Median price asked for vacant for-sale houses and condos in 2022: $263,472.
Median contract rent in 2022: $631 (lower quartile is $467, upper quartile is $714)
Median rent asked for vacant for-rent units in 2022: $542
Median gross rent in Bellaire, MI in 2022: $747
Housing units in Bellaire with a mortgage: 204 (8 second mortgage, 3 home equity loan, 5 both second mortgage and home equity loan)
Houses without a mortgage: 26
Median household income for houses/condos with a mortgage: $68,574
Median household income for apartments without a mortgage: $51,965
Median monthly housing costs: $804
Compare current foreclosures near Bellaire, MI:
| Photo | Address | Area | Beds / Baths | Price | Details |
|---|---|---|---|---|---|

|
#1
S East Torch Lake Dr
Bellaire, MI 49615
|
- sq. feet
|
- baths - beds |
show details | |

|
#2
S M 66 Hwy
Mancelona, MI 49659
|
1,248 sq. feet
|
2 baths 3 beds |
$70,000
|
show details |

|
#3
Meadow Ln
Bellaire, MI 49615
|
- sq. feet
|
- baths - beds |
show details | |

|
#4
Laming Cir
Elmira, MI 49730
|
1,956 sq. feet
|
2 baths 3 beds |
show details | |

|
#5
Townview Dr
Mancelona, MI 49659
|
- sq. feet
|
- baths - beds |
show details | |

|
#6
Arbutus Drive, Apt Back
Kalkaska, MI 49646
|
- sq. feet
|
- baths - beds |
show details | |

|
#7
W Kalkaska Rd
Kalkaska, MI 49646
|
- sq. feet
|
- baths - beds |
show details | |

|
#8
Washington Rd
East Jordan, MI 49727
|
- sq. feet
|
- baths - beds |
show details | |

|
#9
Darragh Rd
Mancelona, MI 49659
|
- sq. feet
|
- baths - beds |
show details | |

|
#10
S Us Highway 131
Mancelona, MI 49659
|
- sq. feet
|
- baths - beds |
show details |
| Photo | Address | Area | Beds / Baths | Price | Details |
|---|---|---|---|---|---|

|
#11
Westwood Rd NE
Alden, MI 49612
|
- sq. feet
|
- baths - beds |
show details | |

|
#12
Odell Rd
Kewadin, MI 49648
|
- sq. feet
|
- baths - beds |
show details | |

|
#13
S Orange St
Kalkaska, MI 49646
|
- sq. feet
|
- baths - beds |
show details | |

|
#14
E Hinman
Mancelona, MI 49659
|
- sq. feet
|
- baths - beds |
show details | |

|
#15
W Plum Valley Rd NW
Rapid City, MI 49676
|
- sq. feet
|
- baths - beds |
show details | |

|
#16
Torch Bridge Ct NW
Rapid City, MI 49676
|
- sq. feet
|
- baths - beds |
show details | |

|
#17
Indian Rd
Kewadin, MI 49648
|
- sq. feet
|
- baths - beds |
show details | |

|
#18
S Ranney Rd
East Jordan, MI 49727
|
- sq. feet
|
- baths - beds |
show details | |

|
#19
Soderquist Rd
Mancelona, MI 49659
|
- sq. feet
|
- baths - beds |
show details | |

|
#20
Maple Ave
Mancelona, MI 49659
|
- sq. feet
|
- baths - beds |
show details |
| Photo | Address | Area | Beds / Baths | Price | Details |
|---|---|---|---|---|---|

|
#21
M 72 E
Williamsburg, MI 49690
|
- sq. feet
|
- baths - beds |
show details | |

|
#22
N Coral St
Kalkaska, MI 49646
|
- sq. feet
|
- baths - beds |
show details | |

|
#23
Green River Rd
Mancelona, MI 49659
|
- sq. feet
|
- baths - beds |
show details | |

|
#24
Alden Hwy
Mancelona, MI 49659
|
- sq. feet
|
- baths - beds |
show details | |

|
#25
N Skinkle Rd
East Jordan, MI 49727
|
- sq. feet
|
- baths - beds |
show details | |

|
Check over 1 million property listings on Foreclosure.com!
|
browse all offers | |||

Latest news about housing in Bellaire, MI collected exclusively by city-data.com from local newspapers, TV, and radio stations

 | Forbes just named GR #1 place to invest in house (50 replies) |
| Philly to Traverse City (10 replies) |
| What the heck is going on in Antrim County? (9 replies) |
| Pics of Spectacular Michigan (2204 replies) |
| Move to Marquette, Traverse City, or somewhere else??? (21 replies) |
| Any info on Elk Lake? (9 replies) |

Median year apartment built: 1966
Household type by relationship:
Households: 952- Male householders: 194 (87 living alone), Female householders: 257 (109 living alone)
160 spouses (156 opposite-sex spouses), 39 unmarried partners, (37 opposite-sex unmarried partners), 208 children (194 natural, 13 adopted, 0 stepchildren), 15 grandchildren, 22 brothers or sisters, 5 parents, 0 foster children, 3 other relatives, 8 non-relatives
- In group quarters: 33
Size of family households: 116 2-persons, 31 3-persons, 38 4-persons, 25 5-persons, 16 6-persons.
Size of nonfamily households: 205 1-person, 30 2-persons.
80 married couples with children.
53 single-parent households (8 men, 45 women).
97.7% of residents of Bellaire speak English at home.
2.7% of residents speak Spanish at home (48% speak English very well, 52% speak English well).
Foreign born population: 11 (1.2%)
(100.0% of them are naturalized citizens)
| Here: | 6.1 |
| State: | 6.5 |
| Here: | 2.8 |
| State: | 4.3 |

- Bedrooms in owner-occupied houses and condos in Bellaire, Michigan
- 0no bedroom
- 71 bedroom
- 572 bedrooms
- 2053 bedrooms
- 554 bedrooms
- 115+ bedrooms

- Bedrooms in renter-occupied apartments in Bellaire, Michigan
- 35no bedroom
- 431 bedroom
- 372 bedrooms
- 123 bedrooms
- 04 bedrooms
- 05+ bedrooms

- Cars and other vehicles available in Bellaire in owner-occupied houses/condos
- 17no vehicle
- 1011 vehicle
- 1632 vehicles
- 353 vehicles
- 44 vehicles
- 155+ vehicles

- Cars and other vehicles available in Bellaire in renter-occupied apartments
- 53no vehicle
- 631 vehicle
- 102 vehicles
- 03 vehicles
- 04 vehicles
- 05+ vehicles

- Rooms in owner-occupied houses in Bellaire, Michigan
- 01 room
- 02 rooms
- 63 rooms
- 324 rooms
- 605 rooms
- 1126 rooms
- 517 rooms
- 288 rooms
- 479+ rooms

- Rooms in renter-occupied apartments in Bellaire, Michigan
- 351 room
- 142 rooms
- 333 rooms
- 164 rooms
- 195 rooms
- 56 rooms
- 07 rooms
- 08 rooms
- 49+ rooms


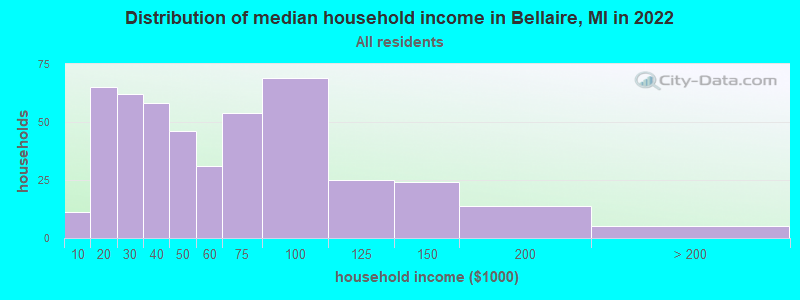
Bellaire, MI household income distribution

- 11Less than $10,000
- 65$10,000 to $19,999
- 62$20,000 to $29,999
- 58$30,000 to $39,999
- 46$40,000 to $49,999
- 31$50,000 to $59,999
- 54$60,000 to $74,999
- 69$75,000 to $99,999
- 25$100,000 to $124,999
- 24$125,000 to $149,999
- 14$150,000 to $199,999
- 5$200,000 or more
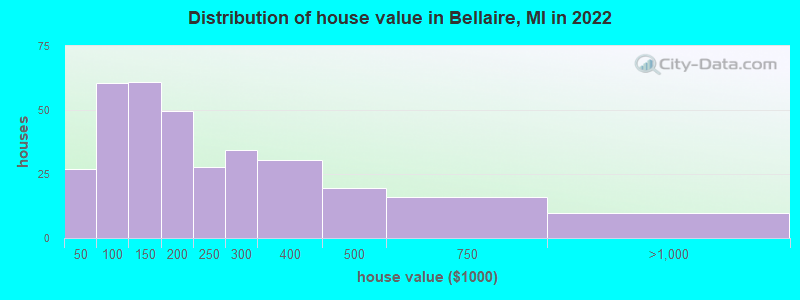
Home value of owner - occupied houses in 2022 in Bellaire, MI
-
- 13$25,000 to $29,999
- 13$40,000 to $49,999
- 10$60,000 to $69,999
- 1$70,000 to $79,999
- 9$80,000 to $89,999
- 25$90,000 to $99,999
- 43$100,000 to $124,999
- 17$125,000 to $149,999
- 30$150,000 to $174,999
- 18$175,000 to $199,999
- 27$200,000 to $249,999
- 34$250,000 to $299,999
- 30$300,000 to $399,999
- 19$400,000 to $499,999
- 16$500,000 to $749,999
- 9$750,000 to $999,999
Rent paid by renters in 2022 in Bellaire, MI
-
- 5$150 to $199
- 6$200 to $249
- 4$300 to $349
- 6$350 to $399
- 3$400 to $449
- 18$450 to $499
- 7$550 to $599
- 7$600 to $649
- 34$650 to $699
- 11$700 to $749
- 6$750 to $799
- 1$800 to $899
- 3$900 to $999
- 1No cash rent

Percentage of workers working in this county: 80.8%
Number of people working at home: 77 (17.6% of all workers)
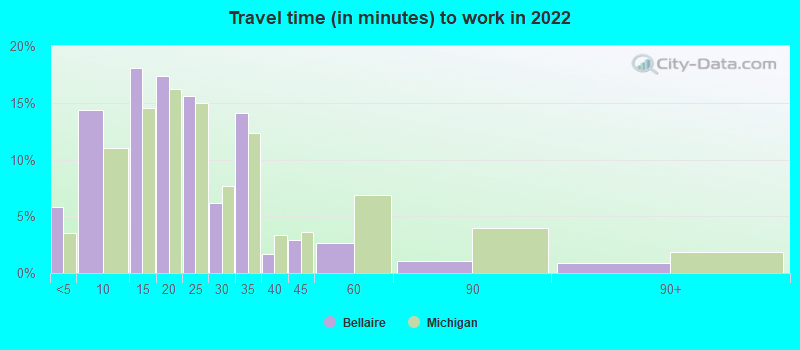
Travel time to work (commute)
- Less than 5 minutes: 61
- 5 to 9 minutes: 122
- 10 to 14 minutes: 46
- 15 to 19 minutes: 46
- 20 to 24 minutes: 11
- 25 to 29 minutes: 3
- 30 to 34 minutes: 21
- 35 to 39 minutes: 3
- 40 to 44 minutes: 5
- 45 to 59 minutes: 9
- 60 to 89 minutes: 32
- 90 or more minutes: 7
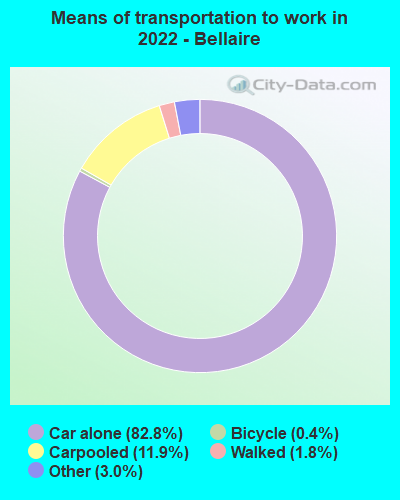
Means of transportation to work:
- Drove a car alone: 968 (75.9%)
- Carpooled: 140 (11.0%)
- Taxi: 43 (3.4%)
- Bicycle: 5 (0.4%)
- Walked: 21 (1.6%)
- Worked at home: 77 (6.0%)
- Unemployment by race in 2022
- Unemployment rate for White non-Hispanic residents
- 0.3%Males
- 1.5%Females

- Year of entry for the foreign-born population in Bellaire, Michigan
- 02010 or later
- 02000 to 2009
- 01990 to 1999
- 01980 to 1989
- 01970 to 1979
- 13Before 1970

First ancestries reported:
- English: 142 (31.1%)
- German: 96 (21.0%)
- American: 44 (9.6%)
- French: 34 (7.4%)
- Irish: 20 (4.4%)
- Canadian: 15 (3.3%)
- European: 12 (2.6%)
- Dutch: 11 (2.4%)
- Scottish: 7 (1.5%)
- Norwegian: 5 (1.1%)
- French Canadian: 3 (0.7%)
- Swedish: 3 (0.7%)
- Yugoslavian: 3 (0.7%)
- Italian: 2 (0.4%)
- Scotch-Irish: 2 (0.4%)
- Kenyan: 2 (0.4%)
Most common places of birth for foreign-born residents (%):
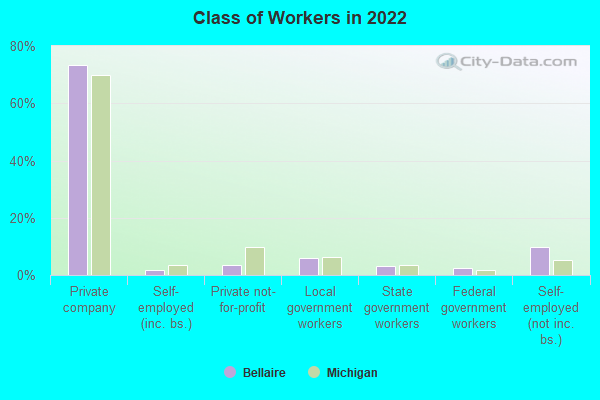
| Bellaire: | 72.7% (8) |
| Michigan: | 5.0% (35,052) |
| Bellaire: | 9.1% (1) |
| Michigan: | 2.3% (16,126) |
Place of birth for U.S.-born residents:
- This state: 781
- Other state: 154
- Northeast: 28
- Midwest: 64
- South: 32
- West: 29
89.4% of Bellaire residents lived in the same house 1 years ago.
Out of people who lived in different houses, 34.0% lived in this county.
Out of people who lived in different counties, 95.5% lived in Michigan.
| Bellaire: | 89.4% |
| State average: | 88.4% |
Education attainment for males 25 years and older:
- No schooling: 0
- Nursery to 4th grade: 0
- 5th and 6th grade: 0
- 7th and 8th grade: 11
- 9th grade: 2
- 10th grade: 1
- 11th grade: 1
- 12th grade, no diploma: 0
- High school graduate (or equivalency): 119
- Less than 1 year of college: 12
- Some college more than 1 year, no degree: 49
- Associate degree: 18
- Bachelor's degree: 103
- Master's degree: 16
- Professional school degree: 8
- Doctorate degree: 0

Education attainment for females 25 years and older:
- No schooling: 3
- Nursery to 4th grade: 0
- 5th and 6th grade: 0
- 7th and 8th grade: 6
- 9th grade: 0
- 10th grade: 11
- 11th grade: 5
- 12th grade, no diploma: 0
- High school graduate (or equivalency): 90
- Less than 1 year of college: 22
- Some college more than 1 year, no degree: 47
- Associate degree: 38
- Bachelor's degree: 88
- Master's degree: 43
- Professional school degree: 0
- Doctorate degree: 7


Housing units in structures:
- One, detached: 429
- Two: 6
- 3 or 4: 75
- 5 to 9: 26
- Mobile homes: 10
House/condo owner moved in on average 10 years ago
Renter moved in on average 5 years ago

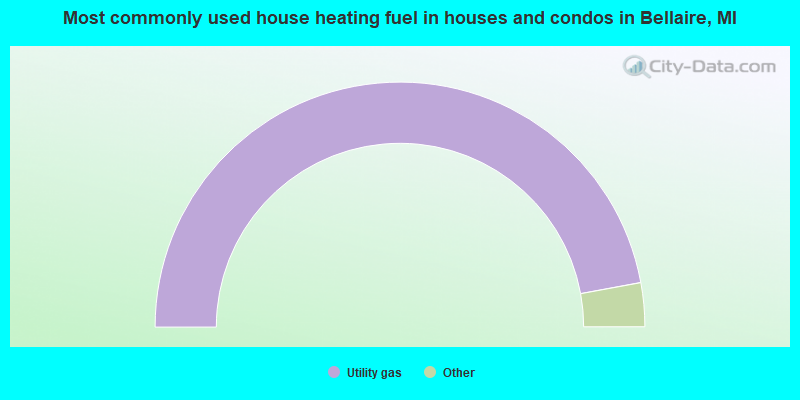
- 94.2%Utility gas
- 3.6%Electricity
- 1.2%No fuel used
- 0.9%Wood
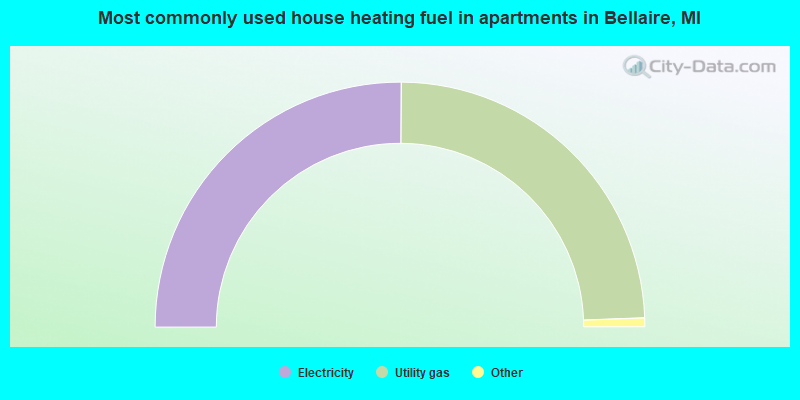
- 50.8%Electricity
- 49.2%Utility gas
Private vs. public school enrollment:
| Here: | 19.4% |
| Michigan: | 12.4% |
| Here: | 0.0% |
| Michigan: | 9.8% |
| Here: | 16.7% |
| Michigan: | 14.9% |


