Belfair, WA (Washington) Houses and Residents
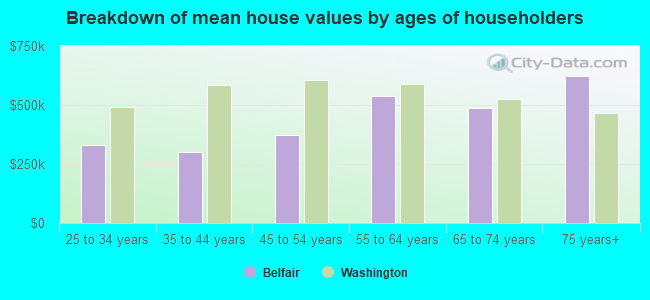
Estimated median house or condo value in 2022: $532,703 (it was $149,400 in 2000 )
Belfair:
$532,703Washington:
$569,500
Lower value quartile - upper value quartile: $325,398 - $735,341Total population: 6,221 (Urban population: 0, Rural population: 5,422 (9 farm, 5,413 nonfarm ))
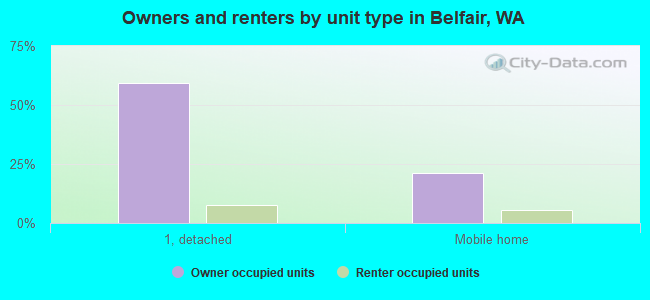
Houses: 2,609 (2,130 occupied: 1,752 owner occupied, 378 renter occupied )
% of renters here:
18%State:
36%
Housing density: 58 houses/condos per square mile
Median price asked for vacant for-sale houses and condos in 2022 in this county: $354,348.
Median contract rent in 2022: $1,013 (lower quartile is $615, upper quartile is $1,473)
Median rent asked for vacant for-rent units in 2022: $1,791
Median gross rent in Belfair, WA in 2022: $1,158
Housing units in Belfair with a mortgage: 810 (113 second mortgage, 42 home equity loan, 0 both second mortgage and home equity loan )Houses without a mortgage: 351
Data:
Median house or condo value ($)
Median house or condo value ($ change since 2000)
Median house or condo value ($) - White
Median house or condo value ($) - Black or African American
Median house or condo value ($) - Asian
Median house or condo value ($) - Hispanic or Latino
Median house or condo value ($) - American Indian and Alaska Native
Median house or condo value ($) - Multirace
Median house or condo value ($) - Other Race
Median price asked for mobile homes ($)
Household density (households per square mile)
Mean house or condo value by units in structure - 1, detached ($)
Mean house or condo value by units in structure - 1, attached ($)
Mean house or condo value by units in structure - 2 ($)
Mean house or condo value by units in structure by units in structure - 3 or 4 ($)
Mean house or condo value by units in structure - 5 or more ($)
Mean house or condo value by units in structure - Boat, RV, van, etc. ($)
Mean house or condo value by units in structure - Mobile home ($)
Median contract rent ($)
Median contract rent - Lower quartile ($)
Median contract rent - Upper quartile ($)
Median gross rent ($)
Urban houses (%)
Rural houses (%)
Houses occupied (%)
Houses occupied (% change since 2000)
Houses owner occupied (%)
Houses owner occupied (% change since 2000)
Houses renter occupied (%)
Houses renter occupied (% change since 2000)
Vacant housing units - For rent (%)
Vacant housing units - For rent (% change since 2000)
Vacant housing units - For sale only (%)
Vacant housing units - For sale only (% change since 2000)
Vacant housing units - Rented or sold, not occupied (%)
Vacant housing units - Rented or sold, not occupied (% change since 2000)
Vacant housing units - For seasonal, recreational, or occasional use (%)
Vacant housing units - For seasonal, recreational, or occasional use (% change since 2000)
Vacant housing units - For migrant workers (%)
Vacant housing units - For migrant workers (% change since 2000)
Vacant housing units - Other vacant (%)
Vacant housing units - Other vacant (% change since 2000)
Median monthly housing costs ($)
Median household income for houses/condos with a mortgage ($)
Median household income for houses/condos without a mortgage ($)
Median household income ($)
Median household income ($) - White
Median household income ($) - Black or African American
Median household income ($) - Asian
Median household income ($) - Hispanic or Latino
Median household income ($) - American Indian and Alaska Native
Median household income ($) - Multirace
Median household income ($) - Other Race
Mortgage status - with mortgage (%)
Mortgage status - with second mortgage (%)
Mortgage status - with home equity loan (%)
Mortgage status - with both second mortgage and home equity loan (%)
Mortgage status - without a mortgage (%)
Median year house/condo built
Median year apartment built
Household type by relationship - Male householder living alone (%)
Household type by relationship - Male householder not living alone (%)
Household type by relationship - Female householder living alone (%)
Household type by relationship - Female householder not living alone (%)
Household type by relationship - Opposite-Sex spouse (%)
Household type by relationship - Same-Sex spouse (%)
Household type by relationship - Opposite-Sex unmarried partner (%)
Household type by relationship - Same-Sex unmarried partner (%)
Household type by relationship - In group quarters (%)
Size of family households - 2-person household (%)
Size of family households - 3-person household (%)
Size of family households - 4-person household (%)
Size of family households - 5-person household (%)
Size of family households - 6-person household (%)
Size of family households - 7-or-more-person household (%)
Size of nonfamily households - 1-person household (%)
Size of nonfamily households - 2-person household (%)
Size of nonfamily households - 3-person household (%)
Size of nonfamily households - 4-person household (%)
Size of nonfamily households - 5-person household (%)
Size of nonfamily households - 6-person household (%)
Size of nonfamily households - 7-or-moreperson household (%)
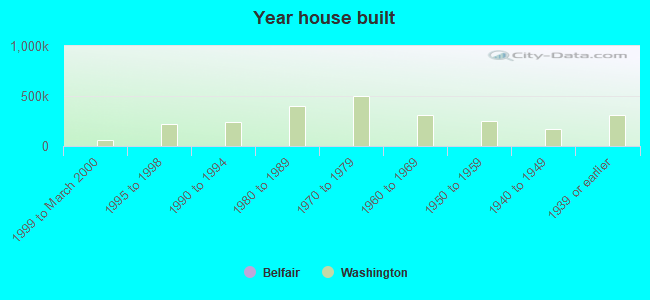
Year house built - Built 2010 or later (%)
Year house built - Built 2000 to 2009 (%)
Year house built - Built 1990 to 1999 (%)
Year house built - Built 1980 to 1989 (%)
Year house built - Built 1970 to 1979 (%)
Year house built - Built 1960 to 1969 (%)
Year house built - Built 1950 to 1959 (%)
Year house built - Built 1940 to 1949 (%)
Year house built - Built 1939 or earlier (%)
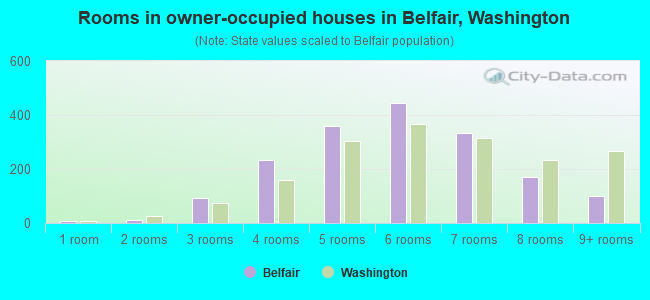
Median number of rooms in houses and condos
Median number of rooms in apartments
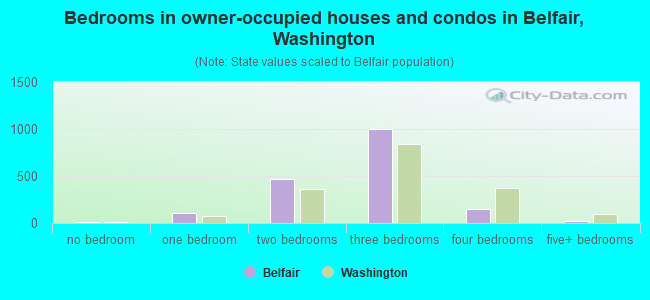
Median number of bedrooms in owner occupied houses
Mean number of bedrooms in owner occupied houses
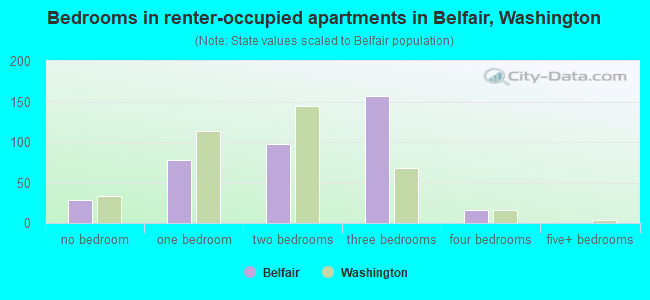
Median number of bedrooms in renter occupied houses
Mean number of bedrooms in renter occupied houses
Median number of vehichles in owner occupied houses
Mean number of vehichles in owner occupied houses
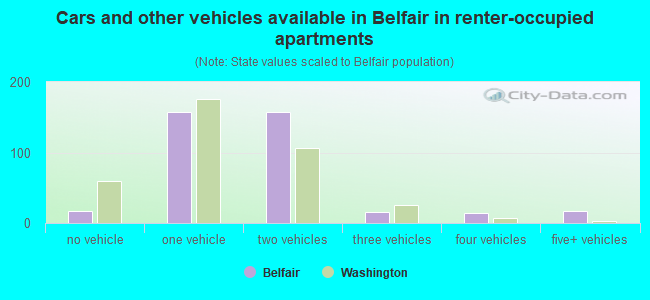
Median number of vehichles in renter occupied houses
Mean number of vehichles in renter occupied houses
Rooms in owner-occupied houses - 1 room (%)
Rooms in owner-occupied houses - 2 rooms (%)
Rooms in owner-occupied houses - 3 rooms (%)
Rooms in owner-occupied houses - 4 rooms (%)
Rooms in owner-occupied houses - 5 rooms (%)
Rooms in owner-occupied houses - 6 rooms (%)
Rooms in owner-occupied houses - 7 rooms (%)
Rooms in owner-occupied houses - 8 rooms (%)
Rooms in owner-occupied houses - 9+ rooms (%)
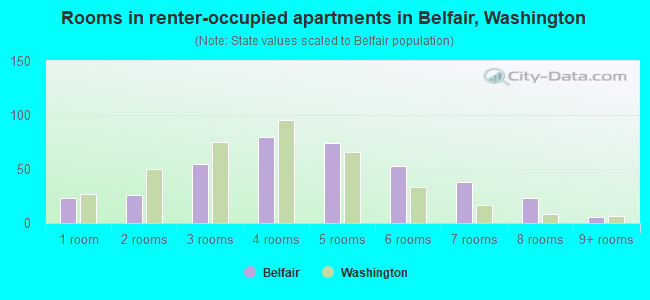
Rooms in renter-occupied houses - 1 room (%)
Rooms in renter-occupied houses - 2 rooms (%)
Rooms in renter-occupied houses - 3 rooms (%)
Rooms in renter-occupied houses - 4 rooms (%)
Rooms in renter-occupied houses - 5 rooms (%)
Rooms in renter-occupied houses - 6 rooms (%)
Rooms in renter-occupied houses - 7 rooms (%)
Rooms in renter-occupied houses - 8 rooms (%)
Rooms in renter-occupied houses - 9+ rooms (%)
Bedrooms in owner-occupied houses - no bedrooms (%)
Bedrooms in owner-occupied houses - 1 bedroom (%)
Bedrooms in owner-occupied houses - 2 bedrooms (%)
Bedrooms in owner-occupied houses - 3 bedrooms (%)
Bedrooms in owner-occupied houses - 4 bedrooms (%)
Bedrooms in owner-occupied houses - 5+ bedrooms (%)
Bedrooms in renter-occupied houses - no bedrooms (%)
Bedrooms in renter-occupied houses - 1 bedroom (%)
Bedrooms in renter-occupied houses - 2 bedrooms (%)
Bedrooms in renter-occupied houses - 3 bedrooms (%)
Bedrooms in renter-occupied houses - 4 bedrooms (%)
Bedrooms in renter-occupied houses - 5+ bedrooms (%)
Vehicles available in owner-occupied houses - no vehicle available (%)
Vehicles available in owner-occupied houses - 1 vehicle available(%)
Vehicles available in owner-occupied houses - 2 Vehicles available (%)
Vehicles available in owner-occupied houses - 3 Vehicles available (%)
Vehicles available in owner-occupied houses - 4 Vehicles available (%)
Vehicles available in owner-occupied houses - 5+ Vehicles available (%)
Vehicles available in renter-occupied houses - no vehicle available (%)
Vehicles available in renter-occupied houses - 1 vehicle available (%)
Vehicles available in renter-occupied houses - 2 Vehicles available (%)
Vehicles available in renter-occupied houses - 3 Vehicles available (%)
Vehicles available in renter-occupied houses - 4 Vehicles available (%)
Vehicles available in renter-occupied houses - 5+ Vehicles available (%)
Housing units in structures - 1, detached (%)
Housing units in structures - 1, attached (%)
Housing units in structures - 2 (%)
Housing units in structures - 3 or 4 (%)
Housing units in structures - 5 to 9 (%)
Housing units in structures - 10 to 19 (%)
Housing units in structures - 20 to 49 (%)
Housing units in structures - 50 or more (%)
Housing units in structures - Mobile home (%)
Housing units in structures - Boat, RV, van, etc. (%)
Housing units in structures - Owners - 1, detached (%)
Housing units in structures - Owners - 1, attached (%)
Housing units in structures - Owners - 2 (%)
Housing units in structures - Owners - 3 or 4 (%)
Housing units in structures - Owners - 5 to 9 (%)
Housing units in structures - Owners - 10 to 19 (%)
Housing units in structures - Owners - 20 to 49 (%)
Housing units in structures - Owners - 50 or more (%)
Housing units in structures - Owners - Mobile home (%)
Housing units in structures - Owners - Boat, RV, van, etc. (%)
Housing units in structures - Renters - 1, detached (%)
Housing units in structures - Renters - 1, attached (%)
Housing units in structures - Renters - 2 (%)
Housing units in structures - Renters - 3 or 4 (%)
Housing units in structures - Renters - 5 to 9 (%)
Housing units in structures - Renters - 10 to 19 (%)
Housing units in structures - Renters - 20 to 49 (%)
Housing units in structures - Renters - 50 or more (%)
Housing units in structures - Renters - Mobile home (%)
Housing units in structures - Renters - Boat, RV, van, etc. (%)
House/condo owner moved in on average (years ago)
Renter moved in on average (years ago)
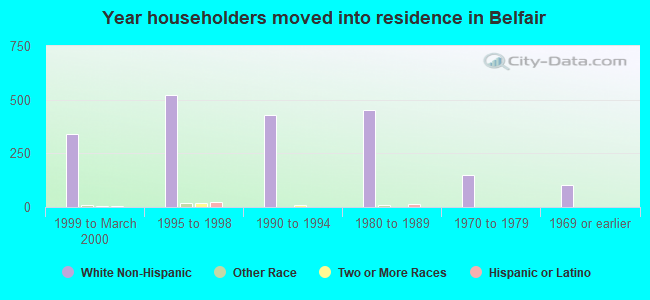
Year householder moved into unit - Moved in 1999 to March 2000 (%)
Year householder moved into unit - Moved in 1999 to March 2000 (%) - White
Year householder moved into unit - Moved in 1999 to March 2000 (%) - Black or African American
Year householder moved into unit - Moved in 1999 to March 2000 (%) - Asian
Year householder moved into unit - Moved in 1999 to March 2000 (%) - Hispanic or Latino
Year householder moved into unit - Moved in 1999 to March 2000 (%) - American Indian and Alaska Native
Year householder moved into unit - Moved in 1999 to March 2000 (%) - Multirace
Year householder moved into unit - Moved in 1999 to March 2000 (%) - Other Race
Year householder moved into unit - Moved in 1995 to 1998 (%)
Year householder moved into unit - Moved in 1995 to 1998 (%) - White
Year householder moved into unit - Moved in 1995 to 1998 (%) - Black or African American
Year householder moved into unit - Moved in 1995 to 1998 (%) - Asian
Year householder moved into unit - Moved in 1995 to 1998 (%) - Hispanic or Latino
Year householder moved into unit - Moved in 1995 to 1998 (%) - American Indian and Alaska Native
Year householder moved into unit - Moved in 1995 to 1998 (%) - Multirace
Year householder moved into unit - Moved in 1995 to 1998 (%) - Other Race
Year householder moved into unit - Moved in 1990 to 1994 (%)
Year householder moved into unit - Moved in 1990 to 1994 (%) - White
Year householder moved into unit - Moved in 1990 to 1994 (%) - Black or African American
Year householder moved into unit - Moved in 1990 to 1994 (%) - Asian
Year householder moved into unit - Moved in 1990 to 1994 (%) - Hispanic or Latino
Year householder moved into unit - Moved in 1990 to 1994 (%) - American Indian and Alaska Native
Year householder moved into unit - Moved in 1990 to 1994 (%) - Multirace
Year householder moved into unit - Moved in 1990 to 1994 (%) - Other Race
Year householder moved into unit - Moved in 1980 to 1989 (%)
Year householder moved into unit - Moved in 1980 to 1989 (%) - White
Year householder moved into unit - Moved in 1980 to 1989 (%) - Black or African American
Year householder moved into unit - Moved in 1980 to 1989 (%) - Asian
Year householder moved into unit - Moved in 1980 to 1989 (%) - Hispanic or Latino
Year householder moved into unit - Moved in 1980 to 1989 (%) - American Indian and Alaska Native
Year householder moved into unit - Moved in 1980 to 1989 (%) - Multirace
Year householder moved into unit - Moved in 1980 to 1989 (%) - Other Race
Year householder moved into unit - Moved in 1970 to 1979 (%)
Year householder moved into unit - Moved in 1970 to 1979 (%) - White
Year householder moved into unit - Moved in 1970 to 1979 (%) - Black or African American
Year householder moved into unit - Moved in 1970 to 1979 (%) - Asian
Year householder moved into unit - Moved in 1970 to 1979 (%) - Hispanic or Latino
Year householder moved into unit - Moved in 1970 to 1979 (%) - American Indian and Alaska Native
Year householder moved into unit - Moved in 1970 to 1979 (%) - Multirace
Year householder moved into unit - Moved in 1970 to 1979 (%) - Other Race
Year householder moved into unit - Moved in 1969 or earlier (%)
Year householder moved into unit - Moved in 1969 or earlier (%) - White
Year householder moved into unit - Moved in 1969 or earlier (%) - Black or African American
Year householder moved into unit - Moved in 1969 or earlier (%) - Asian
Year householder moved into unit - Moved in 1969 or earlier (%) - Hispanic or Latino
Year householder moved into unit - Moved in 1969 or earlier (%) - American Indian and Alaska Native
Year householder moved into unit - Moved in 1969 or earlier (%) - Multirace
Year householder moved into unit - Moved in 1969 or earlier (%) - Other Race
Housing units lacking complete plumbing facilities (%)
Housing units lacking complete kitchen facilities (%)
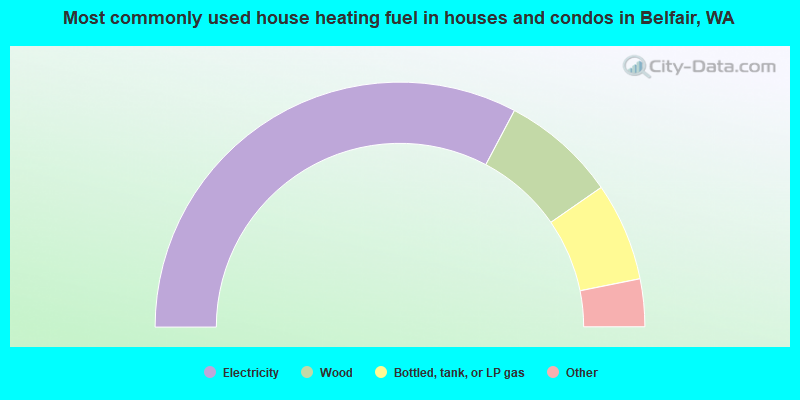
House heating fuel used in houses and condos - Utility gas (%)
House heating fuel used in houses and condos - Bottled, tank, or LP gas (%)
House heating fuel used in houses and condos - Electricity (%)
House heating fuel used in houses and condos - Fuel oil, kerosene, etc. (%)
House heating fuel used in houses and condos - Coal or coke (%)
House heating fuel used in houses and condos - Wood (%)
House heating fuel used in houses and condos - Solar energy (%)
House heating fuel used in houses and condos - Other fuel (%)
House heating fuel used in houses and condos - No fuel used (%)
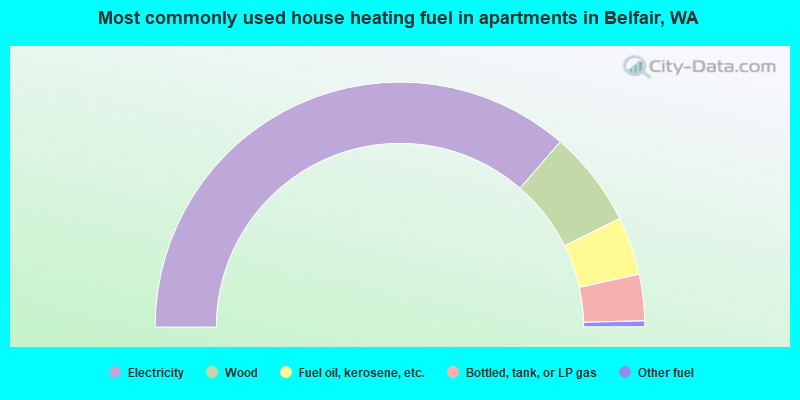
House heating fuel used in apartments - Utility gas (%)
House heating fuel used in apartments - Bottled, tank, or LP gas (%)
House heating fuel used in apartments - Electricity (%)
House heating fuel used in apartments - Fuel oil, kerosene, etc. (%)
House heating fuel used in apartments - Coal or coke (%)
House heating fuel used in apartments - Wood (%)
House heating fuel used in apartments - Solar energy (%)
House heating fuel used in apartments - Other fuel (%)
House heating fuel used in apartments - No fuel used (%)
Household type by relationship:
Households: 58,367
In family households: 48,388 (11,586 male householders , 4,471 female householders )
12,503 spouses , 14,110 children (12,515 natural , 530 adopted , 1,065 stepchildren ), 1,265 grandchildren , 512 brothers or sisters , 471 parents , foster children , 813 other relatives , 2,236 non-relatives In nonfamily households: 9,979 (4,050 male householders (3,015 living alone )), 3,725 female householders (3,021 living alone )), 2,204 nonrelatives In group quarters: 2,332 (2,208 institutionalized population)
7,246 married couples with children. single-parent households (887 men , 2,057 women ).
96.5% of residents of Belfair speak English at home. of residents speak Spanish at home (50% speak English very well , 10% speak English well , 16% speak English not well , 24% don't speak English at all ).of residents speak other Indo-European language at home (49% speak English very well , 41% speak English well , 10% speak English not well ).of residents speak Asian or Pacific Island language at home (90% speak English very well , 10% speak English not well ).
Foreign born population: 552 (7.4%)of them are naturalized citizens )
Median number of rooms in houses and condos:
Median number of rooms in apartments
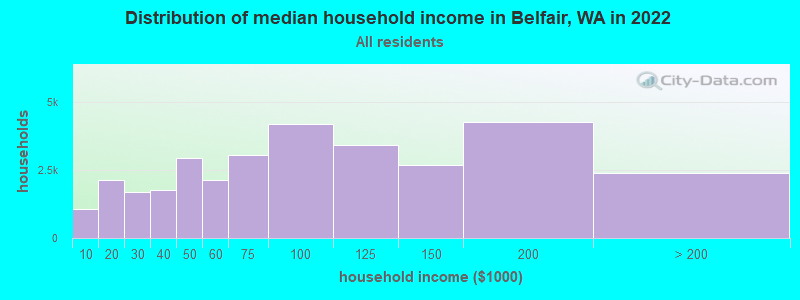
Belfair, WA household income distribution 1,045 Less than $10,0002,126 $10,000 to $19,9991,694 $20,000 to $29,9991,763 $30,000 to $39,9992,939 $40,000 to $49,9992,113 $50,000 to $59,9993,057 $60,000 to $74,9994,163 $75,000 to $99,9993,420 $100,000 to $124,9992,691 $125,000 to $149,9994,252 $150,000 to $199,9992,390 $200,000 or more
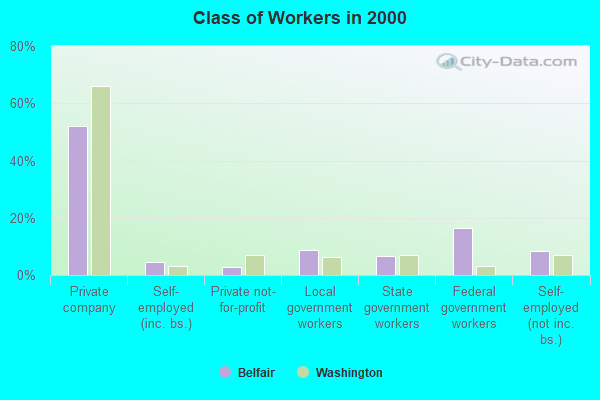
Percentage of workers working in this county: 36.5%Number of people working at home: 418 (15.8% of all workers )
Travel time to work (commute)
Less than 5 minutes: 715 to 9 minutes: 11310 to 14 minutes: 18015 to 19 minutes: 18820 to 24 minutes: 25025 to 29 minutes: 19630 to 34 minutes: 31935 to 39 minutes: 12640 to 44 minutes: 5945 to 59 minutes: 26560 to 89 minutes: 21590 or more minutes: 129
Means of transportation to work:
Drove a car alone: 1,548 (70.7%)Carpooled: 419 (19.1%)Bus or trolley bus : 15 (0.7%)Railroad : 11 (0.5%)Ferryboat: 33 (1.5%)Motorcycle: 12 (0.5%)Bicycle: 8 (0.4%)Walked: 43 (2.0%)Other means: 22 (1.0%)Worked at home: 78 (3.6%)
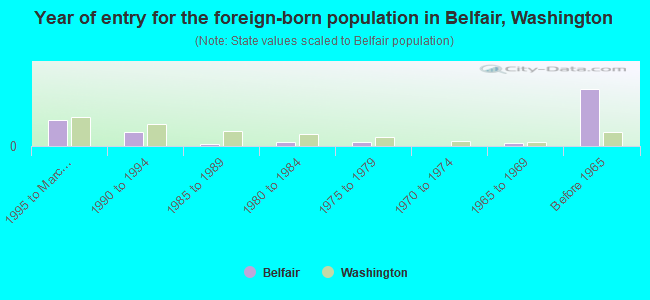
Year of entry for the foreign-born population in Belfair, Washington
58 1995 to March 2000 31 1990 to 1994 5 1985 to 1989 10 1980 to 1984 9 1975 to 1979 0 1970 to 1974 7 1965 to 1969 128 Before 1965
Most common places of birth for foreign-born residents (%): Guatemala Belfair:
23.4% (58)Washington:
0.5% (3,096)
Canada Belfair:
21.8% (54)Washington:
7.7% (47,568)
Philippines Belfair:
14.1% (35)Washington:
7.6% (46,733)
United Kingdom Belfair:
8.9% (22)Washington:
3.3% (20,321)
Germany Belfair:
4.8% (12)Washington:
3.4% (21,167)
Italy Belfair:
4.4% (11)Washington:
0.4% (2,307)
Other Eastern Europe Belfair:
4.4% (11)Washington:
1.2% (7,645)
Korea Belfair:
4.4% (11)Washington:
6.2% (38,172)
Cuba Belfair:
4.0% (10)Washington:
0.2% (1,259)
Yugoslavia Belfair:
2.8% (7)Washington:
0.2% (1,110)
Australia Belfair:
2.4% (6)Washington:
0.4% (2,329)
Russia Belfair:
2.0% (5)Washington:
2.5% (15,491)
Place of birth for U.S.-born residents:
This state: 2,720Other state: 2,375Northeast: 174Midwest: 633South: 337West: 1,231 57% of Belfair residents lived in the same house 5 years ago.
Out of people who lived in different houses, 22% lived in this county.
Out of people who lived in different counties, 75% lived in Washington.
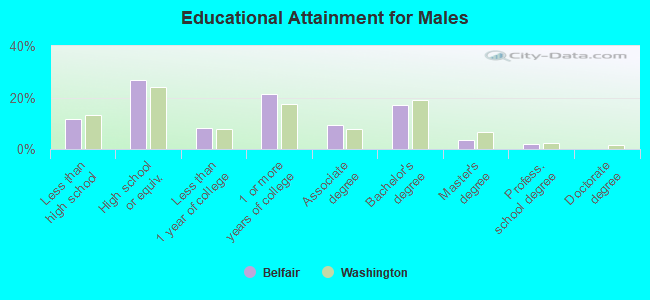
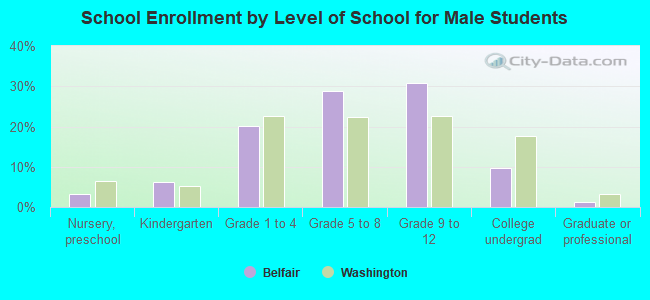
Education attainment for males 25 years and older:
No schooling: 7Nursery to 4th grade: 85th and 6th grade: 07th and 8th grade: 109th grade: 3610th grade: 6011th grade: 4112th grade, no diploma: 56High school graduate (or equivalency): 507Less than 1 year of college: 152Some college more than 1 year, no degree: 406Associate degree: 176Bachelor's degree: 321Master's degree: 69Professional school degree: 38Doctorate degree: 3
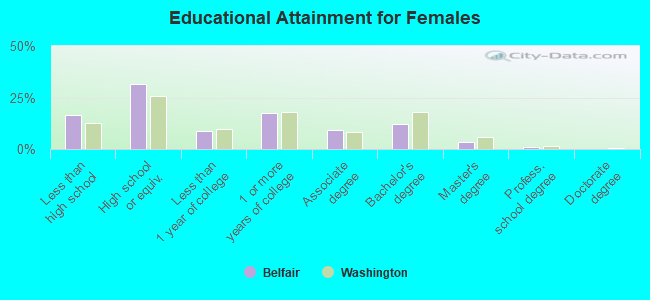
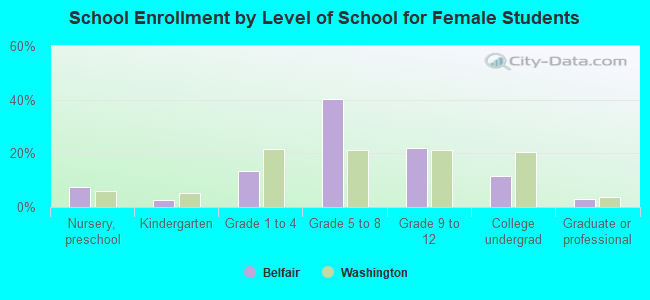
Education attainment for females 25 years and older:
No schooling: 7Nursery to 4th grade: 155th and 6th grade: 27th and 8th grade: 139th grade: 3410th grade: 5211th grade: 7712th grade, no diploma: 106High school graduate (or equivalency): 583Less than 1 year of college: 167Some college more than 1 year, no degree: 327Associate degree: 175Bachelor's degree: 224Master's degree: 59Professional school degree: 20Doctorate degree: 0
Housing units in structures:
One, detached: 1,847One, attached: 20Two: 383 or 4: 225 to 9: 1620 to 49: 29Mobile homes: 599Boats, RVs, vans, etc.: 38Median worth of mobile homes: $150,085
Housing units lacking complete plumbing facilities: 0.5%Housing units lacking complete kitchen facilities: 0.7%Private vs. public school enrollment:
Students in private schools in grades 1 to 8 (elementary and middle school): 59 Students in private schools in grades 9 to 12 (high school): 9 Students in private undergraduate colleges: 18 Here:
13.0%Washington:
15.7%