Housing density: 696 houses/condos per square mile
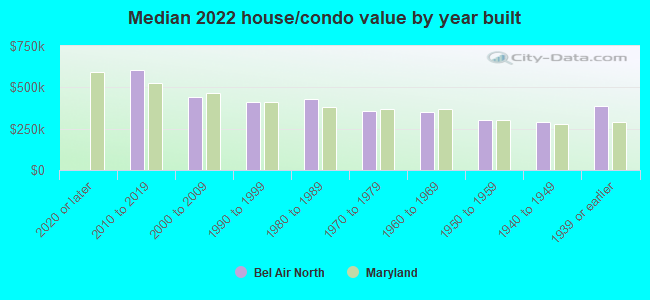
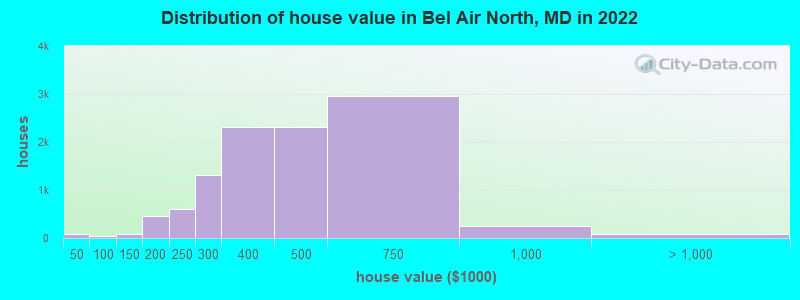
Median price asked for vacant for-sale houses and condos in 2022: $272,551.
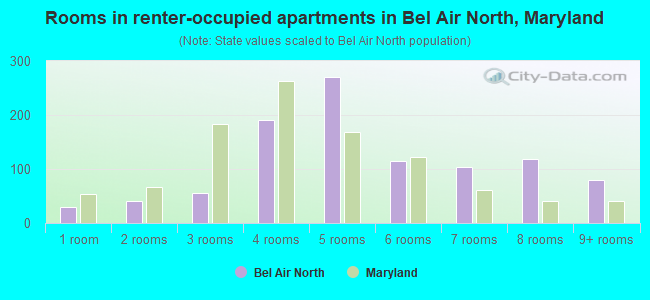
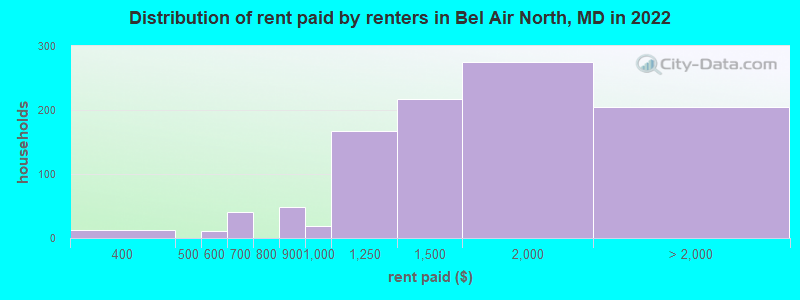
Median contract rent in 2022: $1,480 (lower quartile is $1,120, upper quartile is $1,860)
Median rent asked for vacant for-rent units in 2022: $1,354
Median gross rent in Bel Air North, MD in 2022: $1,678
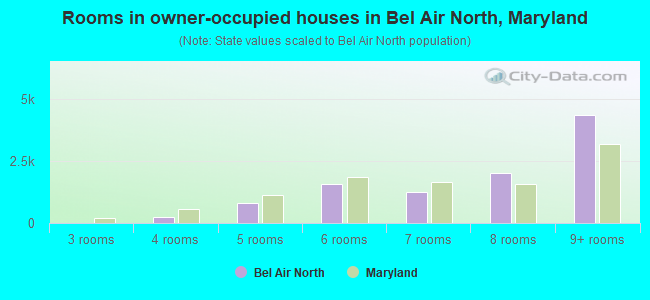
Housing units in Bel Air North with a mortgage: 7,019 (775 second mortgage, 36 home equity loan, 645 both second mortgage and home equity loan) Houses without a mortgage: 218
Median household income for houses/condos with a mortgage: $157,194
Median household income for apartments without a mortgage: $99,394
Median monthly housing costs: $1,574
Compare current foreclosures near Bel Air North, MD:
Size of family households: 3,107 2-persons, 2,189 3-persons, 2,010 4-persons, 890 5-persons, 249 6-persons, 79 7-or-more-persons.
Size of nonfamily households: 2,195 1-person, 307 2-persons, 19 4-persons.
6,824 married couples with children.
717 single-parent households (228 men, 489 women).
94.4% of residents of Bel Air North speak English at home.
1.5% of residents speak Spanish at home (57% speak English very well, 14% speak English well, 29% speak English not well).
2.1% of residents speak other Indo-European language at home (78% speak English very well, 12% speak English well, 2% speak English not well, 7% don't speak English at all).
0.7% of residents speak Asian or Pacific Island language at home (76% speak English very well, 23% speak English well, 1% speak English not well).
0.3% of residents speak other language at home (100% speak English very well).
Foreign born population: 1,081 (3.4%)
(84.1% of them are naturalized citizens)
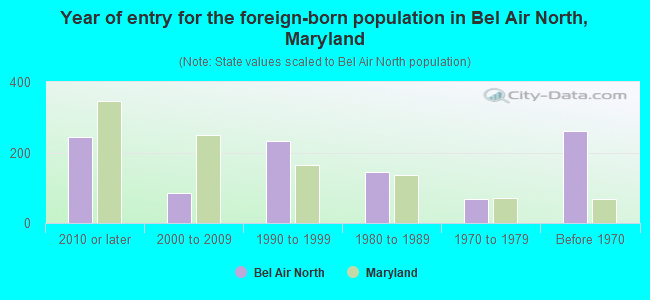
Year of entry for the foreign-born population in Bel Air North, Maryland
2442010 or later
842000 to 2009
2331990 to 1999
1451980 to 1989
691970 to 1979
262Before 1970
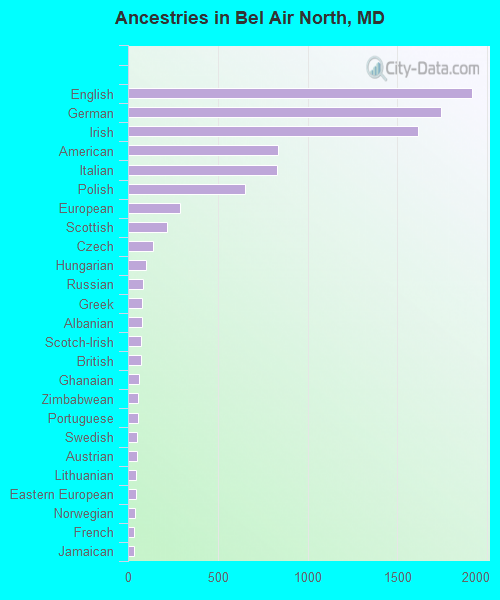
First ancestries reported:
English: 1,914 (15.1%)
German: 1,744 (13.7%)
Irish: 1,612 (12.7%)
American: 835 (6.6%)
Italian: 827 (6.5%)
Polish: 649 (5.1%)
European: 292 (2.3%)
Scottish: 218 (1.7%)
Czech: 141 (1.1%)
Hungarian: 101 (0.8%)
Russian: 82 (0.6%)
Greek: 78 (0.6%)
Albanian: 77 (0.6%)
Scotch-Irish: 73 (0.6%)
British: 70 (0.6%)
Ghanaian: 63 (0.5%)
Zimbabwean: 55 (0.4%)
Portuguese: 54 (0.4%)
Swedish: 52 (0.4%)
Austrian: 49 (0.4%)
Lithuanian: 45 (0.4%)
Eastern European: 43 (0.3%)
Norwegian: 38 (0.3%)
French: 35 (0.3%)
Jamaican: 31 (0.2%)
Ukrainian: 26 (0.2%)
French Canadian: 19 (0.1%)
Armenian: 18 (0.1%)
Barbadian: 15 (0.1%)
Egyptian: 14 (0.1%)
Palestinian: 13 (0.1%)
Finnish: 12 (0.09%)
Swiss: 12 (0.09%)
Welsh: 12 (0.09%)
Scandinavian: 10 (0.08%)
Guyanese: 9 (0.07%)
Pennsylvania German: 8 (0.06%)
African: 8 (0.06%)
Trinidadian and Tobagonian: 8 (0.06%)
West Indian: 8 (0.06%)
Slovak: 7 (0.06%)
Dutch: 7 (0.06%)
Czechoslovakian: 4 (0.03%)
Most common places of birth for foreign-born residents (%):
India
Bel Air North:
9.8% (94)
Maryland:
6.4% (61,725)
Zimbabwe
Bel Air North:
8.6% (83)
Maryland:
0.1% (1,254)
Albania
Bel Air North:
7.2% (69)
Maryland:
0.1% (617)
Korea
Bel Air North:
5.8% (56)
Maryland:
3.4% (32,635)
Pakistan
Bel Air North:
5.4% (52)
Maryland:
1.8% (17,037)
Russia
Bel Air North:
4.9% (47)
Maryland:
1.0% (9,481)
Ghana
Bel Air North:
4.8% (46)
Maryland:
1.8% (17,774)
United Kingdom, excluding England and Scotland
Bel Air North:
4.4% (42)
Maryland:
0.7% (6,724)
Thailand
Bel Air North:
4.3% (41)
Maryland:
0.4% (3,874)
Philippines
Bel Air North:
4.3% (41)
Maryland:
3.8% (36,698)
Guatemala
Bel Air North:
3.3% (32)
Maryland:
4.4% (42,350)
Jamaica
Bel Air North:
3.2% (31)
Maryland:
2.8% (27,444)
Japan
Bel Air North:
2.4% (23)
Maryland:
0.5% (4,995)
Colombia
Bel Air North:
2.2% (21)
Maryland:
1.3% (12,898)
England
Bel Air North:
2.1% (20)
Maryland:
0.6% (5,828)
France
Bel Air North:
2.1% (20)
Maryland:
0.4% (4,217)
Italy
Bel Air North:
2.0% (19)
Maryland:
0.5% (4,596)
Oceania, n.e.c.
Bel Air North:
2.0% (19)
Maryland:
0.0% (186)
Portugal
Bel Air North:
1.9% (18)
Maryland:
0.1% (1,431)
Canada
Bel Air North:
1.8% (17)
Maryland:
0.9% (8,603)
Argentina
Bel Air North:
1.8% (17)
Maryland:
0.4% (4,282)
Trinidad and Tobago
Bel Air North:
1.7% (16)
Maryland:
1.2% (11,481)
China, excluding Hong Kong and Taiwan
Bel Air North:
1.6% (15)
Maryland:
4.6% (44,742)
Peru
Bel Air North:
1.6% (15)
Maryland:
1.8% (17,161)
Place of birth for U.S.-born residents:
This state: 23,077
Other state: 7,411
Northeast: 4,147
Midwest: 812
South: 1,917
West: 572
93.1% of Bel Air North residents lived in the same house 1 years ago. Out of people who lived in different houses, 36.8% lived in this county. Out of people who lived in different counties, 82.9% lived in Maryland.
Bel Air North:
93.1%
State average:
88.5%
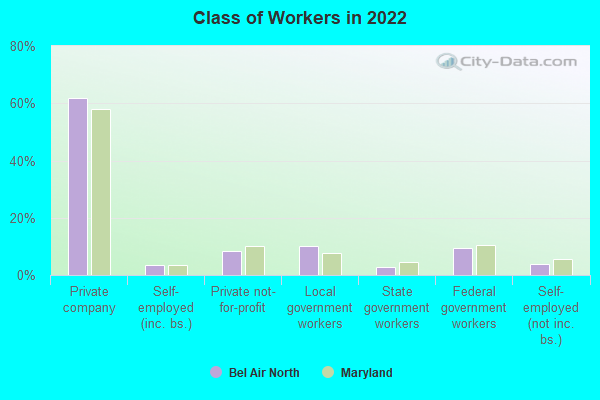
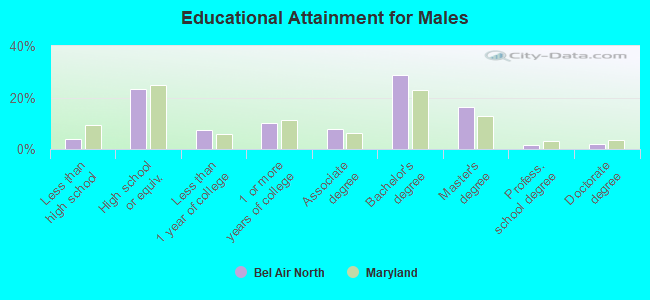
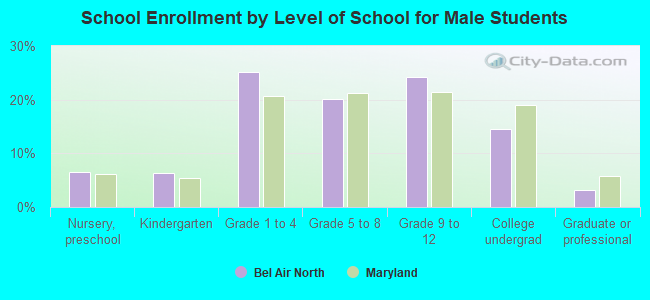
Education attainment for males 25 years and older:
No schooling: 77
Nursery to 4th grade: 0
5th and 6th grade: 0
7th and 8th grade: 32
9th grade: 24
10th grade: 29
11th grade: 111
12th grade, no diploma: 136
High school graduate (or equivalency): 2,420
Less than 1 year of college: 754
Some college more than 1 year, no degree: 1,044
Associate degree: 802
Bachelor's degree: 3,006
Master's degree: 1,687
Professional school degree: 145
Doctorate degree: 186
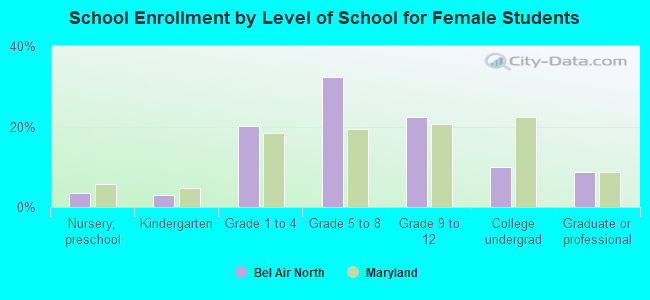
Education attainment for females 25 years and older:
No schooling: 99
Nursery to 4th grade: 0
5th and 6th grade: 46
7th and 8th grade: 45
9th grade: 26
10th grade: 20
11th grade: 118
12th grade, no diploma: 79
High school graduate (or equivalency): 2,543
Less than 1 year of college: 681
Some college more than 1 year, no degree: 954
Associate degree: 1,218
Bachelor's degree: 3,015
Master's degree: 2,310
Professional school degree: 69
Doctorate degree: 201
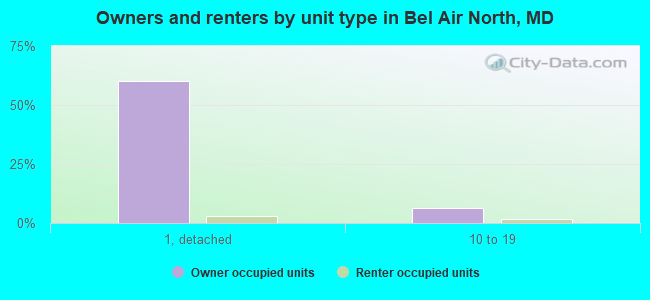
Housing units in structures:
One, detached: 7,527
One, attached: 2,407
Two: 12
3 or 4: 10
5 to 9: 320
10 to 19: 927
20 to 49: 101
50 or more: 78
Mobile homes: 9
Housing units lacking complete plumbing facilities in 2022: 0.7%
Housing units lacking complete kitchen facilities in 2022: 1.8%
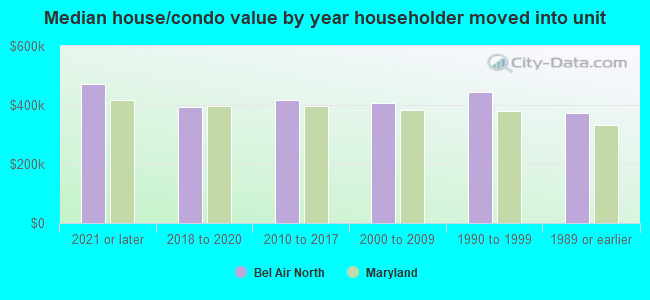
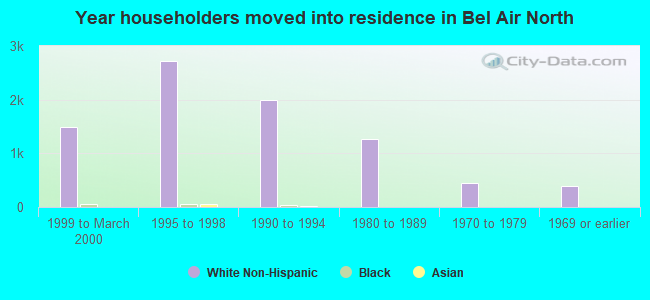
House/condo owner moved in on average 13 years ago