Beecher, IL (Illinois) Houses and Residents
| Beecher: | $240,211 |
| Illinois: | $251,600 |
Total population: 4,461 (Urban population: 1,848, Rural population: 181 (all nonfarm))
Houses: 1,940 (1,821 occupied: 1,444 owner occupied, 390 renter occupied)
| % of renters here: | 21% |
| State: | 33% |
Housing density: 920 houses/condos per square mile
Median price asked for vacant for-sale houses and condos in 2022 in this county: $222,708.
Median contract rent in 2022: $806 (lower quartile is $648, upper quartile is $997)
Median rent asked for vacant for-rent units in 2022: $800
Median gross rent in Beecher, IL in 2022: $1,078
Housing units in Beecher with a mortgage: 900 (38 second mortgage, 0 home equity loan, 24 both second mortgage and home equity loan)
Houses without a mortgage: 0
Median household income for houses/condos with a mortgage: $105,550
Median household income for apartments without a mortgage: $85,741
Median monthly housing costs: $1,293
Compare current foreclosures near Beecher, IL:
| Photo | Address | Area | Beds / Baths | Price | Details |
|---|---|---|---|---|---|

|
#1
Orchard Ln
Beecher, IL 60401
|
1,600 sq. feet
|
2 baths 3 beds |
show details | |

|
#2
Chestnut Ln
Beecher, IL 60401
|
- sq. feet
|
- baths - beds |
show details | |

|
#3
Whipporwill Dr
Beecher, IL 60401
|
- sq. feet
|
- baths - beds |
show details | |

|
#4
Catalpa St
Beecher, IL 60401
|
- sq. feet
|
- baths - beds |
show details | |

|
#5
Stonington Ave
Beecher, IL 60401
|
- sq. feet
|
- baths - beds |
show details | |

|
#6
Sandpiper Ln
Beecher, IL 60401
|
- sq. feet
|
- baths - beds |
show details | |

|
#7
Swan Ln
Beecher, IL 60401
|
- sq. feet
|
- baths - beds |
show details | |

|
#8
Chestnut Ln
Beecher, IL 60401
|
- sq. feet
|
- baths - beds |
show details | |

|
#9
Bobwhite Ln
Beecher, IL 60401
|
- sq. feet
|
- baths - beds |
show details | |

|
#10
N Bruce Ln Apt 311
Glenwood, IL 60425
|
1,000 sq. feet
|
2 baths 2 beds |
$185,000
|
show details |
| Photo | Address | Area | Beds / Baths | Price | Details |
|---|---|---|---|---|---|

|
#11
Hellenic Dr
Olympia Fields, IL 60461
|
4,000 sq. feet
|
3 baths 4 beds |
$495,000
|
show details |

|
#12
Tarpon Ct
Homewood, IL 60430
|
1,800 sq. feet
|
3 baths 4 beds |
$355,000
|
show details |

|
#13
Hemlock St
Park Forest, IL 60466
|
1,000 sq. feet
|
1 baths 2 beds |
$85,000
|
show details |

|
#14
Idlewild Dr
Country Club Hills, IL 60478
|
1,300 sq. feet
|
1 baths 3 beds |
$279,900
|
show details |

|
#15
176th Pl
Lansing, IL 60438
|
1,511 sq. feet
|
1 baths 2 beds |
$168,480
|
show details |

|
#16
Richton Rd
Steger, IL 60475
|
1,400 sq. feet
|
1 baths 3 beds |
$209,900
|
show details |

|
#17
Finch Ave
Harvey, IL 60426
|
1,108 sq. feet
|
2 baths 3 beds |
$225,000
|
show details |

|
#18
Peoria St
Steger, IL 60475
|
616 sq. feet
|
1 baths 2 beds |
$78,500
|
show details |

|
#19
Whitman Ave
Hazel Crest, IL 60429
|
1,360 sq. feet
|
2 baths 2 beds |
$137,900
|
show details |

|
#20
Fox Hound Trl
Beecher, IL 60401
|
- sq. feet
|
- baths - beds |
show details |
| Photo | Address | Area | Beds / Baths | Price | Details |
|---|---|---|---|---|---|

|
#21
Saddle Run Ln
Beecher, IL 60401
|
- sq. feet
|
- baths - beds |
show details | |

|
#22
Melrose Ln
Beecher, IL 60401
|
- sq. feet
|
- baths - beds |
show details | |

|
#23
Monhegan Ave
Beecher, IL 60401
|
- sq. feet
|
- baths - beds |
show details | |

|
#24
Trailside Dr
Beecher, IL 60401
|
- sq. feet
|
- baths - beds |
show details | |

|
#25
Woodward St
Beecher, IL 60401
|
- sq. feet
|
- baths - beds |
show details | |

|
#26
Fox Hound Trl
Beecher, IL 60401
|
- sq. feet
|
- baths - beds |
show details | |

|
#27
Castine Way
Beecher, IL 60401
|
- sq. feet
|
- baths - beds |
show details | |

|
#28
Orchard Ln
Beecher, IL 60401
|
- sq. feet
|
- baths - beds |
show details | |

|
#29
Heather Rd E
Bourbonnais, IL 60914
|
- sq. feet
|
2 baths 3 beds |
$297,400
|
show details |

|
#30
Spring Creek Dr
Highland, IN 46322
|
1,200 sq. feet
|
2 baths 2 beds |
show details |
| Photo | Address | Area | Beds / Baths | Price | Details |
|---|---|---|---|---|---|

|
#31
Peterson Ave
Chicago Heights, IL 60411
|
1,840 sq. feet
|
2 baths 3 beds |
show details | |

|
#32
Peoria St
Steger, IL 60475
|
1,518 sq. feet
|
2 baths 4 beds |
show details | |

|
#33
176th St
Country Club Hills, IL 60478
|
1,245 sq. feet
|
2 baths 4 beds |
show details | |

|
#34
Elm Ct
Flossmoor, IL 60422
|
1,471 sq. feet
|
2 baths 4 beds |
show details | |

|
#35
Hilltop Ave
Chicago Heights, IL 60411
|
988 sq. feet
|
2 baths 3 beds |
show details | |

|
#36
Burnham Ave
Lansing, IL 60438
|
1,056 sq. feet
|
1 baths 3 beds |
show details | |

|
#37
N Gay Ct
Glenwood, IL 60425
|
1,088 sq. feet
|
1 baths 3 beds |
show details | |

|
#38
Louis Ave
South Holland, IL 60473
|
1,221 sq. feet
|
2 baths 3 beds |
show details | |

|
#39
Wellington Ct
Hazel Crest, IL 60429
|
1,064 sq. feet
|
1 baths 3 beds |
show details | |

|
#40
E Timberline Ct
Crete, IL 60417
|
3,702 sq. feet
|
3 baths 5 beds |
show details |
| Photo | Address | Area | Beds / Baths | Price | Details |
|---|---|---|---|---|---|

|
#41
Antholl St
Flossmoor, IL 60422
|
4,131 sq. feet
|
4 baths 4 beds |
show details | |

|
#42
168th St
Hazel Crest, IL 60429
|
832 sq. feet
|
1 baths 2 beds |
show details | |

|
#43
Williams Dr
Crown Point, IN 46307
|
2,174 sq. feet
|
2 baths 4 beds |
show details | |

|
#44
Rutledge St
Park Forest, IL 60466
|
1,121 sq. feet
|
1 baths 3 beds |
show details | |

|
#45
Gentry St
Park Forest, IL 60466
|
1,224 sq. feet
|
1 baths 3 beds |
show details | |

|
#46
Sequoia Ave
Chicago Heights, IL 60411
|
1,470 sq. feet
|
1 baths 4 beds |
show details | |

|
#47
E 194th St
Glenwood, IL 60425
|
1,405 sq. feet
|
2 baths 3 beds |
show details | |

|
#48
Albany Ave Apt 108
Hazel Crest, IL 60429
|
900 sq. feet
|
1 baths 2 beds |
show details | |

|
#49
University Ave
South Holland, IL 60473
|
1,659 sq. feet
|
1 baths 3 beds |
show details | |

|
Check over 1 million property listings on Foreclosure.com!
|
browse all offers | |||

Latest news about housing in Beecher, IL collected exclusively by city-data.com from local newspapers, TV, and radio stations

 | Relocating - Need advice on rural living areas near Homewood IL (8 replies) |
| Talk to me about Lansing IL (12 replies) |
| What's Going To Happen To Flossmoor?? (144 replies) |
| Looking for a nice suburb(s) with the lowest property taxes (22 replies) |
| Moving far south rural suburbs, which town is best? (57 replies) |
| The southern suburbs in the next 10-20 years. (257 replies) |

Median year apartment built: 1984
Household type by relationship:
Households: 4,559- Male householders: 948 (308 living alone), Female householders: 846 (317 living alone)
859 spouses (845 opposite-sex spouses), 114 unmarried partners, (114 opposite-sex unmarried partners), 1,348 children (1,240 natural, 18 adopted, 88 stepchildren), 63 grandchildren, 194 brothers or sisters, 35 parents, 0 foster children, 21 other relatives, 0 non-relatives
- In group quarters: 122
Size of family households: 462 2-persons, 335 3-persons, 173 4-persons, 114 5-persons, 53 6-persons.
Size of nonfamily households: 644 1-person, 44 2-persons.
859 married couples with children.
78 single-parent households (15 men, 63 women).
90.4% of residents of Beecher speak English at home.
4.4% of residents speak Spanish at home (88% speak English very well, 12% speak English well).
2.0% of residents speak other Indo-European language at home (81% speak English very well, 19% speak English well).
1.4% of residents speak Asian or Pacific Island language at home (77% speak English very well, 23% speak English not well).
Foreign born population: 24 (0.5%)
(95.8% of them are naturalized citizens)
| Here: | 6.4 |
| State: | 6.4 |
| Here: | 4.4 |
| State: | 4.1 |

- Bedrooms in owner-occupied houses and condos in Beecher, Illinois
- 0no bedroom
- 01 bedroom
- 3492 bedrooms
- 7113 bedrooms
- 2924 bedrooms
- 925+ bedrooms

- Bedrooms in renter-occupied apartments in Beecher, Illinois
- 0no bedroom
- 1141 bedroom
- 2032 bedrooms
- 543 bedrooms
- 184 bedrooms
- 05+ bedrooms

- Cars and other vehicles available in Beecher in owner-occupied houses/condos
- 44no vehicle
- 5301 vehicle
- 4452 vehicles
- 3903 vehicles
- 314 vehicles
- 45+ vehicles

- Cars and other vehicles available in Beecher in renter-occupied apartments
- 22no vehicle
- 2541 vehicle
- 532 vehicles
- 603 vehicles
- 04 vehicles
- 05+ vehicles

- Rooms in owner-occupied houses in Beecher, Illinois
- 01 room
- 02 rooms
- 03 rooms
- 1184 rooms
- 2245 rooms
- 4226 rooms
- 2677 rooms
- 2368 rooms
- 1789+ rooms

- Rooms in renter-occupied apartments in Beecher, Illinois
- 01 room
- 02 rooms
- 783 rooms
- 1234 rooms
- 955 rooms
- 776 rooms
- 07 rooms
- 08 rooms
- 189+ rooms


Beecher, IL household income distribution

- 20Less than $10,000
- 97$10,000 to $19,999
- 78$20,000 to $29,999
- 75$30,000 to $39,999
- 169$40,000 to $49,999
- 162$50,000 to $59,999
- 141$60,000 to $74,999
- 334$75,000 to $99,999
- 275$100,000 to $124,999
- 184$125,000 to $149,999
- 214$150,000 to $199,999
- 117$200,000 or more
Home value of owner - occupied houses in 2022 in Beecher, IL
-
- 32Less than $10,000
- 42$100,000 to $124,999
- 16$125,000 to $149,999
- 180$150,000 to $174,999
- 173$175,000 to $199,999
- 359$200,000 to $249,999
- 242$250,000 to $299,999
- 306$300,000 to $399,999
- 5$1,000,000 to $1,499,999
Rent paid by renters in 2022 in Beecher, IL
-
- 22$100 to $149
- 38$150 to $199
- 10$500 to $549
- 104$600 to $649
- 23$650 to $699
- 44$750 to $799
- 18$800 to $899
- 72$900 to $999
- 19$1,000 to $1,249
- 17$1,250 to $1,499
- 17$1,500 to $1,999
- 19$2,000 to $2,499


Percentage of workers working in this county: 53.4%
Number of people working at home: 219 (9.3% of all workers)
Travel time to work (commute)
- Less than 5 minutes: 125
- 5 to 9 minutes: 235
- 10 to 14 minutes: 165
- 15 to 19 minutes: 100
- 20 to 24 minutes: 339
- 25 to 29 minutes: 189
- 30 to 34 minutes: 220
- 35 to 39 minutes: 155
- 40 to 44 minutes: 94
- 45 to 59 minutes: 140
- 60 to 89 minutes: 161
- 90 or more minutes: 116
Means of transportation to work:
- Drove a car alone: 839 (71.9%)
- Carpooled: 70 (6.0%)
- Bus: 7 (0.6%)
- Taxi: 38 (3.3%)
- Worked at home: 219 (18.8%)

- Unemployment by race in 2022
- Unemployment rate for White non-Hispanic residents
- 1.5%Males
- Unemployment rate for Hispanic or Latino residents
- 3.5%Males

- Year of entry for the foreign-born population in Beecher, Illinois
- 02010 or later
- 02000 to 2009
- 01990 to 1999
- 41980 to 1989
- 91970 to 1979
- 36Before 1970

First ancestries reported:
- Polish: 408 (21.4%)
- German: 353 (18.5%)
- Irish: 191 (10.0%)
- Italian: 123 (6.4%)
- American: 111 (5.8%)
- Dutch: 98 (5.1%)
- English: 83 (4.3%)
- Scottish: 47 (2.5%)
- French: 37 (1.9%)
- Scotch-Irish: 26 (1.4%)
- Croatian: 13 (0.7%)
- Finnish: 13 (0.7%)
- Swedish: 5 (0.3%)
- African: 4 (0.2%)
Most common places of birth for foreign-born residents (%):
| Beecher: | 68.2% (15) |
| Illinois: | 4.1% (74,364) |
| Beecher: | 22.7% (5) |
| Illinois: | 1.1% (19,306) |
Place of birth for U.S.-born residents:
- This state: 3,614
- Other state: 860
- Northeast: 58
- Midwest: 689
- South: 54
- West: 5
88.9% of Beecher residents lived in the same house 1 years ago.
Out of people who lived in different houses, 37.9% lived in this county.
Out of people who lived in different counties, 76.7% lived in Illinois.
| Beecher: | 88.9% |
| State average: | 88.3% |
Education attainment for males 25 years and older:
- No schooling: 0
- Nursery to 4th grade: 0
- 5th and 6th grade: 0
- 7th and 8th grade: 61
- 9th grade: 12
- 10th grade: 5
- 11th grade: 0
- 12th grade, no diploma: 18
- High school graduate (or equivalency): 692
- Less than 1 year of college: 70
- Some college more than 1 year, no degree: 247
- Associate degree: 176
- Bachelor's degree: 199
- Master's degree: 117
- Professional school degree: 0
- Doctorate degree: 0

Education attainment for females 25 years and older:
- No schooling: 27
- Nursery to 4th grade: 0
- 5th and 6th grade: 22
- 7th and 8th grade: 0
- 9th grade: 0
- 10th grade: 8
- 11th grade: 19
- 12th grade, no diploma: 18
- High school graduate (or equivalency): 523
- Less than 1 year of college: 95
- Some college more than 1 year, no degree: 217
- Associate degree: 207
- Bachelor's degree: 215
- Master's degree: 83
- Professional school degree: 25
- Doctorate degree: 0


Housing units in structures:
- One, detached: 1,440
- One, attached: 274
- Two: 19
- 3 or 4: 111
- 5 to 9: 8
- 10 to 19: 49
- 20 to 49: 36
Housing units lacking complete kitchen facilities in 2022: 4.4%
House/condo owner moved in on average 12 years ago
Renter moved in on average 1 years ago

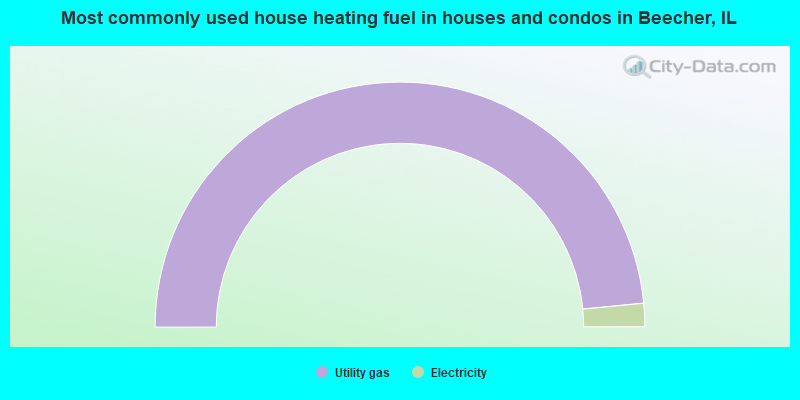
- 96.9%Utility gas
- 3.1%Electricity
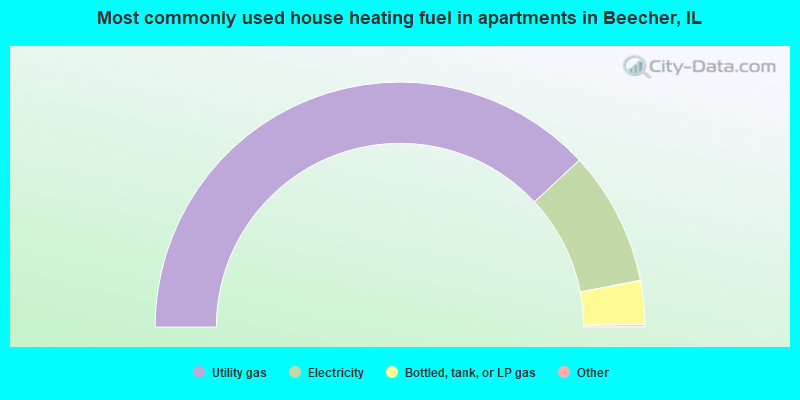
- 76.4%Utility gas
- 17.8%Electricity
- 5.8%Bottled, tank, or LP gas
Private vs. public school enrollment:
| Here: | 25.1% |
| Illinois: | 13.3% |
| Here: | 12.6% |
| Illinois: | 9.9% |
| Here: | 43.6% |
| Illinois: | 27.4% |


