Housing density: 195 houses/condos per square mile
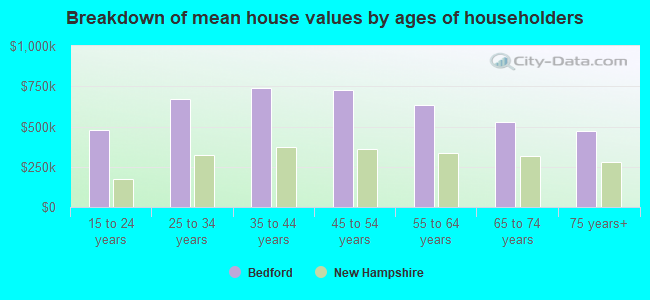
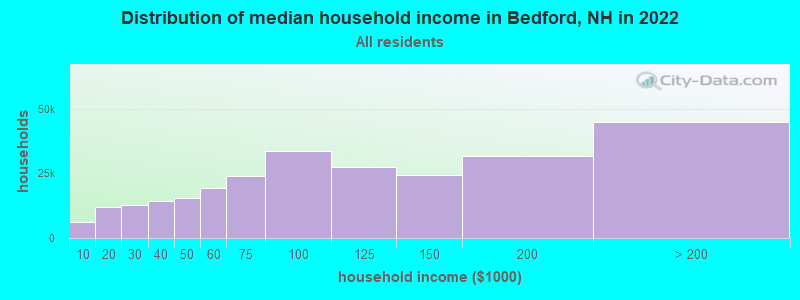
Median price asked for vacant for-sale houses and condos in 2022 in this county: $219,786.
Median contract rent in 2022: over $2,000 (lower quartile is $1,832, upper quartile is over $2,000)
Median rent asked for vacant for-rent units in 2022: $2,045
Median gross rent in Bedford, NH in 2022: over $2,000
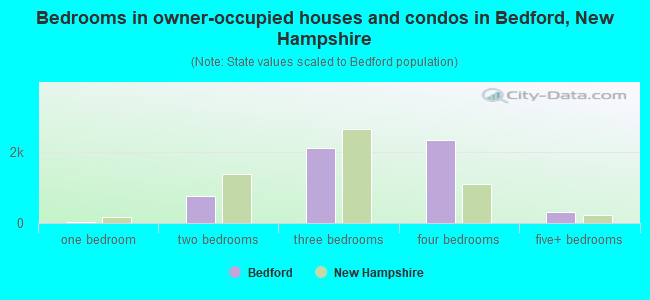
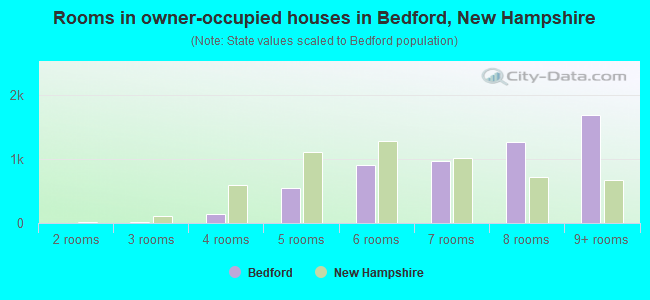
Housing units in Bedford with a mortgage: 4,103 (306 second mortgage, 673 home equity loan, 31 both second mortgage and home equity loan) Houses without a mortgage: 1,075
In family households: 326,724 (73,081 male householders, 30,878 female householders)
80,219 spouses, 116,046 children (108,604 natural, 2,355 adopted, 5,087 stepchildren), 5,202 grandchildren, 2,916 brothers or sisters, 3,400 parents, foster children, 2,901 other relatives, 9,588 non-relatives
In nonfamily households: 66,238 (25,502 male householders (18,551 living alone)), 26,005 female householders (20,836 living alone)), 14,731 nonrelatives
In group quarters: 7,759 (3,560 institutionalized population)
74,304 married couples with children.
19,641 single-parent households (5,030 men, 14,611 women).
91.4% of residents of Bedford speak English at home.
0.8% of residents speak Spanish at home (29% speak English very well, 20% speak English well, 52% speak English not well).
7.3% of residents speak other Indo-European language at home (70% speak English very well, 23% speak English well, 7% speak English not well).
0.3% of residents speak Asian or Pacific Island language at home (100% speak English very well).
0.2% of residents speak other language at home (75% speak English very well, 25% speak English well).
Foreign born population: 1,027 (5.0%)
(85.3% of them are naturalized citizens)
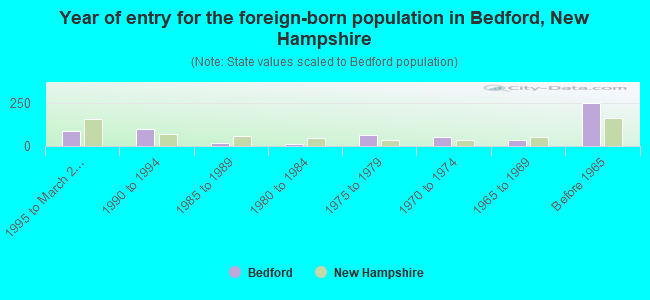
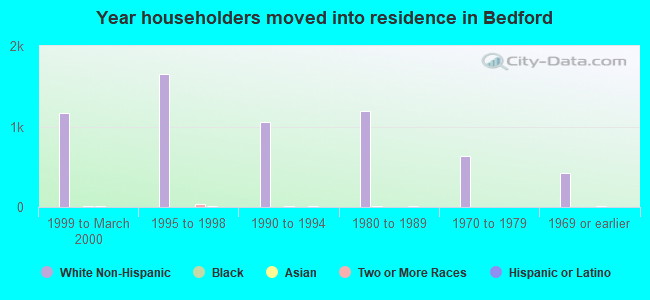
Year of entry for the foreign-born population in Bedford, New Hampshire
861995 to March 2000
961990 to 1994
191985 to 1989
111980 to 1984
641975 to 1979
541970 to 1974
351965 to 1969
246Before 1965
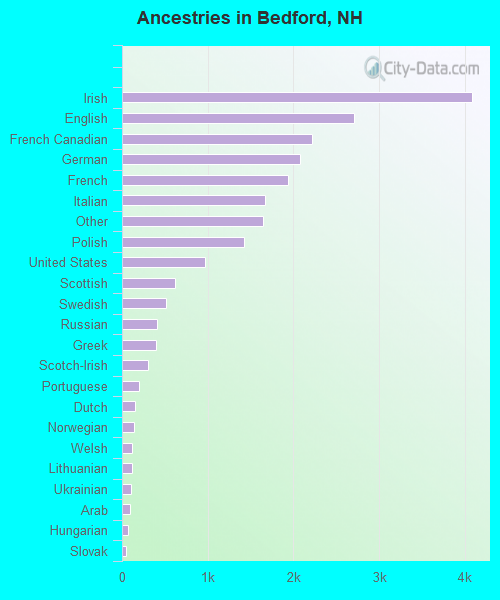
First ancestries reported:
Irish: 4,077 (18.5%)
English: 2,709 (12.3%)
French Canadian: 2,222 (10.1%)
German: 2,074 (9.4%)
French: 1,936 (8.8%)
Italian: 1,670 (7.6%)
Other: 1,647 (7.5%)
Polish: 1,419 (6.4%)
United States: 969 (4.4%)
Scottish: 615 (2.8%)
Swedish: 516 (2.3%)
Russian: 403 (1.8%)
Greek: 399 (1.8%)
Scotch-Irish: 299 (1.4%)
Portuguese: 194 (0.9%)
Dutch: 151 (0.7%)
Norwegian: 138 (0.6%)
Welsh: 113 (0.5%)
Lithuanian: 112 (0.5%)
Ukrainian: 104 (0.5%)
Arab: 88 (0.4%)
Hungarian: 66 (0.3%)
Slovak: 51 (0.2%)
Subsaharan African: 30 (0.1%)
Czech: 28 (0.1%)
Danish: 27 (0.1%)
West Indian: 11 (0.05%)
Swiss: 10 (0.05%)
Most common places of birth for foreign-born residents (%):
Canada
Bedford:
34.2% (209)
New Hampshire:
22.9% (12,397)
United Kingdom
Bedford:
14.4% (88)
New Hampshire:
8.1% (4,396)
China, excluding Hong Kong and Taiwan
Bedford:
5.4% (33)
New Hampshire:
3.4% (1,828)
Greece
Bedford:
5.1% (31)
New Hampshire:
2.3% (1,261)
Germany
Bedford:
4.3% (26)
New Hampshire:
4.9% (2,670)
Turkey
Bedford:
4.1% (25)
New Hampshire:
0.4% (203)
Ireland
Bedford:
3.8% (23)
New Hampshire:
1.5% (837)
Australia
Bedford:
2.6% (16)
New Hampshire:
0.3% (158)
Portugal
Bedford:
2.5% (15)
New Hampshire:
1.5% (835)
Japan
Bedford:
2.5% (15)
New Hampshire:
1.3% (706)
Iran
Bedford:
2.5% (15)
New Hampshire:
0.6% (338)
Pakistan
Bedford:
2.0% (12)
New Hampshire:
0.6% (322)
South Africa
Bedford:
2.0% (12)
New Hampshire:
0.3% (171)
Other Southern Africa
Bedford:
2.0% (12)
New Hampshire:
0.0% (12)
Korea
Bedford:
1.8% (11)
New Hampshire:
2.9% (1,582)
Brazil
Bedford:
1.8% (11)
New Hampshire:
2.0% (1,103)
Place of birth for U.S.-born residents:
This state: 7,742
Other state: 9,758
Northeast: 7,214
Midwest: 1,198
South: 757
West: 589
57% of Bedford residents lived in the same house 5 years ago. Out of people who lived in different houses, 43% lived in this county. Out of people who lived in different counties, 25% lived in New Hampshire.
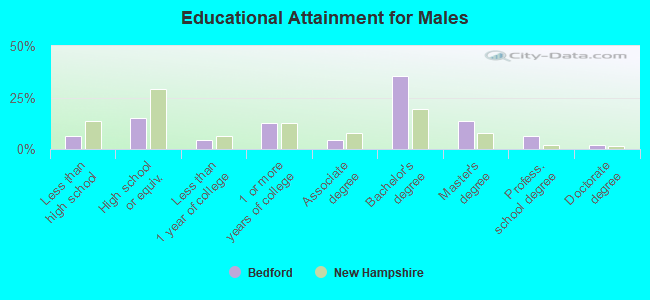
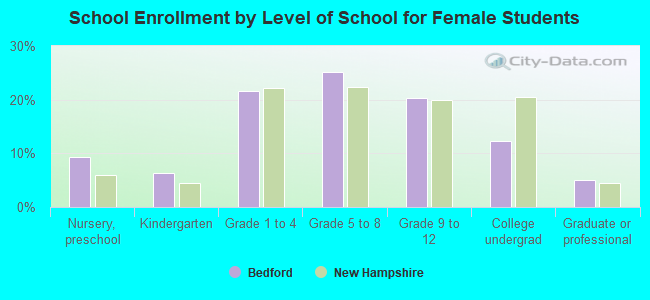
Education attainment for males 25 years and older:
No schooling: 46
Nursery to 4th grade: 0
5th and 6th grade: 39
7th and 8th grade: 106
9th grade: 26
10th grade: 55
11th grade: 22
12th grade, no diploma: 90
High school graduate (or equivalency): 882
Less than 1 year of college: 247
Some college more than 1 year, no degree: 757
Associate degree: 257
Bachelor's degree: 2,103
Master's degree: 815
Professional school degree: 387
Doctorate degree: 110
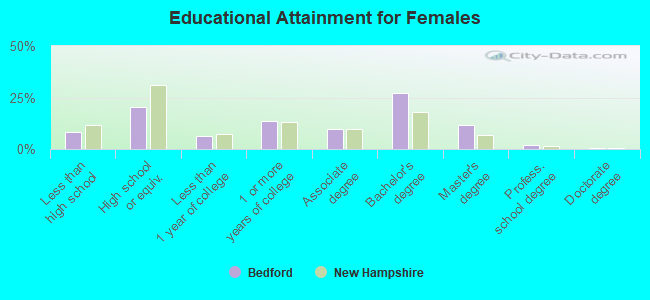
Education attainment for females 25 years and older:
No schooling: 29
Nursery to 4th grade: 0
5th and 6th grade: 28
7th and 8th grade: 170
9th grade: 79
10th grade: 49
11th grade: 62
12th grade, no diploma: 116
High school graduate (or equivalency): 1,312
Less than 1 year of college: 403
Some college more than 1 year, no degree: 855
Associate degree: 626
Bachelor's degree: 1,745
Master's degree: 759
Professional school degree: 138
Doctorate degree: 28
Housing units in structures:
One, detached: 5,328
One, attached: 368
Two: 43
3 or 4: 37
5 to 9: 77
10 to 19: 129
20 to 49: 380
50 or more: 31
Boats, RVs, vans, etc.: 8
Housing units lacking complete plumbing facilities: 0.1%
Housing units lacking complete kitchen facilities: 0.2%