Beaver Dam, KY (Kentucky) Houses and Residents
| Beaver Dam: | $164,138 |
| Kentucky: | $196,300 |
Mean price in 2022:
Detached houses: $157,065
Here: $157,065 State: $256,452
Total population: 3,541 (Urban population: 3,019 (all inside urban clusters), Rural population: 8 (all nonfarm))
Houses: 1,602 (1,490 occupied: 871 owner occupied, 650 renter occupied)
| % of renters here: | 43% |
| State: | 31% |
Housing density: 634 houses/condos per square mile
Median price asked for vacant for-sale houses and condos in 2022 in this county: $103,862.
Median contract rent in 2022: $503 (lower quartile is $367, upper quartile is $543)
Median rent asked for vacant for-rent units in 2022: $1,032
Median gross rent in Beaver Dam, KY in 2022: $638
Housing units in Beaver Dam with a mortgage: 380 (55 second mortgage, 0 home equity loan, 51 both second mortgage and home equity loan)
Houses without a mortgage: 24
Median household income for houses/condos with a mortgage: $56,131
Median household income for apartments without a mortgage: $48,687
Median monthly housing costs: $620
Compare current foreclosures near Beaver Dam, KY:
| Photo | Address | Area | Beds / Baths | Price | Details |
|---|---|---|---|---|---|

|
#1
Burge Ln
Beaver Dam, KY 42320
|
- sq. feet
|
- baths - beds |
show details | |

|
#2
Gary Neal Rd
Beaver Dam, KY 42320
|
- sq. feet
|
- baths - beds |
show details | |

|
#3
Rochester Rd
Beaver Dam, KY 42320
|
- sq. feet
|
- baths - beds |
show details | |

|
#4
N Main St
Beaver Dam, KY 42320
|
- sq. feet
|
- baths - beds |
show details | |

|
#5
Bruce School Rd
Beaver Dam, KY 42320
|
- sq. feet
|
- baths - beds |
show details | |

|
#6
Bethel Church Rd
Beaver Dam, KY 42320
|
- sq. feet
|
- baths - beds |
show details | |

|
#7
Embry Heights Dr
Beaver Dam, KY 42320
|
- sq. feet
|
- baths - beds |
show details | |

|
#8
Barnard Ct
Beaver Dam, KY 42320
|
- sq. feet
|
- baths - beds |
show details | |

|
#9
Jesse Small Ln
Beaver Dam, KY 42320
|
- sq. feet
|
- baths - beds |
show details | |

|
#10
Kentucky 269
Beaver Dam, KY 42320
|
- sq. feet
|
- baths - beds |
show details |
| Photo | Address | Area | Beds / Baths | Price | Details |
|---|---|---|---|---|---|

|
#11
Lee Dr
Beaver Dam, KY 42320
|
- sq. feet
|
- baths - beds |
show details | |

|
#12
W 1st St
Beaver Dam, KY 42320
|
- sq. feet
|
- baths - beds |
show details | |

|
#13
Render Rd
Beaver Dam, KY 42320
|
- sq. feet
|
- baths - beds |
show details | |

|
#14
Hope St
Beaver Dam, KY 42320
|
- sq. feet
|
- baths - beds |
show details | |

|
#15
Echols Church Ln
Beaver Dam, KY 42320
|
- sq. feet
|
- baths - beds |
show details | |

|
#16
R E Hopper Ln
Beaver Dam, KY 42320
|
- sq. feet
|
- baths - beds |
show details | |

|
#17
Highland Dr
Beaver Dam, KY 42320
|
- sq. feet
|
- baths - beds |
show details | |

|
#18
Terrace Dr
Beaver Dam, KY 42320
|
- sq. feet
|
- baths - beds |
show details | |

|
#19
Hope St
Beaver Dam, KY 42320
|
- sq. feet
|
- baths - beds |
show details | |

|
#20
W 4th St
Beaver Dam, KY 42320
|
- sq. feet
|
- baths - beds |
show details |
| Photo | Address | Area | Beds / Baths | Price | Details |
|---|---|---|---|---|---|

|
#21
Twin Hills Dr
Beaver Dam, KY 42320
|
- sq. feet
|
- baths - beds |
show details | |

|
#22
W Everly Brothers Blvd
Central City, KY 42330
|
1,453 sq. feet
|
2 baths 3 beds |
show details | |

|
#23
Us Highway 62 W
Rockport, KY 42369
|
1,225 sq. feet
|
1 baths 3 beds |
show details | |

|
#24
Caneyville Rd
Morgantown, KY 42261
|
960 sq. feet
|
1 baths 3 beds |
show details | |

|
#25
S Tyler St
Morgantown, KY 42261
|
980 sq. feet
|
1 baths 2 beds |
show details | |

|
#26
Logansport Rd
Morgantown, KY 42261
|
1,566 sq. feet
|
1 baths 3 beds |
show details | |

|
#27
Brownsville Rd
Morgantown, KY 42261
|
2,096 sq. feet
|
2 baths 3 beds |
show details | |

|
#28
Sycamore Dr
Livermore, KY 42352
|
2,376 sq. feet
|
2 baths 3 beds |
show details | |

|
#29
Brownsville Rd
Morgantown, KY 42261
|
1,232 sq. feet
|
2 baths 4 beds |
show details | |

|
#30
Sunset Loop
Morgantown, KY 42261
|
1,008 sq. feet
|
1 baths 3 beds |
show details |
| Photo | Address | Area | Beds / Baths | Price | Details |
|---|---|---|---|---|---|

|
#31
Greenbriar Rd
Utica, KY 42376
|
2,476 sq. feet
|
2 baths 3 beds |
show details | |

|
#32
Kentucky 1414
Whitesville, KY 42378
|
- sq. feet
|
- baths - beds |
show details | |

|
#33
Wilhite Ln
Utica, KY 42376
|
- sq. feet
|
- baths - beds |
show details | |

|
#34
Neafus Rd
Morgantown, KY 42261
|
- sq. feet
|
- baths - beds |
show details | |

|
#35
W Roberts St
Morgantown, KY 42261
|
- sq. feet
|
- baths - beds |
show details | |

|
#36
Greenbriar Rd
Utica, KY 42376
|
- sq. feet
|
- baths - beds |
show details | |

|
#37
Jim Embry Dr # 2
Morgantown, KY 42261
|
- sq. feet
|
- baths - beds |
show details | |

|
#38
Reynolds St
Central City, KY 42330
|
924 sq. feet
|
- baths - beds |
show details | |

|
#39
Phelps Coots Rd
Morgantown, KY 42261
|
- sq. feet
|
- baths - beds |
show details | |

|
#40
N 2nd St
Central City, KY 42330
|
- sq. feet
|
- baths - beds |
show details |
| Photo | Address | Area | Beds / Baths | Price | Details |
|---|---|---|---|---|---|

|
#41
Smith Hill Dr
Morgantown, KY 42261
|
- sq. feet
|
- baths - beds |
show details | |

|
#42
E Harmons Ferry Rd
Utica, KY 42376
|
1,680 sq. feet
|
- baths - beds |
show details | |

|
#43
Phillip Stone Way Lot 53
Central City, KY 42330
|
- sq. feet
|
- baths - beds |
show details | |

|
#44
Obannon Ln
Central City, KY 42330
|
- sq. feet
|
- baths - beds |
show details | |

|
#45
Oak Ridge Rd
Morgantown, KY 42261
|
- sq. feet
|
- baths - beds |
show details | |

|
#46
Jim Embry Dr # 5
Morgantown, KY 42261
|
- sq. feet
|
- baths - beds |
show details | |

|
#47
Olaton Rd
Olaton, KY 42361
|
- sq. feet
|
- baths - beds |
show details | |

|
#48
State Route 919
Fordsville, KY 42343
|
- sq. feet
|
- baths - beds |
show details | |

|
#49
W Mose Rager Blvd
Drakesboro, KY 42337
|
- sq. feet
|
- baths - beds |
show details | |

|
Check over 1 million property listings on Foreclosure.com!
|
browse all offers | |||


 | Planning to move to Beaver Dam (6 replies) |
| snow???? Really? (28 replies) |
| Driving through Kentucky via 231 (15 replies) |
| Military Retirement in Kentucky (13 replies) |
| Beaver Dam (4 replies) |

Median year apartment built: 1972
Household type by relationship:
Households: 3,542- Male householders: 973 (145 living alone), Female householders: 502 (120 living alone)
744 spouses (744 opposite-sex spouses), 167 unmarried partners, (150 opposite-sex unmarried partners), 920 children (886 natural, 17 adopted, 17 stepchildren), 160 grandchildren, 12 brothers or sisters, 23 parents, 0 foster children, 0 other relatives, 39 non-relatives
Size of family households: 514 2-persons, 263 3-persons, 134 4-persons, 85 5-persons.
Size of nonfamily households: 280 1-person, 242 2-persons.
221 married couples with children.
319 single-parent households (150 men, 169 women).
89.8% of residents of Beaver Dam speak English at home.
10.1% of residents speak Spanish at home (19% speak English very well, 52% speak English not well, 29% don't speak English at all).
0.5% of residents speak Asian or Pacific Island language at home (100% speak English well).
Foreign born population: 309 (8.7%)
(3.9% of them are naturalized citizens)
| Here: | 6.9 |
| State: | 6.4 |
| Here: | 4.2 |
| State: | 4.4 |

- Bedrooms in owner-occupied houses and condos in Beaver Dam, Kentucky
- 9no bedroom
- 01 bedroom
- 1562 bedrooms
- 5143 bedrooms
- 1924 bedrooms
- 05+ bedrooms

- Bedrooms in renter-occupied apartments in Beaver Dam, Kentucky
- 0no bedroom
- 321 bedroom
- 5042 bedrooms
- 1143 bedrooms
- 04 bedrooms
- 05+ bedrooms

- Cars and other vehicles available in Beaver Dam in owner-occupied houses/condos
- 31no vehicle
- 2291 vehicle
- 3872 vehicles
- 763 vehicles
- 1434 vehicles
- 55+ vehicles

- Cars and other vehicles available in Beaver Dam in renter-occupied apartments
- 55no vehicle
- 4211 vehicle
- 1112 vehicles
- 03 vehicles
- 94 vehicles
- 555+ vehicles

- Rooms in owner-occupied houses in Beaver Dam, Kentucky
- 91 room
- 02 rooms
- 03 rooms
- 594 rooms
- 1095 rooms
- 1856 rooms
- 1887 rooms
- 1538 rooms
- 1689+ rooms

- Rooms in renter-occupied apartments in Beaver Dam, Kentucky
- 01 room
- 02 rooms
- 683 rooms
- 3944 rooms
- 1235 rooms
- 66 rooms
- 97 rooms
- 348 rooms
- 169+ rooms


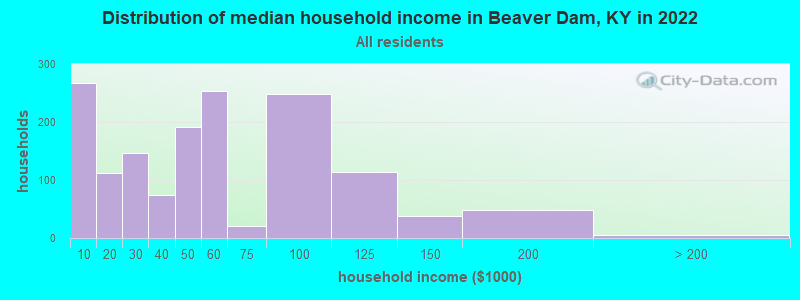
Beaver Dam, KY household income distribution

- 267Less than $10,000
- 112$10,000 to $19,999
- 147$20,000 to $29,999
- 74$30,000 to $39,999
- 191$40,000 to $49,999
- 254$50,000 to $59,999
- 20$60,000 to $74,999
- 248$75,000 to $99,999
- 114$100,000 to $124,999
- 38$125,000 to $149,999
- 49$150,000 to $199,999
- 6$200,000 or more
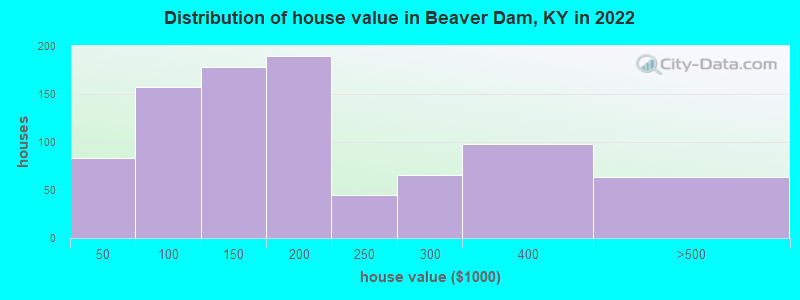
Home value of owner - occupied houses in 2022 in Beaver Dam, KY
-
- 11$15,000 to $19,999
- 49$25,000 to $29,999
- 22$40,000 to $49,999
- 81$70,000 to $79,999
- 36$80,000 to $89,999
- 17$90,000 to $99,999
- 116$100,000 to $124,999
- 61$125,000 to $149,999
- 124$150,000 to $174,999
- 66$175,000 to $199,999
- 44$200,000 to $249,999
- 66$250,000 to $299,999
- 98$300,000 to $399,999
- 63$400,000 to $499,999
Rent paid by renters in 2022 in Beaver Dam, KY
-
- 12Less than $100
- 67$150 to $199
- 42$250 to $299
- 18$300 to $349
- 41$350 to $399
- 85$450 to $499
- 287$500 to $549
- 48$650 to $699
- 50$700 to $749


Percentage of workers working in this county: 66.7%
Number of people working at home: 55 (4.5% of all workers)
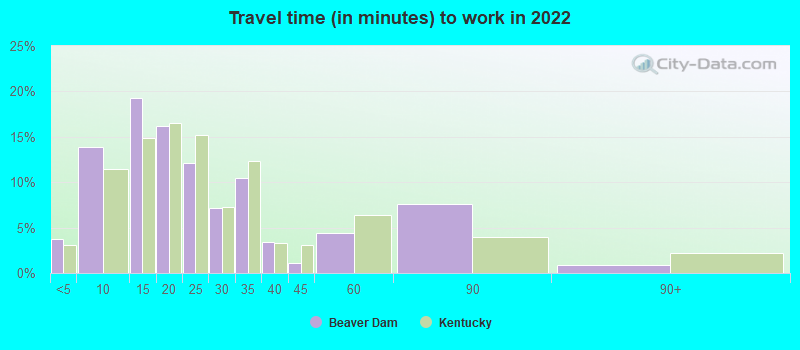
Travel time to work (commute)
- Less than 5 minutes: 79
- 5 to 9 minutes: 50
- 10 to 14 minutes: 237
- 15 to 19 minutes: 58
- 20 to 24 minutes: 11
- 25 to 29 minutes: 53
- 30 to 34 minutes: 187
- 35 to 39 minutes: 61
- 40 to 44 minutes: 105
- 45 to 59 minutes: 121
- 60 to 89 minutes: 173
- 90 or more minutes: 4
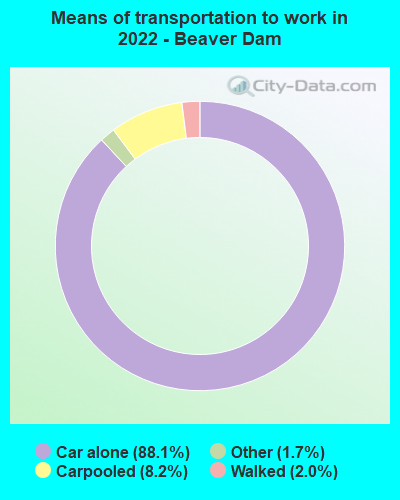
Means of transportation to work:
- Drove a car alone: 2,303 (83.7%)
- Carpooled: 237 (8.6%)
- Taxi: 53 (1.9%)
- Walked: 51 (1.9%)
- Worked at home: 55 (2.0%)

- Unemployment by race in 2022
- Unemployment rate for White non-Hispanic residents
- 9.8%Males
- 3.0%Females
- Unemployment rate for two or more race residents
- 54.4%Females

- Year of entry for the foreign-born population in Beaver Dam, Kentucky
- 842010 or later
- 1892000 to 2009
- 01990 to 1999
- 41980 to 1989
- 01970 to 1979
- 0Before 1970

First ancestries reported:
- American: 794 (37.0%)
- English: 447 (20.8%)
- German: 158 (7.4%)
- Irish: 119 (5.5%)
- European: 81 (3.8%)
- Dutch: 37 (1.7%)
- British: 28 (1.3%)
- African: 24 (1.1%)
- Italian: 15 (0.7%)
Most common places of birth for foreign-born residents (%):
| Beaver Dam: | 70.7% (227) |
| Kentucky: | 15.8% (29,070) |
| Beaver Dam: | 26.5% (85) |
| Kentucky: | 2.5% (4,639) |
| Beaver Dam: | 3.4% (11) |
| Kentucky: | 2.0% (3,654) |
Place of birth for U.S.-born residents:
- This state: 2,467
- Other state: 751
- Northeast: 63
- Midwest: 492
- South: 151
- West: 38
95.1% of Beaver Dam residents lived in the same house 1 years ago.
Out of people who lived in different houses, 43.9% lived in this county.
Out of people who lived in different counties, 100.0% lived in Kentucky.
| Beaver Dam: | 95.1% |
| State average: | 87.2% |
Education attainment for males 25 years and older:
- No schooling: 10
- Nursery to 4th grade: 0
- 5th and 6th grade: 148
- 7th and 8th grade: 0
- 9th grade: 42
- 10th grade: 31
- 11th grade: 0
- 12th grade, no diploma: 43
- High school graduate (or equivalency): 526
- Less than 1 year of college: 64
- Some college more than 1 year, no degree: 205
- Associate degree: 99
- Bachelor's degree: 79
- Master's degree: 112
- Professional school degree: 0
- Doctorate degree: 0

Education attainment for females 25 years and older:
- No schooling: 35
- Nursery to 4th grade: 0
- 5th and 6th grade: 64
- 7th and 8th grade: 12
- 9th grade: 12
- 10th grade: 0
- 11th grade: 32
- 12th grade, no diploma: 0
- High school graduate (or equivalency): 277
- Less than 1 year of college: 69
- Some college more than 1 year, no degree: 284
- Associate degree: 167
- Bachelor's degree: 29
- Master's degree: 187
- Professional school degree: 0
- Doctorate degree: 0


Housing units in structures:
- One, detached: 1,014
- One, attached: 17
- Two: 251
- 3 or 4: 245
- 5 to 9: 56
- 10 to 19: 8
- Mobile homes: 9
House/condo owner moved in on average 16 years ago
Renter moved in on average 1 years ago

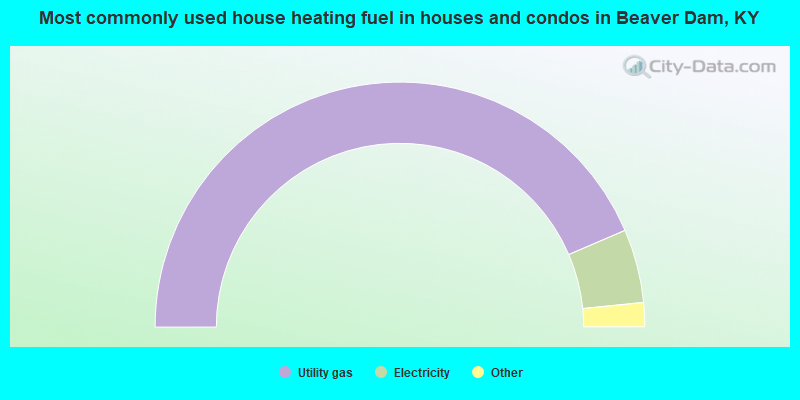
- 87.2%Utility gas
- 9.7%Electricity
- 1.9%Bottled, tank, or LP gas
- 1.2%Fuel oil, kerosene, etc.
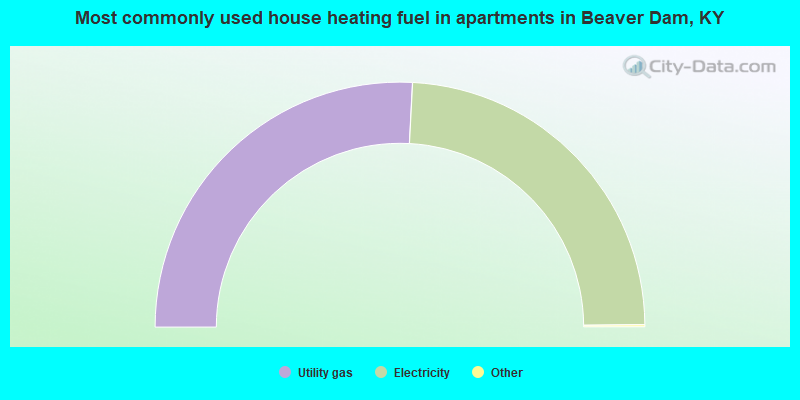
- 51.8%Utility gas
- 48.2%Electricity
Private vs. public school enrollment:
| Here: | 0.0% |
| Kentucky: | 17.2% |
| Here: | 24.1% |
| Kentucky: | 15.2% |
| Here: | 0.0% |
| Kentucky: | 19.6% |


