Beaver Creek, OR (Oregon) Houses and Residents
| Beaver Creek: | $686,142 |
| Oregon: | $475,600 |
Total population: 7,848 (Urban population: 2,374, Rural population: 4,721 (435 farm, 4,286 nonfarm))
Houses: 2,496 (2,445 occupied: 2,232 owner occupied, 213 renter occupied)
| % of renters here: | 9% |
| State: | 37% |
Housing density: 88 houses/condos per square mile
Median price asked for vacant for-sale houses and condos in 2022 in this county: $788,071.
Median contract rent in 2022: $1,374 (lower quartile is $999, upper quartile is over $2,000)
Median rent asked for vacant for-rent units in 2022: $1,927
Median gross rent in Beaver Creek, OR in 2022: over $2,000
Housing units in Beaver Creek with a mortgage: 1,308 (291 second mortgage, 172 home equity loan, 25 both second mortgage and home equity loan)
Houses without a mortgage: 276
Compare current foreclosures near Beaver Creek, OR:
| Photo | Address | Area | Beds / Baths | Price | Details |
|---|---|---|---|---|---|

|
#1
SE Renada St
Portland, OR 97267
|
2,439 sq. feet
|
2 baths 3 beds |
$449,500
|
show details |

|
#2
SW 1st Ave Apt 2125
Portland, OR 97201
|
1,950 sq. feet
|
2 baths 3 beds |
$695,000
|
show details |

|
#3
SE 116th Ave
Portland, OR 97266
|
1,678 sq. feet
|
1 baths 4 beds |
$485,000
|
show details |

|
#4
SE Bush St
Portland, OR 97236
|
2,212 sq. feet
|
1 baths 3 beds |
show details | |

|
#5
SE 83rd Ave
Portland, OR 97216
|
1,510 sq. feet
|
1 baths 4 beds |
show details | |

|
#6
SE Regan Hill Loop
Estacada, OR 97023
|
1,619 sq. feet
|
2 baths 3 beds |
show details | |

|
#7
SW Fradeen Ln
Portland, OR 97225
|
4,684 sq. feet
|
4 baths 3 beds |
show details | |

|
#8
SE Wallace Rd
Portland, OR 97267
|
2,816 sq. feet
|
3 baths 3 beds |
show details | |

|
#9
SE Division St Unit 111
Portland, OR 97266
|
760 sq. feet
|
2 baths 2 beds |
show details | |

|
#10
SE 150th Ave
Portland, OR 97236
|
1,900 sq. feet
|
2 baths 4 beds |
show details |
| Photo | Address | Area | Beds / Baths | Price | Details |
|---|---|---|---|---|---|

|
#11
SW 126th Ave
Portland, OR 97224
|
3,896 sq. feet
|
2 baths 4 beds |
show details | |

|
#12
NE Davis St
Portland, OR 97230
|
1,651 sq. feet
|
2 baths 4 beds |
show details | |

|
#13
SE Woodstock Blvd
Portland, OR 97206
|
514 sq. feet
|
1 baths 1 beds |
show details | |

|
#14
SE Rachel Ln
Portland, OR 97236
|
1,384 sq. feet
|
2 baths 3 beds |
show details | |

|
#15
Waluga Dr
Lake Oswego, OR 97035
|
4,413 sq. feet
|
4 baths 4 beds |
show details | |

|
#16
SE Starr Rd # 224
Eagle Creek, OR 97022
|
1,692 sq. feet
|
2 baths 3 beds |
show details | |

|
#17
SW Wilbard St
Portland, OR 97219
|
1,400 sq. feet
|
2 baths 5 beds |
show details | |

|
#18
SE 76th Ave
Portland, OR 97206
|
1,504 sq. feet
|
1 baths 2 beds |
show details | |

|
#19
SE Franklin St
Portland, OR 97236
|
1,618 sq. feet
|
2 baths 3 beds |
show details | |

|
#20
SE Rainbow Ln
Portland, OR 97222
|
1,496 sq. feet
|
2 baths 4 beds |
show details |
| Photo | Address | Area | Beds / Baths | Price | Details |
|---|---|---|---|---|---|

|
#21
SE 148th Ave
Portland, OR 97233
|
886 sq. feet
|
1 baths 2 beds |
show details | |

|
#22
SW Courtside Dr Apt 26
Wilsonville, OR 97070
|
- sq. feet
|
1 baths 1 beds |
show details | |

|
#23
SE Bari Ave
Happy Valley, OR 97086
|
5,971 sq. feet
|
3 baths 4 beds |
show details | |

|
#24
SW Meadow St
Portland, OR 97223
|
- sq. feet
|
1 baths 3 beds |
show details | |

|
#25
SE Carlton St
Portland, OR 97206
|
1,488 sq. feet
|
1 baths 4 beds |
show details | |

|
#26
SE Old Barn Ln
Damascus, OR 97089
|
3,744 sq. feet
|
3 baths 4 beds |
show details | |

|
#27
SE Brandeis St
Clackamas, OR 97015
|
1,056 sq. feet
|
1 baths 3 beds |
show details | |

|
#28
NE 113th Ave
Portland, OR 97220
|
1,118 sq. feet
|
2 baths 3 beds |
show details | |

|
#29
NE 149th Pl
Portland, OR 97230
|
1,524 sq. feet
|
3 baths 3 beds |
show details | |

|
#30
S Acer Ln
Molalla, OR 97038
|
1,056 sq. feet
|
1 baths 3 beds |
show details |
| Photo | Address | Area | Beds / Baths | Price | Details |
|---|---|---|---|---|---|

|
#31
NE 141st Ave
Portland, OR 97230
|
1,700 sq. feet
|
2 baths 3 beds |
show details | |

|
#32
Kenwood Rd
Lake Oswego, OR 97034
|
1,978 sq. feet
|
2 baths 3 beds |
show details | |

|
#33
SW Winterview Dr
Portland, OR 97224
|
2,585 sq. feet
|
2 baths 5 beds |
show details | |

|
#34
SE Forest Glen Rd
Estacada, OR 97023
|
2,268 sq. feet
|
2 baths 3 beds |
show details | |

|
#35
NW 14th Pl
Gresham, OR 97030
|
1,260 sq. feet
|
1 baths 3 beds |
show details | |

|
#36
NE Westview Ln
Estacada, OR 97023
|
2,900 sq. feet
|
3 baths 4 beds |
show details | |

|
#37
SE 68th Ave
Portland, OR 97206
|
1,490 sq. feet
|
1 baths 2 beds |
show details | |

|
#38
SE Lee Ln
Portland, OR 97233
|
1,288 sq. feet
|
1 baths 3 beds |
show details | |

|
#39
SE 214th Ave
Gresham, OR 97030
|
1,294 sq. feet
|
2 baths 3 beds |
show details | |

|
#40
SE Liebe St
Portland, OR 97266
|
606 sq. feet
|
1 baths 2 beds |
show details |
| Photo | Address | Area | Beds / Baths | Price | Details |
|---|---|---|---|---|---|

|
#41
Tupper Rd
Sandy, OR 97055
|
1,440 sq. feet
|
1 baths 3 beds |
show details | |

|
#42
Canal Cir
Lake Oswego, OR 97035
|
1,774 sq. feet
|
3 baths 3 beds |
show details | |

|
#43
SE Yamhill St
Portland, OR 97233
|
- sq. feet
|
2 baths 2 beds |
show details | |

|
#44
SE 86th Ave
Portland, OR 97266
|
1,033 sq. feet
|
1 baths 2 beds |
show details | |

|
#45
SE Talbert St
Clackamas, OR 97015
|
767 sq. feet
|
1 baths 1 beds |
show details | |

|
#46
SW Taylors Ferry Rd
Portland, OR 97223
|
2,776 sq. feet
|
2 baths 3 beds |
show details | |

|
#47
SE 73rd Ave
Portland, OR 97222
|
- sq. feet
|
1 baths 2 beds |
show details | |

|
#48
SE Kisor Ct
Happy Valley, OR 97086
|
2,218 sq. feet
|
2 baths 4 beds |
show details | |

|
#49
Balken Ave
Sandy, OR 97055
|
- sq. feet
|
3 baths 3 beds |
show details | |

|
Check over 1 million property listings on Foreclosure.com!
|
browse all offers | |||

Household type by relationship:
Households: 373,239- In family households: 315,893 (73,770 male householders, 27,096 female householders)
79,856 spouses, 107,451 children (98,993 natural, 3,285 adopted, 5,173 stepchildren), 6,228 grandchildren, 2,852 brothers or sisters, 2,991 parents, foster children, 3,486 other relatives, 9,508 non-relatives
- In nonfamily households: 57,346 (20,413 male householders (14,825 living alone)), 24,511 female householders (20,254 living alone)), 12,422 nonrelatives
- In group quarters: 2,753 (1,340 institutionalized population)
65,696 married couples with children.
15,935 single-parent households (4,341 men, 11,594 women).
95.8% of residents of Beaver Creek speak English at home.
2.5% of residents speak Spanish at home (78% speak English very well, 12% speak English well, 10% speak English not well).
1.3% of residents speak other Indo-European language at home (79% speak English very well, 21% speak English not well).
0.4% of residents speak Asian or Pacific Island language at home (54% speak English very well, 46% speak English well).
Foreign born population: 231 (2.6%)
(48.5% of them are naturalized citizens)
| Here: | 6.9 |
| State: | 6.2 |
| Here: | 6.1 |
| State: | 4.0 |

- Bedrooms in owner-occupied houses and condos in Beaver Creek, Oregon
- 8no bedroom
- 351 bedroom
- 2742 bedrooms
- 1,3603 bedrooms
- 4924 bedrooms
- 635+ bedrooms

- Bedrooms in renter-occupied apartments in Beaver Creek, Oregon
- 0no bedroom
- 01 bedroom
- 632 bedrooms
- 893 bedrooms
- 524 bedrooms
- 95+ bedrooms

- Cars and other vehicles available in Beaver Creek in owner-occupied houses/condos
- 40no vehicle
- 2201 vehicle
- 9792 vehicles
- 5923 vehicles
- 2514 vehicles
- 1505+ vehicles

- Cars and other vehicles available in Beaver Creek in renter-occupied apartments
- 0no vehicle
- 571 vehicle
- 852 vehicles
- 713 vehicles
- 04 vehicles
- 05+ vehicles

- Rooms in owner-occupied houses in Beaver Creek, Oregon
- 01 room
- 242 rooms
- 793 rooms
- 864 rooms
- 3375 rooms
- 5886 rooms
- 4887 rooms
- 2948 rooms
- 3369+ rooms

- Rooms in renter-occupied apartments in Beaver Creek, Oregon
- 01 room
- 02 rooms
- 03 rooms
- 364 rooms
- 425 rooms
- 456 rooms
- 447 rooms
- 388 rooms
- 89+ rooms


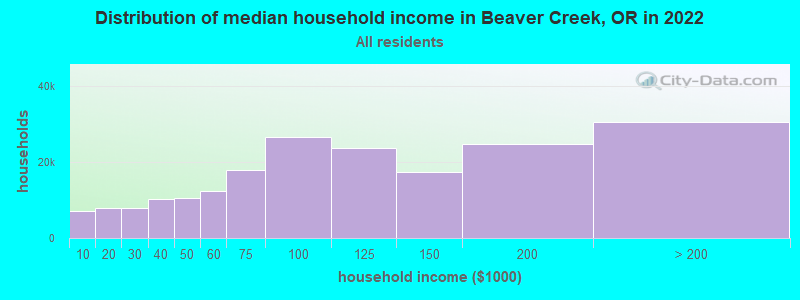
Beaver Creek, OR household income distribution

- 7,015Less than $10,000
- 7,892$10,000 to $19,999
- 7,896$20,000 to $29,999
- 10,167$30,000 to $39,999
- 10,512$40,000 to $49,999
- 12,436$50,000 to $59,999
- 17,764$60,000 to $74,999
- 26,432$75,000 to $99,999
- 23,608$100,000 to $124,999
- 17,316$125,000 to $149,999
- 24,628$150,000 to $199,999
- 30,436$200,000 or more
Percentage of workers working in this county: 70.3%
Number of people working at home: 1,053 (22.0% of all workers)
Travel time to work (commute)
- Less than 5 minutes: 96
- 5 to 9 minutes: 167
- 10 to 14 minutes: 430
- 15 to 19 minutes: 462
- 20 to 24 minutes: 396
- 25 to 29 minutes: 186
- 30 to 34 minutes: 690
- 35 to 39 minutes: 183
- 40 to 44 minutes: 340
- 45 to 59 minutes: 443
- 60 to 89 minutes: 177
- 90 or more minutes: 29
Means of transportation to work:
- Drove a car alone: 3,156 (83.4%)
- Carpooled: 354 (9.4%)
- Bus or trolley bus: 16 (0.4%)
- Motorcycle: 6 (0.2%)
- Bicycle: 11 (0.3%)
- Walked: 32 (0.8%)
- Other means: 24 (0.6%)
- Worked at home: 186 (4.9%)


- Year of entry for the foreign-born population in Beaver Creek, Oregon
- 141995 to March 2000
- 91990 to 1994
- 251985 to 1989
- 01980 to 1984
- 221975 to 1979
- 101970 to 1974
- 411965 to 1969
- 45Before 1965
Most common places of birth for foreign-born residents (%):
| Beaver Creek: | 22.3% (37) |
| Oregon: | 3.3% (9,473) |
| Beaver Creek: | 20.5% (34) |
| Oregon: | 39.0% (113,083) |
| Beaver Creek: | 10.8% (18) |
| Oregon: | 0.2% (595) |
| Beaver Creek: | 8.4% (14) |
| Oregon: | 0.3% (771) |
| Beaver Creek: | 7.8% (13) |
| Oregon: | 0.4% (1,059) |
| Beaver Creek: | 6.0% (10) |
| Oregon: | 0.6% (1,826) |
| Beaver Creek: | 6.0% (10) |
| Oregon: | 0.2% (662) |
| Beaver Creek: | 5.4% (9) |
| Oregon: | 5.9% (17,137) |
| Beaver Creek: | 4.8% (8) |
| Oregon: | 0.8% (2,299) |
| Beaver Creek: | 4.2% (7) |
| Oregon: | 3.0% (8,568) |
| Beaver Creek: | 3.6% (6) |
| Oregon: | 2.2% (6,351) |
Place of birth for U.S.-born residents:
- This state: 4,589
- Other state: 2,289
- Northeast: 59
- Midwest: 646
- South: 300
- West: 1,284
69% of Beaver Creek residents lived in the same house 5 years ago.
Out of people who lived in different houses, 61% lived in this county.
Out of people who lived in different counties, 70% lived in Oregon.
Education attainment for males 25 years and older:
- No schooling: 9
- Nursery to 4th grade: 0
- 5th and 6th grade: 21
- 7th and 8th grade: 29
- 9th grade: 25
- 10th grade: 38
- 11th grade: 62
- 12th grade, no diploma: 82
- High school graduate (or equivalency): 673
- Less than 1 year of college: 229
- Some college more than 1 year, no degree: 528
- Associate degree: 165
- Bachelor's degree: 316
- Master's degree: 103
- Professional school degree: 56
- Doctorate degree: 16

Education attainment for females 25 years and older:
- No schooling: 9
- Nursery to 4th grade: 0
- 5th and 6th grade: 0
- 7th and 8th grade: 10
- 9th grade: 35
- 10th grade: 48
- 11th grade: 52
- 12th grade, no diploma: 57
- High school graduate (or equivalency): 728
- Less than 1 year of college: 401
- Some college more than 1 year, no degree: 447
- Associate degree: 137
- Bachelor's degree: 301
- Master's degree: 119
- Professional school degree: 22
- Doctorate degree: 0


Housing units in structures:
- One, detached: 2,174
- Two: 22
- 5 to 9: 8
- Mobile homes: 292
Median worth of mobile homes: $405,177

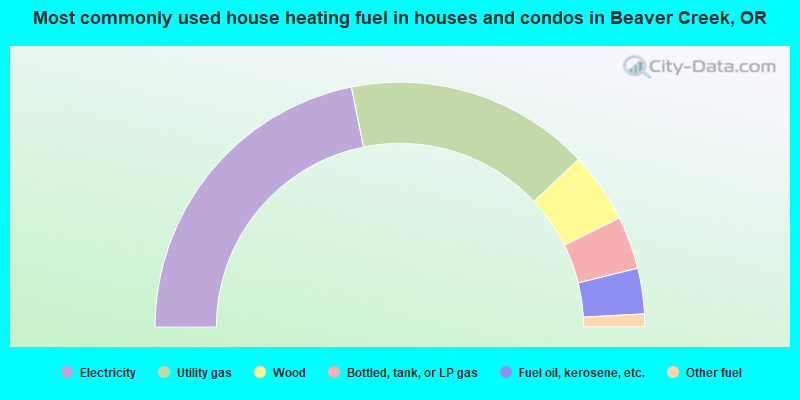
- 43.7%Electricity
- 32.4%Utility gas
- 9.3%Wood
- 7.0%Bottled, tank, or LP gas
- 6.0%Fuel oil, kerosene, etc.
- 1.7%Other fuel
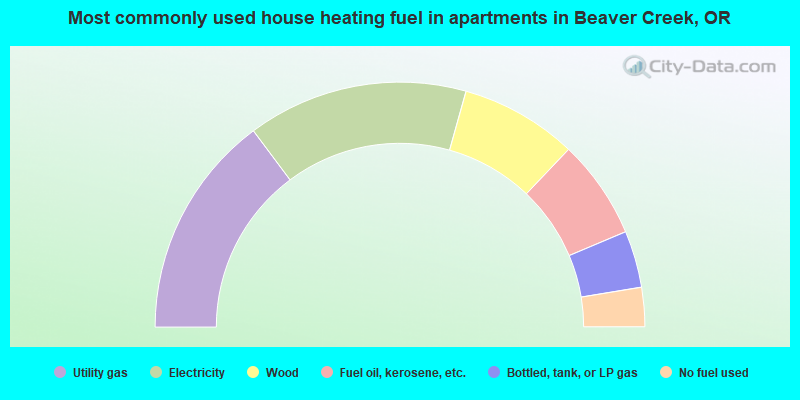
- 29.6%Utility gas
- 29.1%Electricity
- 15.5%Wood
- 13.1%Fuel oil, kerosene, etc.
- 7.5%Bottled, tank, or LP gas
- 5.2%No fuel used
Private vs. public school enrollment:
| Here: | 12.5% |
| Oregon: | 9.7% |
| Here: | 20.0% |
| Oregon: | 7.6% |
| Here: | 8.4% |
| Oregon: | 16.1% |


