Beaumont, CA (California) Houses and Residents
| Beaumont: | $513,646 |
| California: | $715,900 |
Total population: 42,277 (Urban population: 11,025, Rural population: 290 (all nonfarm))
Houses: 17,140 (16,662 occupied: 13,429 owner occupied, 3,344 renter occupied)
| % of renters here: | 20% |
| State: | 44% |
Housing density: 631 houses/condos per square mile
Median price asked for vacant for-sale houses and condos in 2022: $438,405.
Median contract rent in 2022: $1,259 (lower quartile is $867, upper quartile is $1,961)
Median rent asked for vacant for-rent units in 2022: $3,919
Median gross rent in Beaumont, CA in 2022: $1,480
Housing units in Beaumont with a mortgage: 10,381 (551 second mortgage, 28 home equity loan, 384 both second mortgage and home equity loan)
Houses without a mortgage: 156
Median household income for houses/condos with a mortgage: $119,570
Median household income for apartments without a mortgage: $72,673
Median monthly housing costs: $2,100
Compare current foreclosures in Beaumont, CA:
| Photo | Address | Area | Beds / Baths | Price | Details |
|---|---|---|---|---|---|

|
#1
Groveland St
Beaumont, CA 92223
|
- sq. feet
|
3 baths 4 beds |
show details | |

|
#2
Brookside Ln
Beaumont, CA 92223
|
2,494 sq. feet
|
2 baths 4 beds |
show details | |

|
#3
Brutus Way
Beaumont, CA 92223
|
3,396 sq. feet
|
2 baths 4 beds |
show details | |

|
#4
Plymouth Rock
Beaumont, CA 92223
|
2,243 sq. feet
|
2 baths 3 beds |
show details | |

|
#5
Pennsylvania Ave
Beaumont, CA 92223
|
1,192 sq. feet
|
2 baths 3 beds |
show details | |

|
#6
Playa St
Beaumont, CA 92223
|
1,758 sq. feet
|
2 baths 3 beds |
show details | |

|
#7
Tournament Way
Beaumont, CA 92223
|
2,657 sq. feet
|
3 baths 4 beds |
show details | |

|
#8
Gainesway Cir
Beaumont, CA 92223
|
2,382 sq. feet
|
2 baths 4 beds |
show details | |

|
#9
Demaret Dr
Beaumont, CA 92223
|
3,037 sq. feet
|
3 baths 4 beds |
show details | |

|
#10
Stadler St
Beaumont, CA 92223
|
3,823 sq. feet
|
2 baths 5 beds |
show details |
| Photo | Address | Area | Beds / Baths | Price | Details |
|---|---|---|---|---|---|

|
#11
Olympic St
Beaumont, CA 92223
|
2,145 sq. feet
|
3 baths 5 beds |
show details | |

|
#12
White Sands St
Beaumont, CA 92223
|
1,556 sq. feet
|
2 baths 2 beds |
show details | |

|
#13
Sagamore Cir
Beaumont, CA 92223
|
2,072 sq. feet
|
2 baths 4 beds |
show details | |

|
#14
Winter Pine St
Beaumont, CA 92223
|
2,844 sq. feet
|
3 baths 5 beds |
show details | |

|
#15
Gainsborough
Beaumont, CA 92223
|
1,868 sq. feet
|
2 baths 3 beds |
show details | |

|
#16
Donner Trl
Beaumont, CA 92223
|
1,988 sq. feet
|
2 baths 2 beds |
show details | |

|
#17
Sandpiper Dr
Beaumont, CA 92223
|
2,304 sq. feet
|
3 baths 4 beds |
show details | |

|
#18
W 9th Pl
Beaumont, CA 92223
|
1,120 sq. feet
|
2 baths 3 beds |
show details | |

|
#19
Leland St
Beaumont, CA 92223
|
2,419 sq. feet
|
3 baths 4 beds |
show details | |

|
#20
Massachusetts Ave
Beaumont, CA 92223
|
1,170 sq. feet
|
2 baths 4 beds |
show details |
| Photo | Address | Area | Beds / Baths | Price | Details |
|---|---|---|---|---|---|

|
#21
Big Sky Dr
Beaumont, CA 92223
|
3,079 sq. feet
|
3 baths 4 beds |
show details | |

|
#22
Hesse Rd
Beaumont, CA 92223
|
1,743 sq. feet
|
2 baths 3 beds |
show details | |

|
#23
Elm Ave
Beaumont, CA 92223
|
873 sq. feet
|
4 baths 3 beds |
show details | |

|
#24
Olympic St
Beaumont, CA 92223
|
2,952 sq. feet
|
3 baths 5 beds |
show details | |

|
#25
Desert Almond Way
Beaumont, CA 92223
|
2,127 sq. feet
|
2 baths 2 beds |
show details | |

|
#26
Meadow Crest Rd
Beaumont, CA 92223
|
2,616 sq. feet
|
3 baths 4 beds |
show details | |

|
#27
Brutus Way
Beaumont, CA 92223
|
3,396 sq. feet
|
2 baths 4 beds |
show details | |

|
#28
Beauview Dr
Beaumont, CA 92223
|
2,760 sq. feet
|
4 baths 5 beds |
show details | |

|
#29
E 11th St
Beaumont, CA 92223
|
1,825 sq. feet
|
2 baths 3 beds |
show details | |

|
#30
Chestnut Ave
Beaumont, CA 92223
|
1,404 sq. feet
|
2 baths 2 beds |
show details |
| Photo | Address | Area | Beds / Baths | Price | Details |
|---|---|---|---|---|---|

|
#31
Torrey Pines Dr
Beaumont, CA 92223
|
2,705 sq. feet
|
2 baths 4 beds |
show details | |

|
#32
Plymouth Rock
Beaumont, CA 92223
|
2,792 sq. feet
|
3 baths 3 beds |
show details | |

|
#33
Ravenswood Rd
Beaumont, CA 92223
|
1,615 sq. feet
|
2 baths 3 beds |
show details | |

|
#34
Elm Ave
Beaumont, CA 92223
|
873 sq. feet
|
4 baths 3 beds |
show details | |

|
#35
Wellwood Ave
Beaumont, CA 92223
|
1,255 sq. feet
|
2 baths 3 beds |
show details | |

|
#36
Riviera Ct
Beaumont, CA 92223
|
1,687 sq. feet
|
2 baths 2 beds |
show details | |

|
#37
Frontier Trl
Beaumont, CA 92223
|
1,344 sq. feet
|
2 baths 2 beds |
show details | |

|
#38
Cypress Point Dr
Beaumont, CA 92223
|
1,606 sq. feet
|
2 baths 2 beds |
show details | |

|
#39
Le Conte Dr
Beaumont, CA 92223
|
- sq. feet
|
- baths - beds |
show details | |

|
#40
Bannock St
Beaumont, CA 92223
|
- sq. feet
|
- baths - beds |
show details |
| Photo | Address | Area | Beds / Baths | Price | Details |
|---|---|---|---|---|---|

|
#41
Marble Way
Beaumont, CA 92223
|
- sq. feet
|
- baths - beds |
show details | |

|
#42
Tioga Trl
Beaumont, CA 92223
|
- sq. feet
|
- baths - beds |
show details | |

|
#43
Beryl Ct
Beaumont, CA 92223
|
- sq. feet
|
- baths - beds |
show details | |

|
#44
Allegheny St Unit 27
Beaumont, CA 92223
|
- sq. feet
|
- baths - beds |
show details | |

|
#45
Amici Pl
Beaumont, CA 92223
|
- sq. feet
|
- baths - beds |
show details | |

|
#46
Versimo Ln
Beaumont, CA 92223
|
- sq. feet
|
- baths - beds |
show details | |

|
#47
Mulligan Dr
Beaumont, CA 92223
|
- sq. feet
|
- baths - beds |
show details | |

|
#48
Winged Foot Rd
Beaumont, CA 92223
|
- sq. feet
|
- baths - beds |
show details | |

|
#49
Potter Crk
Beaumont, CA 92223
|
- sq. feet
|
- baths - beds |
show details | |

|
Check over 1 million property listings on Foreclosure.com!
|
browse all offers | |||

Latest news about housing in Beaumont, CA collected exclusively by city-data.com from local newspapers, TV, and radio stations

 | Difference in median household income - neighboring cities in Riverside/San Bernardino (0 replies) |
| San Diego Housing Market Downturn? (168 replies) |
| Pardee Homes Build Quality? (2 replies) |
| Love SoCal, Can't Afford a House Here, where to folks go? (232 replies) |
| The Great California Exodus Accelerates (1871 replies) |
| Housing market peaking? (60 replies) |

Median year apartment built: 1990
Household type by relationship:
Households: 54,522- Male householders: 8,311 (1,204 living alone), Female householders: 8,336 (1,591 living alone)
9,622 spouses (9,555 opposite-sex spouses), 1,198 unmarried partners, (1,163 opposite-sex unmarried partners), 20,359 children (19,264 natural, 374 adopted, 719 stepchildren), 1,134 grandchildren, 984 brothers or sisters, 1,344 parents, 185 foster children, 1,531 other relatives, 1,341 non-relatives
- In group quarters: 173
Size of family households: 4,112 2-persons, 2,810 3-persons, 2,911 4-persons, 1,997 5-persons, 715 6-persons, 739 7-or-more-persons.
Size of nonfamily households: 2,710 1-person, 458 2-persons, 213 3-persons, 81 4-persons, 14 5-persons.
10,159 married couples with children.
4,244 single-parent households (1,289 men, 2,955 women).
67.5% of residents of Beaumont speak English at home.
24.4% of residents speak Spanish at home (80% speak English very well, 12% speak English well, 6% speak English not well, 2% don't speak English at all).
1.9% of residents speak other Indo-European language at home (80% speak English very well, 15% speak English well, 5% speak English not well).
5.2% of residents speak Asian or Pacific Island language at home (50% speak English very well, 31% speak English well, 18% speak English not well, 1% don't speak English at all).
1.1% of residents speak other language at home (45% speak English very well, 39% speak English well, 14% speak English not well, 2% don't speak English at all).
Foreign born population: 9,194 (16.9%)
(67.9% of them are naturalized citizens)
| Here: | 6.2 |
| State: | 6.0 |
| Here: | 4.7 |
| State: | 3.9 |

- Bedrooms in owner-occupied houses and condos in Beaumont, California
- 81no bedroom
- 751 bedroom
- 2,6972 bedrooms
- 3,9463 bedrooms
- 5,4004 bedrooms
- 1,2305+ bedrooms

- Bedrooms in renter-occupied apartments in Beaumont, California
- 30no bedroom
- 5461 bedroom
- 1,1082 bedrooms
- 9133 bedrooms
- 5254 bedrooms
- 2235+ bedrooms

- Cars and other vehicles available in Beaumont in owner-occupied houses/condos
- 266no vehicle
- 2,6041 vehicle
- 5,8482 vehicles
- 3,1863 vehicles
- 1,0784 vehicles
- 4475+ vehicles

- Cars and other vehicles available in Beaumont in renter-occupied apartments
- 170no vehicle
- 1,4291 vehicle
- 9482 vehicles
- 4823 vehicles
- 2514 vehicles
- 645+ vehicles

- Rooms in owner-occupied houses in Beaumont, California
- 531 room
- 282 rooms
- 3593 rooms
- 1,3124 rooms
- 2,8435 rooms
- 2,7936 rooms
- 2,2967 rooms
- 1,6278 rooms
- 2,1189+ rooms

- Rooms in renter-occupied apartments in Beaumont, California
- 241 room
- 2072 rooms
- 4913 rooms
- 8704 rooms
- 3445 rooms
- 4196 rooms
- 5237 rooms
- 1418 rooms
- 3269+ rooms


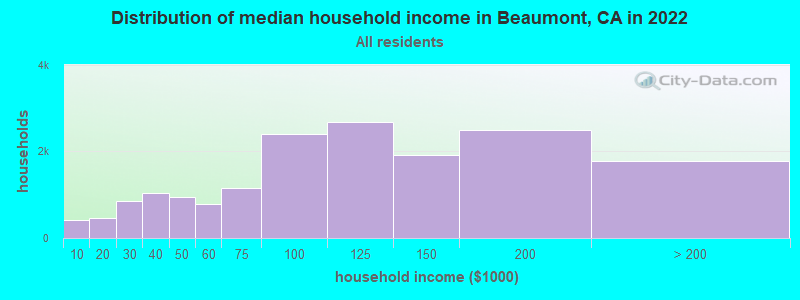
Beaumont, CA household income distribution

- 413Less than $10,000
- 473$10,000 to $19,999
- 844$20,000 to $29,999
- 1,047$30,000 to $39,999
- 935$40,000 to $49,999
- 781$50,000 to $59,999
- 1,160$60,000 to $74,999
- 2,398$75,000 to $99,999
- 2,678$100,000 to $124,999
- 1,916$125,000 to $149,999
- 2,490$150,000 to $199,999
- 1,789$200,000 or more
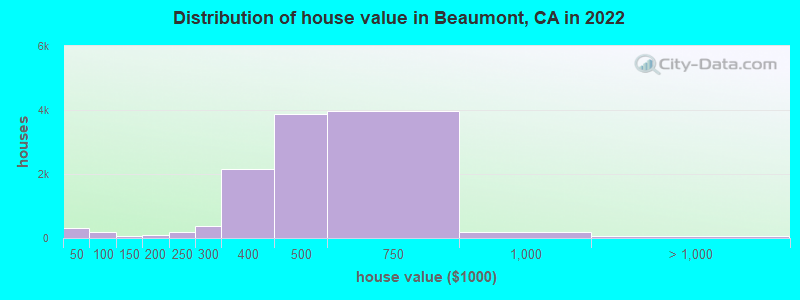
Home value of owner - occupied houses in 2022 in Beaumont, CA
-
- 172Less than $10,000
- 28$10,000 to $14,999
- 7$15,000 to $19,999
- 5$20,000 to $24,999
- 7$25,000 to $29,999
- 5$30,000 to $34,999
- 26$35,000 to $39,999
- 46$40,000 to $49,999
- 69$50,000 to $59,999
- 50$60,000 to $69,999
- 33$80,000 to $89,999
- 65$100,000 to $124,999
- 6$125,000 to $149,999
- 51$150,000 to $174,999
- 28$175,000 to $199,999
- 194$200,000 to $249,999
- 388$250,000 to $299,999
- 2,141$300,000 to $399,999
- 3,888$400,000 to $499,999
- 3,975$500,000 to $749,999
- 188$750,000 to $999,999
- 75$1,000,000 to $1,499,999
Rent paid by renters in 2022 in Beaumont, CA
-
- 55$100 to $149
- 65$200 to $249
- 16$250 to $299
- 120$350 to $399
- 19$400 to $449
- 3$450 to $499
- 69$500 to $549
- 64$550 to $599
- 115$600 to $649
- 9$650 to $699
- 97$700 to $749
- 64$750 to $799
- 195$800 to $899
- 279$900 to $999
- 438$1,000 to $1,249
- 178$1,250 to $1,499
- 669$1,500 to $1,999
- 450$2,000 to $2,499
- 223$2,500 to $2,999
- 31$3,000 to $3,499
- 178No cash rent


Percentage of workers working in this county: 61.0%
Number of people working at home: 2,789 (11.7% of all workers)
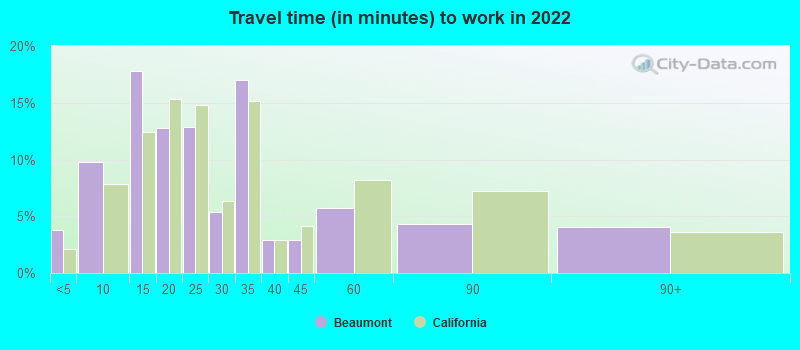
Travel time to work (commute)
- Less than 5 minutes: 524
- 5 to 9 minutes: 1,313
- 10 to 14 minutes: 2,153
- 15 to 19 minutes: 2,478
- 20 to 24 minutes: 1,342
- 25 to 29 minutes: 1,274
- 30 to 34 minutes: 3,072
- 35 to 39 minutes: 1,372
- 40 to 44 minutes: 894
- 45 to 59 minutes: 3,272
- 60 to 89 minutes: 1,988
- 90 or more minutes: 1,413
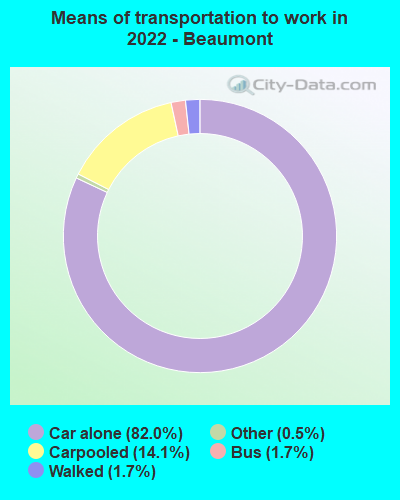
Means of transportation to work:
- Drove a car alone: 8,177 (64.7%)
- Carpooled: 1,522 (12.0%)
- Bus: 153 (1.2%)
- Taxi: 49 (0.4%)
- Walked: 173 (1.4%)
- Worked at home: 2,789 (22.1%)

- Unemployment by race in 2022
- Unemployment rate for White non-Hispanic residents
- 2.9%Males
- 4.3%Females
- Unemployment rate for Black residents
- 4.4%Males
- 7.7%Females
- Unemployment rate for American Indian and Alaska Native residents
- 14.7%Males
- 9.2%Females
- Unemployment rate for Asian residents
- 4.7%Males
- 7.5%Females
- Unemployment rate for other race residents
- 3.1%Males
- 3.6%Females
- Unemployment rate for two or more race residents
- 7.1%Males
- 3.2%Females
- Unemployment rate for Hispanic or Latino residents
- 4.1%Males
- 4.0%Females

- Year of entry for the foreign-born population in Beaumont, California
- 1,5392010 or later
- 1,8122000 to 2009
- 1,8121990 to 1999
- 5421980 to 1989
- 3561970 to 1979
- 333Before 1970

First ancestries reported:
- English: 1,718 (5.4%)
- Irish: 1,477 (4.6%)
- American: 1,216 (3.8%)
- German: 699 (2.2%)
- Italian: 517 (1.6%)
- Eastern European: 386 (1.2%)
- European: 314 (1.0%)
- Scottish: 213 (0.7%)
- Romanian: 177 (0.6%)
- Polish: 175 (0.5%)
- Jordanian: 166 (0.5%)
- Dutch: 166 (0.5%)
- African: 146 (0.5%)
- Jamaican: 127 (0.4%)
- Norwegian: 114 (0.4%)
- French: 94 (0.3%)
- Swedish: 69 (0.2%)
- Armenian: 65 (0.2%)
- Russian: 58 (0.2%)
- Hungarian: 50 (0.2%)
- Portuguese: 43 (0.1%)
- Belgian: 35 (0.1%)
- Yugoslavian: 27 (0.08%)
- French Canadian: 26 (0.08%)
- Scotch-Irish: 25 (0.08%)
- Austrian: 24 (0.07%)
- British: 21 (0.07%)
- New Zealander: 19 (0.06%)
- Welsh: 15 (0.05%)
- Danish: 13 (0.04%)
- Czech: 13 (0.04%)
- Palestinian: 13 (0.04%)
- Slovak: 10 (0.03%)
- Czechoslovakian: 9 (0.03%)
- Turkish: 9 (0.03%)
- Swiss: 9 (0.03%)
- Egyptian: 8 (0.02%)
- Greek: 7 (0.02%)
- Pennsylvania German: 7 (0.02%)
- Finnish: 7 (0.02%)
- Nigerian: 7 (0.02%)
- Scandinavian: 5 (0.02%)
- Croatian: 5 (0.02%)
- Ukrainian: 5 (0.02%)
- Northern European: 4 (0.01%)
- Brazilian: 4 (0.01%)
Most common places of birth for foreign-born residents (%):
| Beaumont: | 40.8% (3,751) |
| California: | 37.2% (3,881,193) |
| Beaumont: | 13.4% (1,230) |
| California: | 7.8% (818,297) |
| Beaumont: | 6.0% (552) |
| California: | 5.2% (539,184) |
| Beaumont: | 2.9% (271) |
| California: | 6.6% (684,672) |
| Beaumont: | 2.3% (213) |
| California: | 2.8% (290,436) |
| Beaumont: | 1.9% (172) |
| California: | 1.7% (176,274) |
| Beaumont: | 1.7% (158) |
| California: | 0.1% (6,853) |
Place of birth for U.S.-born residents:
- This state: 37,775
- Other state: 6,810
- Northeast: 1,543
- Midwest: 2,127
- South: 1,729
- West: 1,413
89.5% of Beaumont residents lived in the same house 1 years ago.
Out of people who lived in different houses, 30.7% lived in this county.
Out of people who lived in different counties, 83.6% lived in California.
| Beaumont: | 89.5% |
| State average: | 88.9% |
Education attainment for males 25 years and older:
- No schooling: 381
- Nursery to 4th grade: 36
- 5th and 6th grade: 326
- 7th and 8th grade: 59
- 9th grade: 228
- 10th grade: 106
- 11th grade: 227
- 12th grade, no diploma: 674
- High school graduate (or equivalency): 4,526
- Less than 1 year of college: 1,370
- Some college more than 1 year, no degree: 2,648
- Associate degree: 1,789
- Bachelor's degree: 2,492
- Master's degree: 1,094
- Professional school degree: 212
- Doctorate degree: 261

Education attainment for females 25 years and older:
- No schooling: 291
- Nursery to 4th grade: 75
- 5th and 6th grade: 203
- 7th and 8th grade: 148
- 9th grade: 109
- 10th grade: 167
- 11th grade: 250
- 12th grade, no diploma: 344
- High school graduate (or equivalency): 3,785
- Less than 1 year of college: 1,524
- Some college more than 1 year, no degree: 3,255
- Associate degree: 2,198
- Bachelor's degree: 3,131
- Master's degree: 1,973
- Professional school degree: 303
- Doctorate degree: 74


Housing units in structures:
- One, detached: 15,076
- One, attached: 505
- Two: 334
- 3 or 4: 207
- 5 to 9: 247
- 10 to 19: 219
- 20 to 49: 92
- 50 or more: 66
- Mobile homes: 314
- Boats, RVs, vans, etc.: 75
Median worth of mobile homes: $79,158
Housing units lacking complete kitchen facilities in 2022: 0.6%
House/condo owner moved in on average 6 years ago
Renter moved in on average 3 years ago

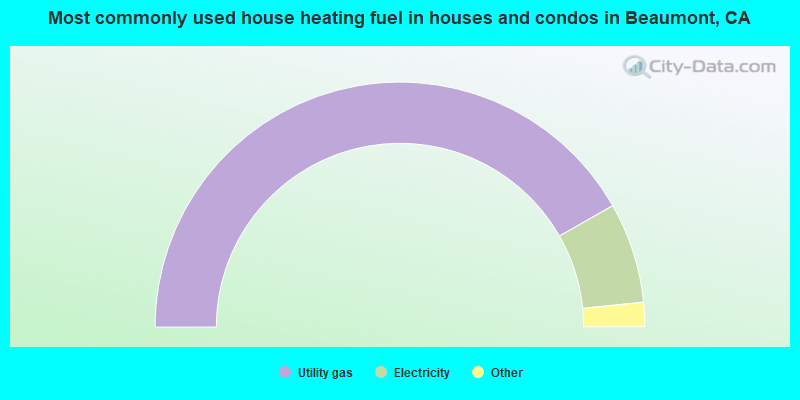
- 83.5%Utility gas
- 13.3%Electricity
- 1.8%Solar energy
- 1.1%Bottled, tank, or LP gas
- 0.2%No fuel used
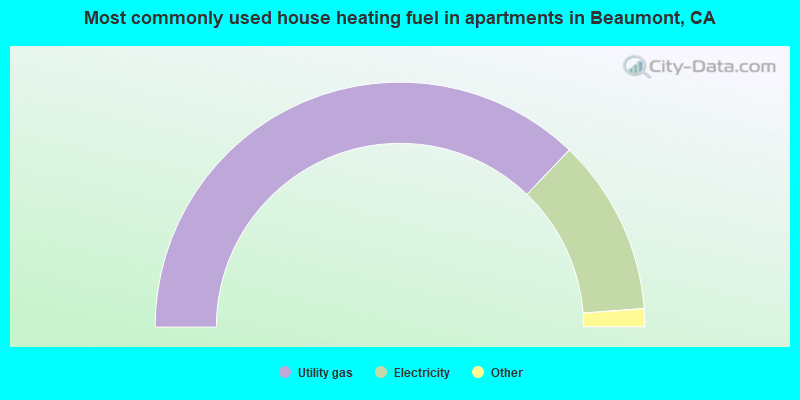
- 74.3%Utility gas
- 23.3%Electricity
- 0.8%Bottled, tank, or LP gas
- 0.8%Other fuel
- 0.6%Solar energy
- 0.2%No fuel used
Private vs. public school enrollment:
| Here: | 9.5% |
| California: | 10.5% |
| Here: | 3.3% |
| California: | 8.5% |
| Here: | 23.5% |
| California: | 15.9% |


