Bear Valley Springs, CA (California) Houses and Residents
| Bear Valley Springs: | $511,687 |
| California: | $715,900 |
Total population: 5,172 (Urban population: 0, Rural population: 4,313 (all nonfarm))
Houses: 2,893 (2,465 occupied: 2,236 owner occupied, 245 renter occupied)
| % of renters here: | 10% |
| State: | 44% |
Housing density: 70 houses/condos per square mile
Median price asked for vacant for-sale houses and condos in 2022: $275,406.
Median contract rent in 2022: $958 (lower quartile is $741, upper quartile is $1,147)
Median rent asked for vacant for-rent units in 2022: $288
Median gross rent in Bear Valley Springs, CA in 2022: $1,097
Housing units in Bear Valley Springs with a mortgage: 1,435 (83 second mortgage, 0 home equity loan, 60 both second mortgage and home equity loan)
Houses without a mortgage: 0
Median household income for houses/condos with a mortgage: $122,363
Median household income for apartments without a mortgage: $92,187
Median monthly housing costs: $1,689
Compare current foreclosures near Bear Valley Springs, CA:
| Photo | Address | Area | Beds / Baths | Price | Details |
|---|---|---|---|---|---|

|
#1
Pegasus St
Tehachapi, CA 93561
|
4,016 sq. feet
|
3 baths 4 beds |
$799,000
|
show details |

|
#2
Ryder Cup Ln
Tehachapi, CA 93561
|
1,534 sq. feet
|
2 baths 3 beds |
show details | |

|
#3
Brook Dr
Tehachapi, CA 93561
|
1,429 sq. feet
|
2 baths 3 beds |
show details | |

|
#4
Georgia St
Tehachapi, CA 93561
|
3,533 sq. feet
|
2 baths 4 beds |
show details | |

|
#5
Degagne Ct
Tehachapi, CA 93561
|
1,850 sq. feet
|
2 baths 3 beds |
show details | |

|
#6
Shoreline Ct
Tehachapi, CA 93561
|
2,733 sq. feet
|
4 baths 5 beds |
show details | |

|
#7
Bertal St
Lamont, CA 93241
|
1,377 sq. feet
|
1 baths 3 beds |
show details | |

|
#8
Georgetown Ave
Lamont, CA 93241
|
1,016 sq. feet
|
2 baths 3 beds |
show details | |

|
#9
E Tehachapi Blvd
Tehachapi, CA 93561
|
1,456 sq. feet
|
2 baths 3 beds |
show details | |

|
#10
Arabian Dr
Tehachapi, CA 93561
|
1,440 sq. feet
|
2 baths 3 beds |
show details |
| Photo | Address | Area | Beds / Baths | Price | Details |
|---|---|---|---|---|---|

|
#11
Canyon Dr E
Tehachapi, CA 93561
|
1,517 sq. feet
|
2 baths 3 beds |
show details | |

|
#12
Wild Olive Rd
Tehachapi, CA 93561
|
2,478 sq. feet
|
2 baths 4 beds |
show details | |

|
#13
Scarlet Oak Dr
Tehachapi, CA 93561
|
1,716 sq. feet
|
2 baths 3 beds |
show details | |

|
#14
Elm St
Tehachapi, CA 93561
|
1,472 sq. feet
|
2 baths 3 beds |
show details | |

|
#15
Hickory Ave
Tehachapi, CA 93561
|
1,908 sq. feet
|
2 baths 4 beds |
show details | |

|
#16
Tucker St
Arvin, CA 93203
|
1,160 sq. feet
|
2 baths 4 beds |
show details | |

|
#17
Jess St
Arvin, CA 93203
|
1,120 sq. feet
|
2 baths 3 beds |
show details | |

|
#18
Gonzales St
Arvin, CA 93203
|
1,120 sq. feet
|
2 baths 3 beds |
show details | |

|
#19
Brassie Ct
Tehachapi, CA 93561
|
2,404 sq. feet
|
3 baths 4 beds |
show details | |

|
#20
Matterhorn Dr
Tehachapi, CA 93561
|
1,252 sq. feet
|
2 baths 2 beds |
show details |
| Photo | Address | Area | Beds / Baths | Price | Details |
|---|---|---|---|---|---|

|
#21
Tulip Ct
Tehachapi, CA 93561
|
1,727 sq. feet
|
3 baths 3 beds |
show details | |

|
#22
Pegasus St
Tehachapi, CA 93561
|
1,428 sq. feet
|
2 baths 3 beds |
show details | |

|
#23
Harness Dr
Tehachapi, CA 93561
|
1,680 sq. feet
|
2 baths 3 beds |
show details | |

|
#24
William Tell Ct
Tehachapi, CA 93561
|
1,402 sq. feet
|
2 baths 3 beds |
show details | |

|
#25
Buena Vis Blvd
Arvin, CA 93203
|
- sq. feet
|
- baths - beds |
show details | |

|
#26
Stobaugh St Apt 702
Lamont, CA 93241
|
- sq. feet
|
- baths - beds |
show details | |

|
#27
Far Hills Ave
Lamont, CA 93241
|
- sq. feet
|
- baths - beds |
show details | |

|
#28
Devil Diver Ct
Tehachapi, CA 93561
|
- sq. feet
|
- baths - beds |
show details | |

|
#29
Brook Dr Apt D
Tehachapi, CA 93561
|
- sq. feet
|
- baths - beds |
show details | |

|
#30
Brook Dr Apt F
Tehachapi, CA 93561
|
- sq. feet
|
- baths - beds |
show details |
| Photo | Address | Area | Beds / Baths | Price | Details |
|---|---|---|---|---|---|

|
#31
Packard Dr
Arvin, CA 93203
|
- sq. feet
|
- baths - beds |
show details | |

|
#32
Flores Ct
Arvin, CA 93203
|
- sq. feet
|
- baths - beds |
show details | |

|
#33
N Mill St Apt 20
Tehachapi, CA 93561
|
- sq. feet
|
- baths - beds |
show details | |

|
#34
N Mill St Apt 35
Tehachapi, CA 93561
|
- sq. feet
|
- baths - beds |
show details | |

|
#35
La Rosa Ave
Arvin, CA 93203
|
- sq. feet
|
- baths - beds |
show details | |

|
#36
Austin Ct
Arvin, CA 93203
|
- sq. feet
|
- baths - beds |
show details | |

|
#37
Maple St
Tehachapi, CA 93561
|
- sq. feet
|
- baths - beds |
show details | |

|
#38
Tin Ct # 3
Tehachapi, CA 93561
|
- sq. feet
|
- baths - beds |
show details | |

|
#39
Arosa Rd # 30
Tehachapi, CA 93561
|
- sq. feet
|
- baths - beds |
show details | |

|
#40
S A St
Arvin, CA 93203
|
- sq. feet
|
- baths - beds |
show details |
| Photo | Address | Area | Beds / Baths | Price | Details |
|---|---|---|---|---|---|

|
#41
Tucker Rd, Ste G Pmb 444
Tehachapi, CA 93561
|
- sq. feet
|
- baths - beds |
show details | |

|
#42
San Diego St Apt C2
Lamont, CA 93241
|
- sq. feet
|
- baths - beds |
show details | |

|
#43
Millux Rd
Arvin, CA 93203
|
- sq. feet
|
- baths - beds |
show details | |

|
Check over 1 million property listings on Foreclosure.com!
|
browse all offers | |||


 | Let’s talk about Tehachapi (52 replies) |
| Halfway House in Bear Valley Springs, Tehachapi, Ca 93561 (1 reply) |
| Tehachapi, Cali...does anyone know anything about this little place? (52 replies) |
| Equestrians in Los Angeles County (10 replies) |
| What's wrong with Bear Valley Springs? (28 replies) |
| Anyone live in Bear Valley Springs? (7 replies) |

Median year apartment built: 2003
Household type by relationship:
Households: 5,654- Male householders: 1,427 (329 living alone), Female householders: 1,026 (285 living alone)
1,499 spouses (1,461 opposite-sex spouses), 64 unmarried partners, (64 opposite-sex unmarried partners), 1,414 children (1,345 natural, 68 adopted, 0 stepchildren), 40 grandchildren, 28 brothers or sisters, 42 parents, 0 foster children, 15 other relatives, 89 non-relatives
- In group quarters: 7
Size of family households: 1,139 2-persons, 267 3-persons, 164 4-persons, 149 5-persons, 41 6-persons.
Size of nonfamily households: 616 1-person, 90 2-persons.
956 married couples with children.
60 single-parent households (57 men, 3 women).
85.5% of residents of Bear Valley Springs speak English at home.
6.8% of residents speak Spanish at home (56% speak English very well, 33% speak English well, 11% speak English not well).
4.7% of residents speak other Indo-European language at home (100% speak English very well).
2.3% of residents speak Asian or Pacific Island language at home (63% speak English very well, 14% speak English well, 24% speak English not well).
Foreign born population: 913 (16.1%)
(88.0% of them are naturalized citizens)
| Here: | 6.4 |
| State: | 6.0 |
| Here: | 6.4 |
| State: | 3.9 |

- Bedrooms in owner-occupied houses and condos in Bear Valley Springs, California
- 0no bedroom
- 01 bedroom
- 1992 bedrooms
- 1,4093 bedrooms
- 6124 bedrooms
- 165+ bedrooms

- Bedrooms in renter-occupied apartments in Bear Valley Springs, California
- 13no bedroom
- 01 bedroom
- 172 bedrooms
- 1733 bedrooms
- 424 bedrooms
- 05+ bedrooms

- Cars and other vehicles available in Bear Valley Springs in owner-occupied houses/condos
- 18no vehicle
- 3621 vehicle
- 9922 vehicles
- 3843 vehicles
- 3564 vehicles
- 1255+ vehicles

- Cars and other vehicles available in Bear Valley Springs in renter-occupied apartments
- 0no vehicle
- 101 vehicle
- 792 vehicles
- 1213 vehicles
- 364 vehicles
- 05+ vehicles

- Rooms in owner-occupied houses in Bear Valley Springs, California
- 01 room
- 02 rooms
- 03 rooms
- 2114 rooms
- 5135 rooms
- 5236 rooms
- 3357 rooms
- 3198 rooms
- 3359+ rooms

- Rooms in renter-occupied apartments in Bear Valley Springs, California
- 131 room
- 02 rooms
- 03 rooms
- 174 rooms
- 315 rooms
- 726 rooms
- 07 rooms
- 298 rooms
- 849+ rooms


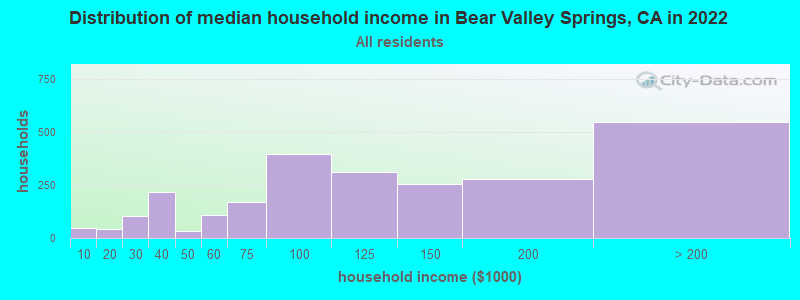
Bear Valley Springs, CA household income distribution

- 46Less than $10,000
- 43$10,000 to $19,999
- 102$20,000 to $29,999
- 215$30,000 to $39,999
- 31$40,000 to $49,999
- 109$50,000 to $59,999
- 170$60,000 to $74,999
- 395$75,000 to $99,999
- 311$100,000 to $124,999
- 253$125,000 to $149,999
- 276$150,000 to $199,999
- 547$200,000 or more
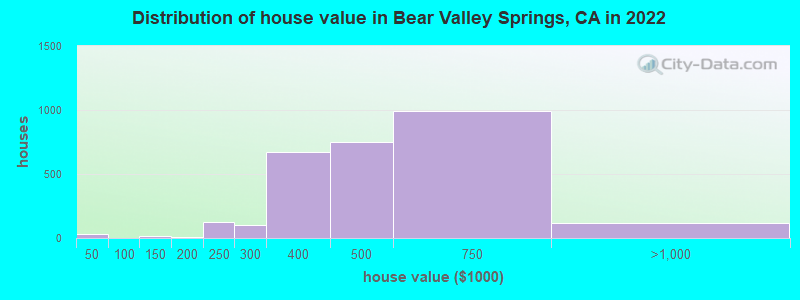
Home value of owner - occupied houses in 2022 in Bear Valley Springs, CA
-
- 3Less than $10,000
- 11$10,000 to $14,999
- 16$35,000 to $39,999
- 19$100,000 to $124,999
- 7$175,000 to $199,999
- 126$200,000 to $249,999
- 101$250,000 to $299,999
- 670$300,000 to $399,999
- 747$400,000 to $499,999
- 996$500,000 to $749,999
- 116$750,000 to $999,999
Rent paid by renters in 2022 in Bear Valley Springs, CA
-
- 44$700 to $749
- 26$900 to $999
- 31$1,000 to $1,249
- 17$1,500 to $1,999
- 103No cash rent


Percentage of workers working in this county: 89.5%
Number of people working at home: 277 (13.2% of all workers)
Travel time to work (commute)
- Less than 5 minutes: 73
- 5 to 9 minutes: 157
- 10 to 14 minutes: 28
- 15 to 19 minutes: 227
- 20 to 24 minutes: 376
- 25 to 29 minutes: 162
- 30 to 34 minutes: 64
- 35 to 39 minutes: 0
- 40 to 44 minutes: 0
- 45 to 59 minutes: 95
- 60 to 89 minutes: 558
- 90 or more minutes: 151
Means of transportation to work:
- Drove a car alone: 1,093 (70.2%)
- Carpooled: 318 (20.4%)
- Railroad: 2 (0.1%)
- Worked at home: 144 (9.2%)

- Unemployment by race in 2022
- Unemployment rate for White non-Hispanic residents
- 5.0%Females
- Unemployment rate for other race residents
- 21.5%Males
- Unemployment rate for Hispanic or Latino residents
- 6.6%Males

- Year of entry for the foreign-born population in Bear Valley Springs, California
- 152010 or later
- 1292000 to 2009
- 4161990 to 1999
- 351980 to 1989
- 521970 to 1979
- 184Before 1970

First ancestries reported:
- English: 259 (9.9%)
- Scottish: 240 (9.2%)
- European: 231 (8.8%)
- German: 220 (8.4%)
- Irish: 184 (7.0%)
- American: 107 (4.1%)
- Italian: 79 (3.0%)
- Dutch: 68 (2.6%)
- Norwegian: 67 (2.6%)
- Arab: 47 (1.8%)
- Armenian: 32 (1.2%)
- French: 32 (1.2%)
- Canadian: 25 (1.0%)
- Polish: 20 (0.8%)
- Scotch-Irish: 14 (0.5%)
- French Canadian: 12 (0.5%)
- Swedish: 11 (0.4%)
Most common places of birth for foreign-born residents (%):
| Bear Valley Springs: | 47.7% (445) |
| California: | 1.2% (127,477) |
| Bear Valley Springs: | 10.9% (102) |
| California: | 37.2% (3,881,193) |
| Bear Valley Springs: | 6.1% (57) |
| California: | 0.2% (20,614) |
| Bear Valley Springs: | 4.8% (45) |
| California: | 0.7% (73,304) |
| Bear Valley Springs: | 4.5% (42) |
| California: | 0.6% (60,582) |
| Bear Valley Springs: | 4.0% (37) |
| California: | 0.1% (10,349) |
| Bear Valley Springs: | 3.4% (32) |
| California: | 0.6% (57,953) |
| Bear Valley Springs: | 3.4% (32) |
| California: | 0.6% (66,590) |
| Bear Valley Springs: | 3.3% (31) |
| California: | 0.2% (17,937) |
| Bear Valley Springs: | 2.1% (20) |
| California: | 5.2% (539,184) |
| Bear Valley Springs: | 1.9% (18) |
| California: | 0.6% (60,761) |
| Bear Valley Springs: | 1.7% (16) |
| California: | 0.6% (65,335) |
| Bear Valley Springs: | 1.7% (16) |
| California: | 6.6% (684,672) |
| Bear Valley Springs: | 1.5% (14) |
| California: | 4.2% (440,287) |
Place of birth for U.S.-born residents:
- This state: 3,337
- Other state: 1,255
- Northeast: 293
- Midwest: 360
- South: 216
- West: 415
94.5% of Bear Valley Springs residents lived in the same house 1 years ago.
Out of people who lived in different houses, 23.6% lived in this county.
Out of people who lived in different counties, 78.2% lived in California.
| Bear Valley Springs: | 94.5% |
| State average: | 88.9% |
Education attainment for males 25 years and older:
- No schooling: 20
- Nursery to 4th grade: 0
- 5th and 6th grade: 0
- 7th and 8th grade: 0
- 9th grade: 0
- 10th grade: 0
- 11th grade: 11
- 12th grade, no diploma: 0
- High school graduate (or equivalency): 442
- Less than 1 year of college: 137
- Some college more than 1 year, no degree: 406
- Associate degree: 388
- Bachelor's degree: 610
- Master's degree: 303
- Professional school degree: 0
- Doctorate degree: 41

Education attainment for females 25 years and older:
- No schooling: 54
- Nursery to 4th grade: 0
- 5th and 6th grade: 0
- 7th and 8th grade: 39
- 9th grade: 15
- 10th grade: 0
- 11th grade: 0
- 12th grade, no diploma: 41
- High school graduate (or equivalency): 433
- Less than 1 year of college: 232
- Some college more than 1 year, no degree: 313
- Associate degree: 231
- Bachelor's degree: 548
- Master's degree: 156
- Professional school degree: 45
- Doctorate degree: 68


Housing units in structures:
- One, detached: 2,864
- One, attached: 29
House/condo owner moved in on average 10 years ago
Renter moved in on average 8 years ago

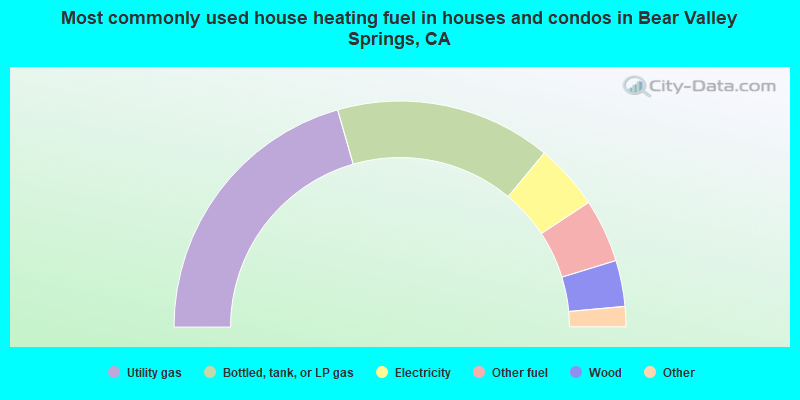
- 41.2%Utility gas
- 31.0%Bottled, tank, or LP gas
- 9.4%Electricity
- 9.1%Other fuel
- 6.6%Wood
- 2.1%No fuel used
- 0.6%Fuel oil, kerosene, etc.
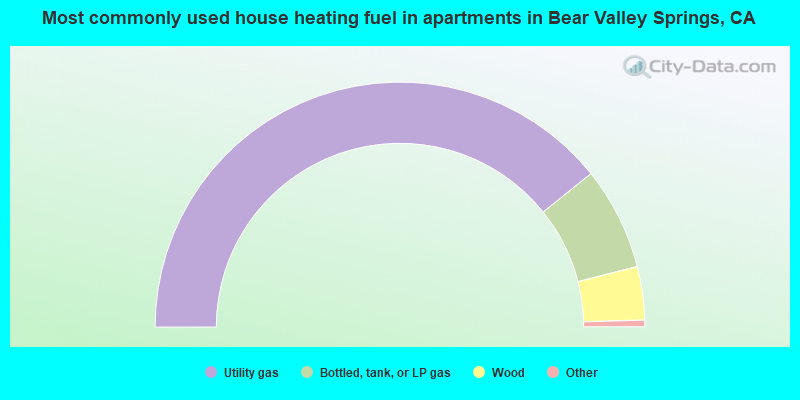
- 79.2%Utility gas
- 13.7%Bottled, tank, or LP gas
- 7.1%Wood
Private vs. public school enrollment:
| Here: | 41.5% |
| California: | 10.5% |
| Here: | 13.6% |
| California: | 8.5% |
| Here: | 25.5% |
| California: | 15.9% |


