Baytown, TX (Texas) Houses and Residents
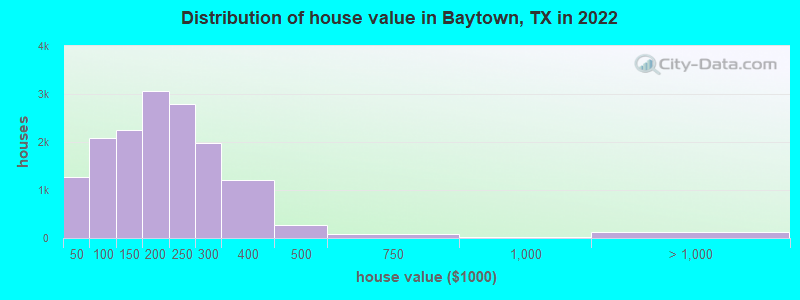
Estimated median house or condo value in 2022: $226,600 (it was $63,500 in 2000 )
Baytown:
$226,600Texas:
$275,400
Lower value quartile - upper value quartile: $153,300 - $289,900Total population: 76,127 (Urban population: 66,409, Rural population: 535 (14 farm, 521 nonfarm ))
Houses: 36,061 (32,959 occupied: 16,110 owner occupied, 16,849 renter occupied )
% of renters here:
51%State:
38%
Housing density: 1,104 houses/condos per square mile
Median price asked for vacant for-sale houses and condos in 2022: $134,569.
Median contract rent in 2022: $1,021 (lower quartile is $792, upper quartile is $1,263)
Median rent asked for vacant for-rent units in 2022: $1,495
Median gross rent in Baytown, TX in 2022: $1,207
Housing units in Baytown with a mortgage: 8,452 (219 second mortgage, 36 home equity loan, 179 both second mortgage and home equity loan )Houses without a mortgage: 230
Median household income for houses/condos with a mortgage: $77,355
Median household income for apartments without a mortgage: $64,382
Median monthly housing costs: $1,183
Data:
Median house or condo value ($)
Median house or condo value ($ change since 2000)
Median house or condo value ($) - White
Median house or condo value ($) - Black or African American
Median house or condo value ($) - Asian
Median house or condo value ($) - Hispanic or Latino
Median house or condo value ($) - American Indian and Alaska Native
Median house or condo value ($) - Multirace
Median house or condo value ($) - Other Race
Median price asked for mobile homes ($)
Household density (households per square mile)
Mean house or condo value by units in structure - 1, detached ($)
Mean house or condo value by units in structure - 1, attached ($)
Mean house or condo value by units in structure - 2 ($)
Mean house or condo value by units in structure by units in structure - 3 or 4 ($)
Mean house or condo value by units in structure - 5 or more ($)
Mean house or condo value by units in structure - Boat, RV, van, etc. ($)
Mean house or condo value by units in structure - Mobile home ($)
Median contract rent ($)
Median contract rent - Lower quartile ($)
Median contract rent - Upper quartile ($)
Median gross rent ($)
Urban houses (%)
Rural houses (%)
Houses occupied (%)
Houses occupied (% change since 2000)
Houses owner occupied (%)
Houses owner occupied (% change since 2000)
Houses renter occupied (%)
Houses renter occupied (% change since 2000)
Vacant housing units - For rent (%)
Vacant housing units - For rent (% change since 2000)
Vacant housing units - For sale only (%)
Vacant housing units - For sale only (% change since 2000)
Vacant housing units - Rented or sold, not occupied (%)
Vacant housing units - Rented or sold, not occupied (% change since 2000)
Vacant housing units - For seasonal, recreational, or occasional use (%)
Vacant housing units - For seasonal, recreational, or occasional use (% change since 2000)
Vacant housing units - For migrant workers (%)
Vacant housing units - For migrant workers (% change since 2000)
Vacant housing units - Other vacant (%)
Vacant housing units - Other vacant (% change since 2000)
Median monthly housing costs ($)
Median household income for houses/condos with a mortgage ($)
Median household income for houses/condos without a mortgage ($)
Median household income ($)
Median household income ($) - White
Median household income ($) - Black or African American
Median household income ($) - Asian
Median household income ($) - Hispanic or Latino
Median household income ($) - American Indian and Alaska Native
Median household income ($) - Multirace
Median household income ($) - Other Race
Mortgage status - with mortgage (%)
Mortgage status - with second mortgage (%)
Mortgage status - with home equity loan (%)
Mortgage status - with both second mortgage and home equity loan (%)
Mortgage status - without a mortgage (%)
Median year house/condo built
Median year apartment built
Household type by relationship - Male householder living alone (%)
Household type by relationship - Male householder not living alone (%)
Household type by relationship - Female householder living alone (%)
Household type by relationship - Female householder not living alone (%)
Household type by relationship - Opposite-Sex spouse (%)
Household type by relationship - Same-Sex spouse (%)
Household type by relationship - Opposite-Sex unmarried partner (%)
Household type by relationship - Same-Sex unmarried partner (%)
Household type by relationship - In group quarters (%)
Size of family households - 2-person household (%)
Size of family households - 3-person household (%)
Size of family households - 4-person household (%)
Size of family households - 5-person household (%)
Size of family households - 6-person household (%)
Size of family households - 7-or-more-person household (%)
Size of nonfamily households - 1-person household (%)
Size of nonfamily households - 2-person household (%)
Size of nonfamily households - 3-person household (%)
Size of nonfamily households - 4-person household (%)
Size of nonfamily households - 5-person household (%)
Size of nonfamily households - 6-person household (%)
Size of nonfamily households - 7-or-moreperson household (%)
Year house built - Built 2010 or later (%)
Year house built - Built 2000 to 2009 (%)
Year house built - Built 1990 to 1999 (%)
Year house built - Built 1980 to 1989 (%)
Year house built - Built 1970 to 1979 (%)
Year house built - Built 1960 to 1969 (%)
Year house built - Built 1950 to 1959 (%)
Year house built - Built 1940 to 1949 (%)
Year house built - Built 1939 or earlier (%)
Median number of rooms in houses and condos
Median number of rooms in apartments
Median number of bedrooms in owner occupied houses
Mean number of bedrooms in owner occupied houses
Median number of bedrooms in renter occupied houses
Mean number of bedrooms in renter occupied houses
Median number of vehichles in owner occupied houses
Mean number of vehichles in owner occupied houses
Median number of vehichles in renter occupied houses
Mean number of vehichles in renter occupied houses
Rooms in owner-occupied houses - 1 room (%)
Rooms in owner-occupied houses - 2 rooms (%)
Rooms in owner-occupied houses - 3 rooms (%)
Rooms in owner-occupied houses - 4 rooms (%)
Rooms in owner-occupied houses - 5 rooms (%)
Rooms in owner-occupied houses - 6 rooms (%)
Rooms in owner-occupied houses - 7 rooms (%)
Rooms in owner-occupied houses - 8 rooms (%)
Rooms in owner-occupied houses - 9+ rooms (%)
Rooms in renter-occupied houses - 1 room (%)
Rooms in renter-occupied houses - 2 rooms (%)
Rooms in renter-occupied houses - 3 rooms (%)
Rooms in renter-occupied houses - 4 rooms (%)
Rooms in renter-occupied houses - 5 rooms (%)
Rooms in renter-occupied houses - 6 rooms (%)
Rooms in renter-occupied houses - 7 rooms (%)
Rooms in renter-occupied houses - 8 rooms (%)
Rooms in renter-occupied houses - 9+ rooms (%)
Bedrooms in owner-occupied houses - no bedrooms (%)
Bedrooms in owner-occupied houses - 1 bedroom (%)
Bedrooms in owner-occupied houses - 2 bedrooms (%)
Bedrooms in owner-occupied houses - 3 bedrooms (%)
Bedrooms in owner-occupied houses - 4 bedrooms (%)
Bedrooms in owner-occupied houses - 5+ bedrooms (%)
Bedrooms in renter-occupied houses - no bedrooms (%)
Bedrooms in renter-occupied houses - 1 bedroom (%)
Bedrooms in renter-occupied houses - 2 bedrooms (%)
Bedrooms in renter-occupied houses - 3 bedrooms (%)
Bedrooms in renter-occupied houses - 4 bedrooms (%)
Bedrooms in renter-occupied houses - 5+ bedrooms (%)
Vehicles available in owner-occupied houses - no vehicle available (%)
Vehicles available in owner-occupied houses - 1 vehicle available(%)
Vehicles available in owner-occupied houses - 2 Vehicles available (%)
Vehicles available in owner-occupied houses - 3 Vehicles available (%)
Vehicles available in owner-occupied houses - 4 Vehicles available (%)
Vehicles available in owner-occupied houses - 5+ Vehicles available (%)
Vehicles available in renter-occupied houses - no vehicle available (%)
Vehicles available in renter-occupied houses - 1 vehicle available (%)
Vehicles available in renter-occupied houses - 2 Vehicles available (%)
Vehicles available in renter-occupied houses - 3 Vehicles available (%)
Vehicles available in renter-occupied houses - 4 Vehicles available (%)
Vehicles available in renter-occupied houses - 5+ Vehicles available (%)
Housing units in structures - 1, detached (%)
Housing units in structures - 1, attached (%)
Housing units in structures - 2 (%)
Housing units in structures - 3 or 4 (%)
Housing units in structures - 5 to 9 (%)
Housing units in structures - 10 to 19 (%)
Housing units in structures - 20 to 49 (%)
Housing units in structures - 50 or more (%)
Housing units in structures - Mobile home (%)
Housing units in structures - Boat, RV, van, etc. (%)
Housing units in structures - Owners - 1, detached (%)
Housing units in structures - Owners - 1, attached (%)
Housing units in structures - Owners - 2 (%)
Housing units in structures - Owners - 3 or 4 (%)
Housing units in structures - Owners - 5 to 9 (%)
Housing units in structures - Owners - 10 to 19 (%)
Housing units in structures - Owners - 20 to 49 (%)
Housing units in structures - Owners - 50 or more (%)
Housing units in structures - Owners - Mobile home (%)
Housing units in structures - Owners - Boat, RV, van, etc. (%)
Housing units in structures - Renters - 1, detached (%)
Housing units in structures - Renters - 1, attached (%)
Housing units in structures - Renters - 2 (%)
Housing units in structures - Renters - 3 or 4 (%)
Housing units in structures - Renters - 5 to 9 (%)
Housing units in structures - Renters - 10 to 19 (%)
Housing units in structures - Renters - 20 to 49 (%)
Housing units in structures - Renters - 50 or more (%)
Housing units in structures - Renters - Mobile home (%)
Housing units in structures - Renters - Boat, RV, van, etc. (%)
House/condo owner moved in on average (years ago)
Renter moved in on average (years ago)
Year householder moved into unit - Moved in 1999 to March 2000 (%)
Year householder moved into unit - Moved in 1999 to March 2000 (%) - White
Year householder moved into unit - Moved in 1999 to March 2000 (%) - Black or African American
Year householder moved into unit - Moved in 1999 to March 2000 (%) - Asian
Year householder moved into unit - Moved in 1999 to March 2000 (%) - Hispanic or Latino
Year householder moved into unit - Moved in 1999 to March 2000 (%) - American Indian and Alaska Native
Year householder moved into unit - Moved in 1999 to March 2000 (%) - Multirace
Year householder moved into unit - Moved in 1999 to March 2000 (%) - Other Race
Year householder moved into unit - Moved in 1995 to 1998 (%)
Year householder moved into unit - Moved in 1995 to 1998 (%) - White
Year householder moved into unit - Moved in 1995 to 1998 (%) - Black or African American
Year householder moved into unit - Moved in 1995 to 1998 (%) - Asian
Year householder moved into unit - Moved in 1995 to 1998 (%) - Hispanic or Latino
Year householder moved into unit - Moved in 1995 to 1998 (%) - American Indian and Alaska Native
Year householder moved into unit - Moved in 1995 to 1998 (%) - Multirace
Year householder moved into unit - Moved in 1995 to 1998 (%) - Other Race
Year householder moved into unit - Moved in 1990 to 1994 (%)
Year householder moved into unit - Moved in 1990 to 1994 (%) - White
Year householder moved into unit - Moved in 1990 to 1994 (%) - Black or African American
Year householder moved into unit - Moved in 1990 to 1994 (%) - Asian
Year householder moved into unit - Moved in 1990 to 1994 (%) - Hispanic or Latino
Year householder moved into unit - Moved in 1990 to 1994 (%) - American Indian and Alaska Native
Year householder moved into unit - Moved in 1990 to 1994 (%) - Multirace
Year householder moved into unit - Moved in 1990 to 1994 (%) - Other Race
Year householder moved into unit - Moved in 1980 to 1989 (%)
Year householder moved into unit - Moved in 1980 to 1989 (%) - White
Year householder moved into unit - Moved in 1980 to 1989 (%) - Black or African American
Year householder moved into unit - Moved in 1980 to 1989 (%) - Asian
Year householder moved into unit - Moved in 1980 to 1989 (%) - Hispanic or Latino
Year householder moved into unit - Moved in 1980 to 1989 (%) - American Indian and Alaska Native
Year householder moved into unit - Moved in 1980 to 1989 (%) - Multirace
Year householder moved into unit - Moved in 1980 to 1989 (%) - Other Race
Year householder moved into unit - Moved in 1970 to 1979 (%)
Year householder moved into unit - Moved in 1970 to 1979 (%) - White
Year householder moved into unit - Moved in 1970 to 1979 (%) - Black or African American
Year householder moved into unit - Moved in 1970 to 1979 (%) - Asian
Year householder moved into unit - Moved in 1970 to 1979 (%) - Hispanic or Latino
Year householder moved into unit - Moved in 1970 to 1979 (%) - American Indian and Alaska Native
Year householder moved into unit - Moved in 1970 to 1979 (%) - Multirace
Year householder moved into unit - Moved in 1970 to 1979 (%) - Other Race
Year householder moved into unit - Moved in 1969 or earlier (%)
Year householder moved into unit - Moved in 1969 or earlier (%) - White
Year householder moved into unit - Moved in 1969 or earlier (%) - Black or African American
Year householder moved into unit - Moved in 1969 or earlier (%) - Asian
Year householder moved into unit - Moved in 1969 or earlier (%) - Hispanic or Latino
Year householder moved into unit - Moved in 1969 or earlier (%) - American Indian and Alaska Native
Year householder moved into unit - Moved in 1969 or earlier (%) - Multirace
Year householder moved into unit - Moved in 1969 or earlier (%) - Other Race
Housing units lacking complete plumbing facilities (%)
Housing units lacking complete kitchen facilities (%)
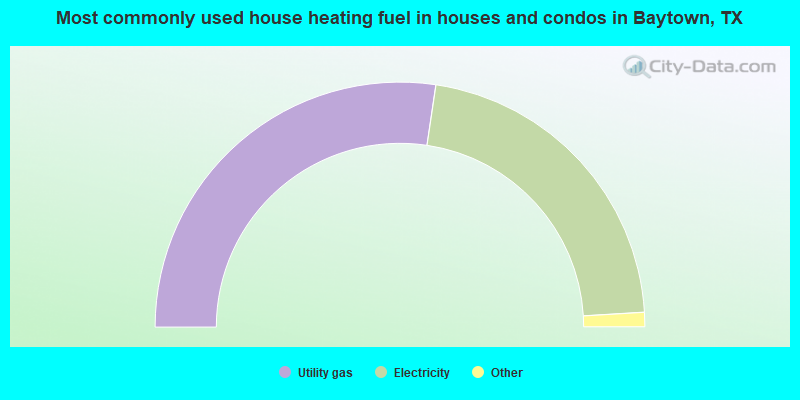
House heating fuel used in houses and condos - Utility gas (%)
House heating fuel used in houses and condos - Bottled, tank, or LP gas (%)
House heating fuel used in houses and condos - Electricity (%)
House heating fuel used in houses and condos - Fuel oil, kerosene, etc. (%)
House heating fuel used in houses and condos - Coal or coke (%)
House heating fuel used in houses and condos - Wood (%)
House heating fuel used in houses and condos - Solar energy (%)
House heating fuel used in houses and condos - Other fuel (%)
House heating fuel used in houses and condos - No fuel used (%)
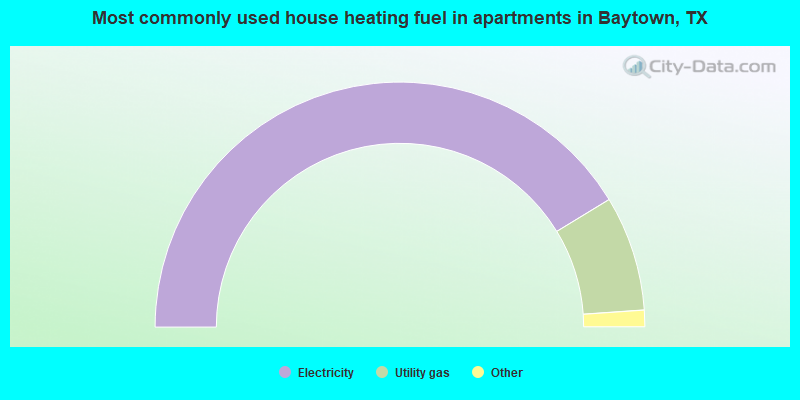
House heating fuel used in apartments - Utility gas (%)
House heating fuel used in apartments - Bottled, tank, or LP gas (%)
House heating fuel used in apartments - Electricity (%)
House heating fuel used in apartments - Fuel oil, kerosene, etc. (%)
House heating fuel used in apartments - Coal or coke (%)
House heating fuel used in apartments - Wood (%)
House heating fuel used in apartments - Solar energy (%)
House heating fuel used in apartments - Other fuel (%)
House heating fuel used in apartments - No fuel used (%)
Latest news about housing in Baytown, TX collected exclusively by city-data.com from local newspapers, TV, and radio stations
Median year house/condo built: 1985Median year apartment built: 1987Household type by relationship:
Households: 86,203
Male householders: 18,958 (5,685 living alone ), Female householders: 14,001 (4,606 living alone )12,717 spouses (12,588 opposite-sex spouses ), 2,325 unmarried partners , (2,001 opposite-sex unmarried partners ), 27,992 children (26,342 natural , 119 adopted , 1,531 stepchildren ), 3,140 grandchildren , 1,837 brothers or sisters , 630 parents , 0 foster children , 1,615 other relatives , 2,449 non-relatives In group quarters: 539
Size of family households: 7,351 2-persons , 5,747 3-persons , 2,956 4-persons , 2,591 5-persons , 1,708 6-persons , 540 7-or-more-persons .
Size of nonfamily households: 10,291 1-person , 813 2-persons , 812 3-persons , 150 4-persons .
11,843 married couples with children. single-parent households (1,868 men , 6,613 women ).
56.4% of residents of Baytown speak English at home. of residents speak Spanish at home (59% speak English very well , 19% speak English well , 13% speak English not well , 9% don't speak English at all ).of residents speak other Indo-European language at home (85% speak English very well , 12% speak English well , 1% speak English not well , 2% don't speak English at all ).of residents speak Asian or Pacific Island language at home (59% speak English very well , 22% speak English well , 10% speak English not well , 8% don't speak English at all ).of residents speak other language at home (89% speak English very well , 6% speak English well , 4% speak English not well ).
Foreign born population: 19,861 (23.0%)of them are naturalized citizens )
Median number of rooms in houses and condos:
Median number of rooms in apartments
Owner-occupied Renter-occupied
Rooms in owner-occupied houses in Baytown, Texas
0 1 room 0 2 rooms 307 3 rooms 1,599 4 rooms 2,509 5 rooms 4,227 6 rooms 2,060 7 rooms 2,698 8 rooms 2,710 9+ rooms
Rooms in renter-occupied apartments in Baytown, Texas
473 1 room 790 2 rooms 3,750 3 rooms 5,652 4 rooms 3,005 5 rooms 2,129 6 rooms 588 7 rooms 278 8 rooms 184 9+ rooms
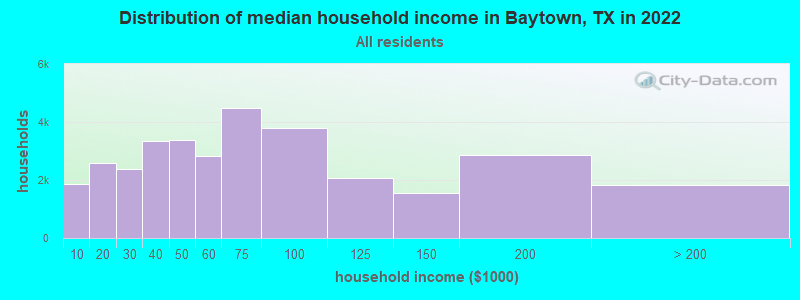
Baytown, TX household income distribution 1,862 Less than $10,0002,571 $10,000 to $19,9992,371 $20,000 to $29,9993,344 $30,000 to $39,9993,391 $40,000 to $49,9992,812 $50,000 to $59,9994,499 $60,000 to $74,9993,804 $75,000 to $99,9992,078 $100,000 to $124,9991,540 $125,000 to $149,9992,864 $150,000 to $199,9991,823 $200,000 or more
Home value of owner - occupied houses in 2022 in Baytown, TX 540 Less than $10,000170 $10,000 to $14,999144 $15,000 to $19,999166 $20,000 to $24,99911 $25,000 to $29,99921 $30,000 to $34,99975 $35,000 to $39,999132 $40,000 to $49,999291 $50,000 to $59,999478 $60,000 to $69,999415 $70,000 to $79,999496 $80,000 to $89,999266 $90,000 to $99,9991,036 $100,000 to $124,9991,216 $125,000 to $149,9991,874 $150,000 to $174,9991,189 $175,000 to $199,9992,792 $200,000 to $249,9991,975 $250,000 to $299,9991,214 $300,000 to $399,999274 $400,000 to $499,99986 $500,000 to $749,99929 $750,000 to $999,99932 $1,000,000 to $1,499,99988 $2,000,000 or moreRent paid by renters in 2022 in Baytown, TX 56 Less than $1005 $100 to $149115 $150 to $199100 $200 to $24954 $250 to $299193 $300 to $34975 $350 to $399101 $400 to $44969 $450 to $499253 $500 to $549284 $550 to $599494 $600 to $649890 $650 to $699789 $700 to $749720 $750 to $7991,179 $800 to $8991,796 $900 to $9993,806 $1,000 to $1,2492,171 $1,250 to $1,4991,573 $1,500 to $1,999162 $2,000 to $2,49973 $2,500 to $2,999292 No cash rent
Percentage of workers working in this county: 77.3%Number of people working at home: 1,693 (4.5% of all workers )
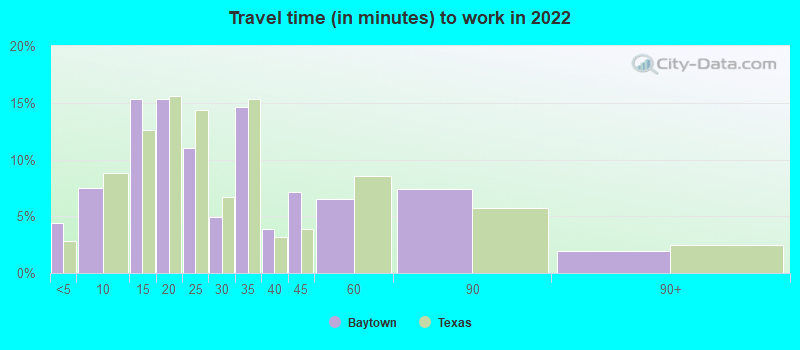
Travel time to work (commute)
Less than 5 minutes: 2,0555 to 9 minutes: 3,58010 to 14 minutes: 7,82715 to 19 minutes: 7,26020 to 24 minutes: 4,69725 to 29 minutes: 2,00930 to 34 minutes: 5,58435 to 39 minutes: 1,52940 to 44 minutes: 1,23245 to 59 minutes: 3,36460 to 89 minutes: 2,06090 or more minutes: 126
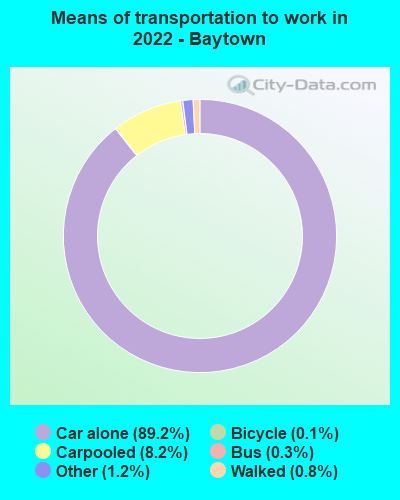
Means of transportation to work:
Drove a car alone: 38,987 (82.6%)Carpooled: 4,231 (9.0%)Bus : 135 (0.3%)Taxi: 733 (1.6%)Bicycle: 59 (0.1%)Walked: 350 (0.7%)Worked at home: 1,693 (3.6%)
Unemployment by race in 2022
Unemployment rate for White non-Hispanic residents 4.7% Males4.5% FemalesUnemployment rate for Black residents 4.3% Males5.1% FemalesUnemployment rate for American Indian and Alaska Native residents 29.9% FemalesUnemployment rate for Asian residents 13.9% FemalesUnemployment rate for other race residents 9.1% Males10.9% FemalesUnemployment rate for two or more race residents 10.4% Males5.6% FemalesUnemployment rate for Hispanic or Latino residents 5.4% Males9.2% Females
Year of entry for the foreign-born population in Baytown, Texas
3,715 2010 or later 5,009 2000 to 2009 4,589 1990 to 1999 2,637 1980 to 1989 2,504 1970 to 1979 883 Before 1970
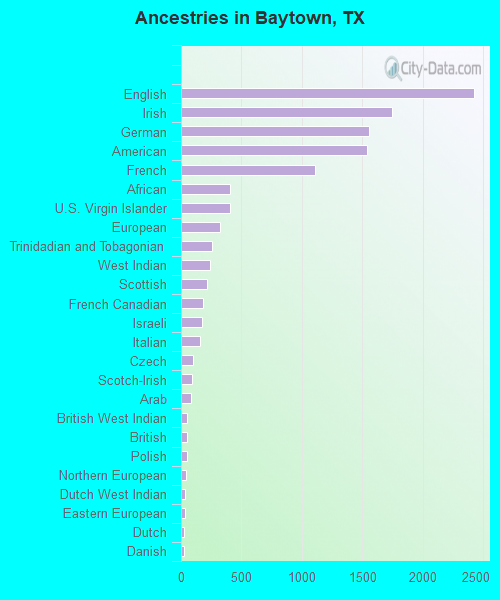
First ancestries reported:
English: 2,428 (4.5%)
Irish: 1,749 (3.3%)
German: 1,559 (2.9%)
American: 1,539 (2.9%)
French: 1,112 (2.1%)
African: 406 (0.8%)
U.S. Virgin Islander: 403 (0.8%)
European: 325 (0.6%)
Trinidadian and Tobagonian: 258 (0.5%)
West Indian: 240 (0.4%)
Scottish: 213 (0.4%)
French Canadian: 185 (0.3%)
Israeli: 171 (0.3%)
Italian: 161 (0.3%)
Czech: 100 (0.2%)
Scotch-Irish: 89 (0.2%)
Arab: 83 (0.2%)
British West Indian: 51 (0.09%)
British: 49 (0.09%)
Polish: 48 (0.09%)
Northern European: 44 (0.08%)
Dutch West Indian: 33 (0.06%)
Eastern European: 30 (0.06%)
Dutch: 26 (0.05%)
Danish: 23 (0.04%)
Nigerian: 23 (0.04%)
Welsh: 23 (0.04%)
Greek: 22 (0.04%)
Latvian: 20 (0.04%)
Swedish: 18 (0.03%)
Estonian: 16 (0.03%)
Ukrainian: 14 (0.03%)
Croatian: 11 (0.02%)
Norwegian: 10 (0.02%) Most common places of birth for foreign-born residents (%): Mexico Baytown:
71.0% (12,751)Texas:
48.4% (2,411,723)
Dominica Baytown:
3.3% (586)Texas:
0.0% (2,295)
Honduras Baytown:
3.2% (570)Texas:
3.0% (147,182)
El Salvador Baytown:
2.5% (456)Texas:
4.5% (224,455)
Other Caribbean Baytown:
2.2% (395)Texas:
0.1% (3,790)
West Indies Baytown:
2.2% (393)Texas:
0.0% (962)
Philippines Baytown:
1.8% (331)Texas:
2.1% (103,148)
Trinidad and Tobago Baytown:
1.8% (330)Texas:
0.2% (9,664)
India Baytown:
1.8% (328)Texas:
6.1% (306,347)
St. Lucia Baytown:
1.5% (278)Texas:
0.0% (1,399)
Place of birth for U.S.-born residents:
This state: 52,682Other state: 12,355Northeast: 1,250Midwest: 3,476South: 5,583West: 2,046 83.3% of Baytown residents lived in the same house 1 years ago.
Out of people who lived in different houses, 38.2% lived in this county.
Out of people who lived in different counties, 61.0% lived in Texas.
Baytown:
83.3%State average:
85.7%
Education attainment for males 25 years and older:
No schooling: 1,376Nursery to 4th grade: 1635th and 6th grade: 1,0857th and 8th grade: 9829th grade: 90810th grade: 1,29611th grade: 50012th grade, no diploma: 0High school graduate (or equivalency): 10,858Less than 1 year of college: 1,221Some college more than 1 year, no degree: 3,608Associate degree: 1,610Bachelor's degree: 2,602Master's degree: 952Professional school degree: 349Doctorate degree: 35
Education attainment for females 25 years and older:
No schooling: 1,463Nursery to 4th grade: 3665th and 6th grade: 9497th and 8th grade: 9929th grade: 89410th grade: 42811th grade: 1,45212th grade, no diploma: 417High school graduate (or equivalency): 6,434Less than 1 year of college: 1,339Some college more than 1 year, no degree: 5,738Associate degree: 2,196Bachelor's degree: 2,179Master's degree: 958Professional school degree: 143Doctorate degree: 58
Housing units in structures:
One, detached: 21,089One, attached: 321Two: 8293 or 4: 2,0755 to 9: 3,34810 to 19: 3,46920 to 49: 2,43950 or more: 1,400Mobile homes: 1,091Median worth of mobile homes: $62,200
Housing units lacking complete plumbing facilities in 2022: 2.2%Housing units lacking complete kitchen facilities in 2022: 2.8%House/condo owner moved in on average 8 years ago
Renter moved in on average 2 years ago
Private vs. public school enrollment:
Students in private schools in grades 1 to 8 (elementary and middle school): 624 Students in private schools in grades 9 to 12 (high school): 253 Students in private undergraduate colleges: 277