Bayport, NY (New York) Houses and Residents
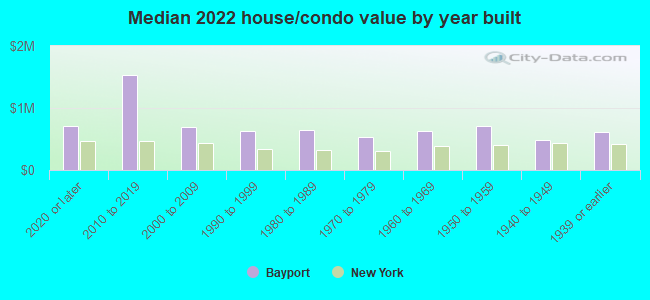
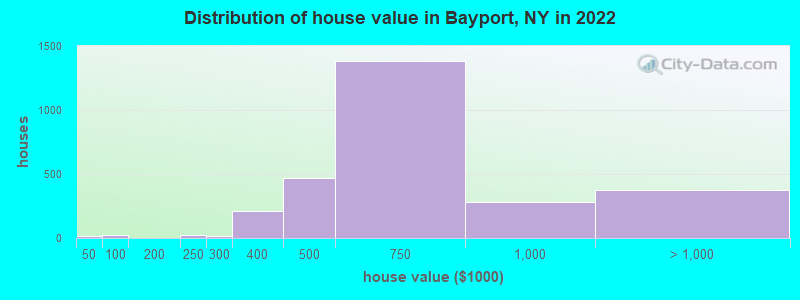
| Bayport: | $656,775 |
| New York: | $400,400 |
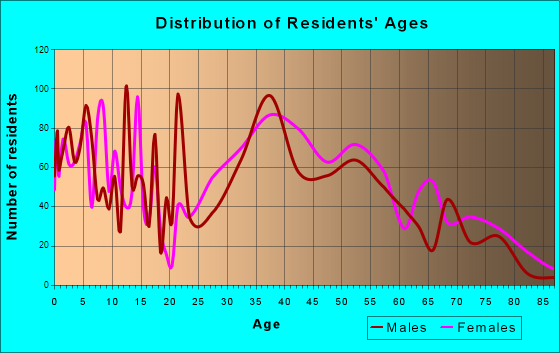
Total population: 8,896 (Urban population: 8,657, Rural population: 0)
Houses: 3,439 (3,358 occupied: 2,605 owner occupied, 751 renter occupied)
| % of renters here: | 22% |
| State: | 46% |
Housing density: 926 houses/condos per square mile
Median price asked for vacant for-sale houses and condos in 2022: $1,449,818.
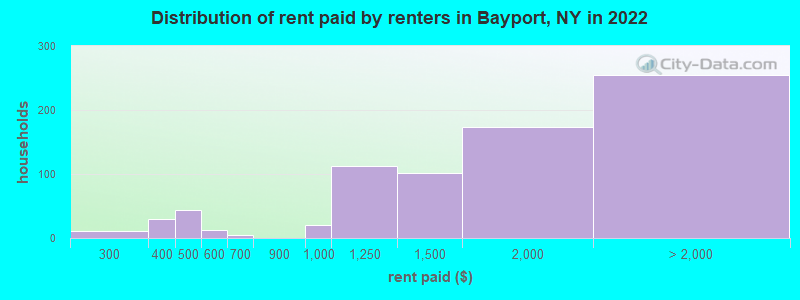
Median contract rent in 2022: $1,710 (lower quartile is $1,162, upper quartile is over $2,000)
Median rent asked for vacant for-rent units in 2022: $3,142
Median gross rent in Bayport, NY in 2022: over $2,000
Housing units in Bayport with a mortgage: 1,542 (226 second mortgage, 0 home equity loan, 210 both second mortgage and home equity loan)
Houses without a mortgage: 37
Median household income for houses/condos with a mortgage: $176,632
Median household income for apartments without a mortgage: $113,966
Median monthly housing costs: $2,391
Compare current foreclosures near Bayport, NY:
| Photo | Address | Area | Beds / Baths | Price | Details |
|---|---|---|---|---|---|

|
#1
S Snedecor Ave
Bayport, NY 11705
|
3,100 sq. feet
|
3 baths 5 beds |
show details | |

|
#2
Sylvan Ave
Bayport, NY 11705
|
- sq. feet
|
- baths - beds |
show details | |

|
#3
Laurel Ln
Shirley, NY 11967
|
1,032 sq. feet
|
1 baths 3 beds |
$479,900
|
show details |

|
#4
Greg Ln
Brentwood, NY 11717
|
1,425 sq. feet
|
2 baths 3 beds |
$519,900
|
show details |

|
#5
Houston Ct
Coram, NY 11727
|
650 sq. feet
|
1 baths 1 beds |
$219,900
|
show details |

|
#6
Albright Rd
Coram, NY 11727
|
15,246 sq. feet
|
2 baths 4 beds |
$549,900
|
show details |

|
#7
Lorring St
Patchogue, NY 11772
|
1,230 sq. feet
|
2 baths 3 beds |
$342,400
|
show details |

|
#8
Timber Ridge Dr
Commack, NY 11725
|
2,564 sq. feet
|
2 baths 4 beds |
$884,000
|
show details |

|
#9
Jillit Dr
Smithtown, NY 11787
|
1,480 sq. feet
|
1 baths 3 beds |
$775,000
|
show details |

|
#10
Bayview Ave
Patchogue, NY 11772
|
1,488 sq. feet
|
1 baths 4 beds |
$585,000
|
show details |
| Photo | Address | Area | Beds / Baths | Price | Details |
|---|---|---|---|---|---|

|
#11
Rocky Point Yaphank Rd
Rocky Point, NY 11778
|
1,000 sq. feet
|
1 baths 2 beds |
$189,900
|
show details |

|
#12
Rocky Point Yaphank Rd
Rocky Point, NY 11778
|
850 sq. feet
|
1 baths 1 beds |
$192,900
|
show details |

|
#13
Silverleaf Ln
Islandia, NY 11749
|
1,932 sq. feet
|
3 baths 3 beds |
$667,900
|
show details |

|
#14
Greenview Ct
Bayport, NY 11705
|
- sq. feet
|
- baths - beds |
show details | |

|
#15
Church St
Bayport, NY 11705
|
- sq. feet
|
- baths - beds |
show details | |

|
#16
S Snedecor Ave
Bayport, NY 11705
|
- sq. feet
|
- baths - beds |
show details | |

|
#17
Paulanna Ave
Bayport, NY 11705
|
- sq. feet
|
- baths - beds |
show details | |

|
#18
Dolores Ct
Bayport, NY 11705
|
- sq. feet
|
- baths - beds |
show details | |

|
#19
2nd Ave
Bayport, NY 11705
|
- sq. feet
|
- baths - beds |
show details | |

|
#20
Leaf Ave
Central Islip, NY 11722
|
- sq. feet
|
3 baths 5 beds |
$420,000
|
show details |
| Photo | Address | Area | Beds / Baths | Price | Details |
|---|---|---|---|---|---|

|
#21
Falcon Ave
Medford, NY 11763
|
- sq. feet
|
1 baths 3 beds |
$409,900
|
show details |

|
#22
Rocky Point Yaphank Rd Apt 146
Rocky Point, NY 11778
|
- sq. feet
|
1 baths 1 beds |
$199,900
|
show details |

|
#23
Kirby Ln
Central Islip, NY 11722
|
- sq. feet
|
1 baths 3 beds |
$395,200
|
show details |

|
#24
Meadowbrook Dr
Sound Beach, NY 11789
|
- sq. feet
|
1 baths 3 beds |
$249,900
|
show details |

|
#25
Mill Dr
Mastic Beach, NY 11951
|
- sq. feet
|
1 baths 3 beds |
$244,900
|
show details |

|
#26
Lincoln Blvd
Bay Shore, NY 11706
|
- sq. feet
|
2 baths 3 beds |
$490,000
|
show details |

|
#27
Monet Ct
Middle Island, NY 11953
|
- sq. feet
|
1 baths 1 beds |
$189,900
|
show details |

|
#28
Hayfield Ct
Commack, NY 11725
|
- sq. feet
|
1 baths 3 beds |
$603,250
|
show details |

|
#29
Clark St
Patchogue, NY 11772
|
2,929 sq. feet
|
2 baths 5 beds |
show details | |

|
#30
Pinewood Dr
Shirley, NY 11967
|
1,276 sq. feet
|
1 baths 3 beds |
show details |
| Photo | Address | Area | Beds / Baths | Price | Details |
|---|---|---|---|---|---|

|
#31
S Hillside Ave
Nesconset, NY 11767
|
2,265 sq. feet
|
3 baths 3 beds |
show details | |

|
#32
N. Thompson Drive
Islip, NY 11751
|
1,337 sq. feet
|
1 baths 3 beds |
show details | |

|
#33
Merrick St
Holtsville, NY 11742
|
2,248 sq. feet
|
2 baths 5 beds |
show details | |

|
#34
Oswego Ave
Medford, NY 11763
|
1,521 sq. feet
|
2 baths 4 beds |
show details | |

|
#35
Domino Way
Mount Sinai, NY 11766
|
2,675 sq. feet
|
3 baths 5 beds |
show details | |

|
#36
Wheeler Rd
Hauppauge, NY 11788
|
1,101 sq. feet
|
2 baths 3 beds |
show details | |

|
#37
Yerk Ave
Ronkonkoma, NY 11779
|
1,464 sq. feet
|
1 baths 2 beds |
show details | |

|
#38
Norfleet Ln
Coram, NY 11727
|
1,092 sq. feet
|
1 baths 3 beds |
show details | |

|
#39
Reed St
Hauppauge, NY 11788
|
1,730 sq. feet
|
1 baths 3 beds |
show details | |

|
#40
Avolet Ct
Mount Sinai, NY 11766
|
3,220 sq. feet
|
4 baths 5 beds |
show details |
| Photo | Address | Area | Beds / Baths | Price | Details |
|---|---|---|---|---|---|

|
#41
Spruce Ave
West Islip, NY 11795
|
3,600 sq. feet
|
5 baths 5 beds |
show details | |

|
#42
Chestnut Ave
Medford, NY 11763
|
1,106 sq. feet
|
1 baths 3 beds |
show details | |

|
#43
Vale Ct
Mount Sinai, NY 11766
|
2,070 sq. feet
|
2 baths 4 beds |
show details | |

|
#44
Oxhead Rd
Centereach, NY 11720
|
2,970 sq. feet
|
2 baths 3 beds |
show details | |

|
#45
Oak St
Centereach, NY 11720
|
2,224 sq. feet
|
2 baths 4 beds |
show details | |

|
#46
Morris Ave
Patchogue, NY 11772
|
1,207 sq. feet
|
1 baths 3 beds |
show details | |

|
#47
Weatherby Lane
Central Islip, NY 11722
|
- sq. feet
|
2 baths 2 beds |
show details | |

|
#48
B Shore Rd
Mount Sinai, NY 11766
|
3,598 sq. feet
|
3 baths 4 beds |
show details | |

|
#49
Bruce Ct
Selden, NY 11784
|
2,264 sq. feet
|
2 baths 5 beds |
show details | |

|
Check over 1 million property listings on Foreclosure.com!
|
browse all offers | |||

Latest news about housing in Bayport, NY collected exclusively by city-data.com from local newspapers, TV, and radio stations

 | How hard to rent a house no more than an hour from Patchogue hopefully much closed for tr or 1/2 yr (9 replies) |
| Best rental apartments on Long Island? (2 replies) |
| Searching for homes in LI (51 replies) |
| Apartments already skyrocketing on LI, where to go? (16 replies) |
| Bayport house purchase (possible) (9 replies) |
| "Over 55" Housing (11 replies) |
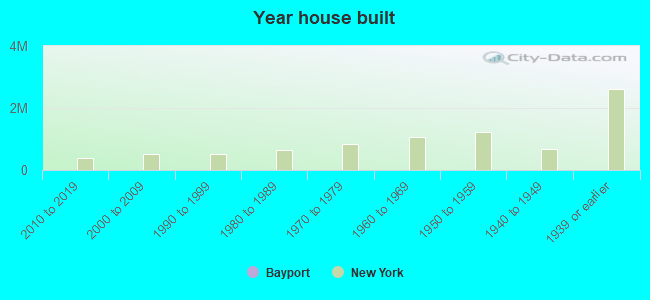
Median year apartment built: 1986
Household type by relationship:
Households: 8,923- Male householders: 1,786 (304 living alone), Female householders: 1,565 (360 living alone)
1,873 spouses (1,873 opposite-sex spouses), 152 unmarried partners, (145 opposite-sex unmarried partners), 2,890 children (2,859 natural, 19 adopted, 12 stepchildren), 102 grandchildren, 0 brothers or sisters, 90 parents, 0 foster children, 292 other relatives, 124 non-relatives
- In group quarters: 48
Size of family households: 1,184 2-persons, 807 3-persons, 426 4-persons, 144 5-persons, 39 6-persons, 18 7-or-more-persons.
Size of nonfamily households: 669 1-person, 74 2-persons.
978 married couples with children.
573 single-parent households (270 men, 303 women).
91.0% of residents of Bayport speak English at home.
3.2% of residents speak Spanish at home (87% speak English very well, 8% speak English well, 4% speak English not well).
2.6% of residents speak other Indo-European language at home (73% speak English very well, 13% speak English well, 14% speak English not well).
1.0% of residents speak Asian or Pacific Island language at home (74% speak English very well, 23% speak English well, 4% don't speak English at all).
0.5% of residents speak other language at home (100% speak English very well).
Foreign born population: 492 (5.5%)
(77.2% of them are naturalized citizens)
| Here: | 7.2 |
| State: | 6.3 |
| Here: | 3.8 |
| State: | 3.8 |
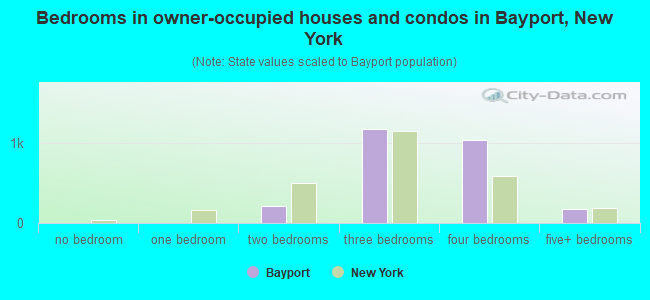
- Bedrooms in owner-occupied houses and condos in Bayport, New York
- 0no bedroom
- 51 bedroom
- 2142 bedrooms
- 1,1733 bedrooms
- 1,0414 bedrooms
- 1735+ bedrooms
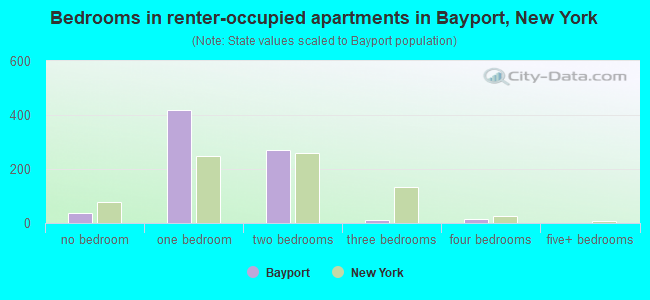
- Bedrooms in renter-occupied apartments in Bayport, New York
- 38no bedroom
- 4191 bedroom
- 2692 bedrooms
- 113 bedrooms
- 154 bedrooms
- 05+ bedrooms
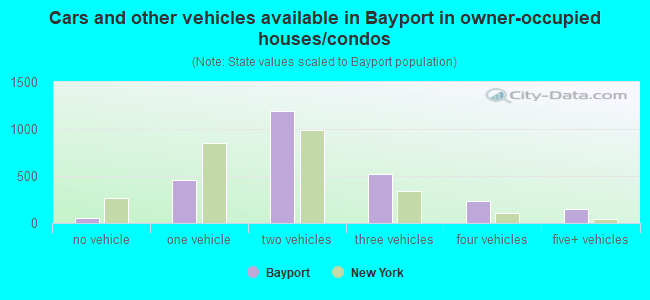
- Cars and other vehicles available in Bayport in owner-occupied houses/condos
- 49no vehicle
- 4561 vehicle
- 1,1932 vehicles
- 5253 vehicles
- 2324 vehicles
- 1505+ vehicles
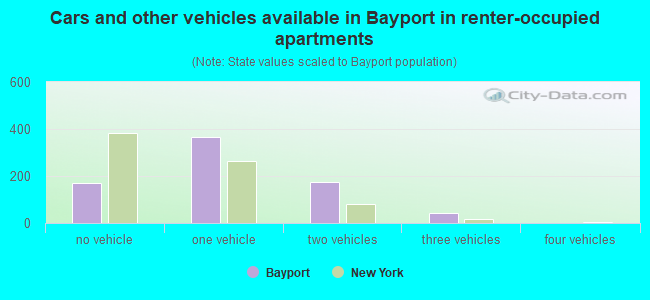
- Cars and other vehicles available in Bayport in renter-occupied apartments
- 169no vehicle
- 3661 vehicle
- 1742 vehicles
- 423 vehicles
- 04 vehicles
- 05+ vehicles
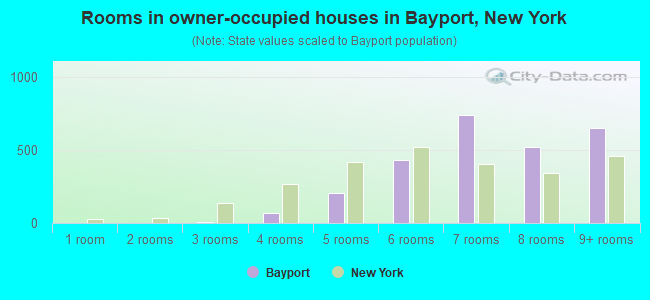
- Rooms in owner-occupied houses in Bayport, New York
- 01 room
- 02 rooms
- 53 rooms
- 664 rooms
- 2025 rooms
- 4286 rooms
- 7407 rooms
- 5178 rooms
- 6489+ rooms
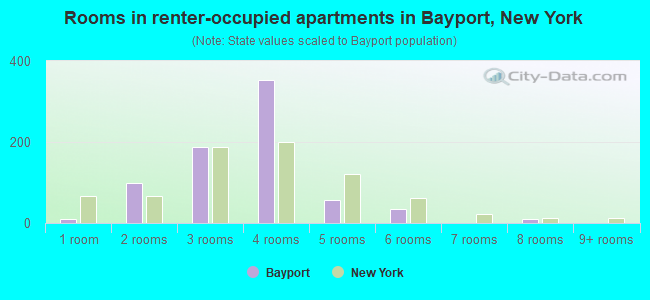
- Rooms in renter-occupied apartments in Bayport, New York
- 111 room
- 982 rooms
- 1883 rooms
- 3524 rooms
- 575 rooms
- 346 rooms
- 07 rooms
- 118 rooms
- 09+ rooms
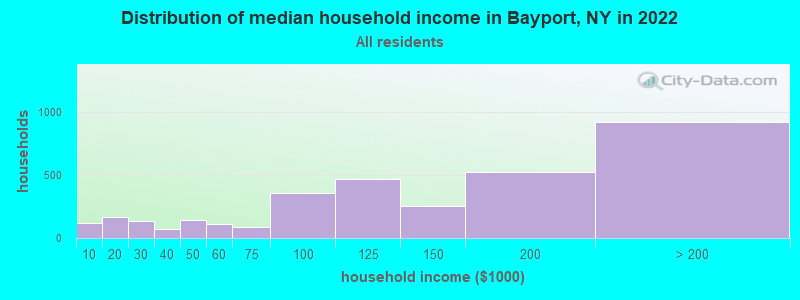
Bayport, NY household income distribution

- 123Less than $10,000
- 165$10,000 to $19,999
- 137$20,000 to $29,999
- 68$30,000 to $39,999
- 143$40,000 to $49,999
- 111$50,000 to $59,999
- 88$60,000 to $74,999
- 357$75,000 to $99,999
- 467$100,000 to $124,999
- 251$125,000 to $149,999
- 527$150,000 to $199,999
- 922$200,000 or more
Home value of owner - occupied houses in 2022 in Bayport, NY
-
- 16$40,000 to $49,999
- 8$50,000 to $59,999
- 21$200,000 to $249,999
- 12$250,000 to $299,999
- 214$300,000 to $399,999
- 464$400,000 to $499,999
- 1,383$500,000 to $749,999
- 281$750,000 to $999,999
- 275$1,000,000 to $1,499,999
- 59$1,500,000 to $1,999,999
- 38$2,000,000 or more
Rent paid by renters in 2022 in Bayport, NY
-
- 10$200 to $249
- 29$350 to $399
- 43$400 to $449
- 11$550 to $599
- 4$650 to $699
- 20$900 to $999
- 112$1,000 to $1,249
- 101$1,250 to $1,499
- 173$1,500 to $1,999
- 138$2,000 to $2,499
- 104$2,500 to $2,999
- 10No cash rent
Percentage of workers working in this county: 90.2%
Number of people working at home: 670 (14.1% of all workers)
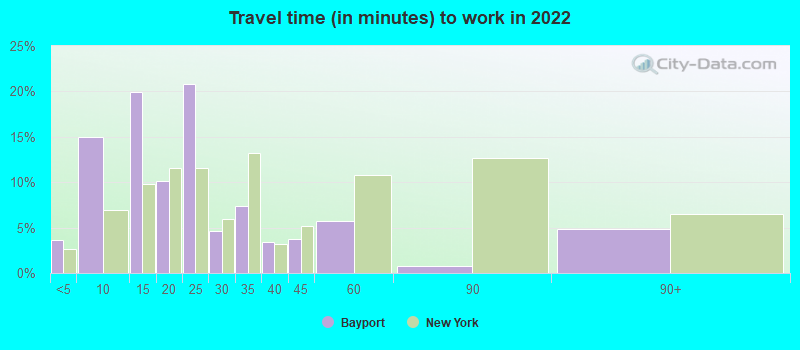
Travel time to work (commute)
- Less than 5 minutes: 176
- 5 to 9 minutes: 384
- 10 to 14 minutes: 243
- 15 to 19 minutes: 706
- 20 to 24 minutes: 610
- 25 to 29 minutes: 237
- 30 to 34 minutes: 607
- 35 to 39 minutes: 59
- 40 to 44 minutes: 84
- 45 to 59 minutes: 430
- 60 to 89 minutes: 254
- 90 or more minutes: 300
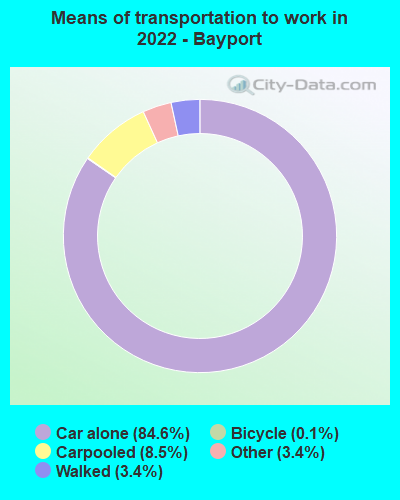
Means of transportation to work:
- Drove a car alone: 1,250 (60.4%)
- Carpooled: 143 (6.9%)
- Taxi: 61 (2.9%)
- Bicycle: 1 (0.0%)
- Walked: 53 (2.6%)
- Worked at home: 670 (32.4%)
- Unemployment by race in 2022
- Unemployment rate for White non-Hispanic residents
- 0.9%Females
- Unemployment rate for Asian residents
- 24.5%Females
- Unemployment rate for two or more race residents
- 16.1%Males
- 11.9%Females
- Unemployment rate for Hispanic or Latino residents
- 3.9%Males
- 6.8%Females
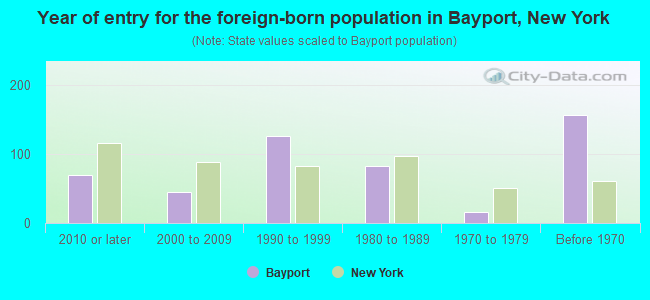
- Year of entry for the foreign-born population in Bayport, New York
- 702010 or later
- 452000 to 2009
- 1251990 to 1999
- 821980 to 1989
- 161970 to 1979
- 156Before 1970
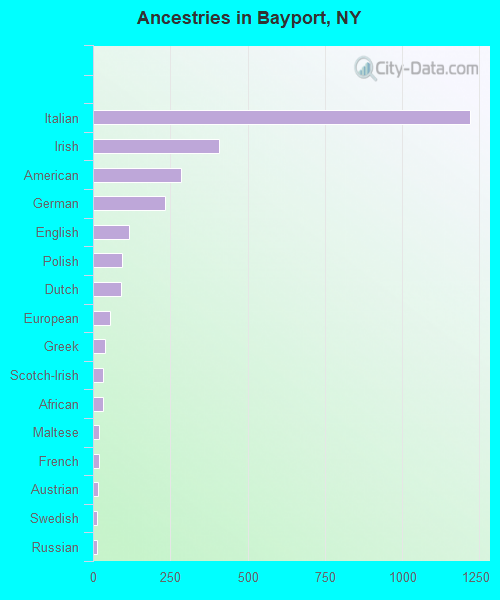
First ancestries reported:
- Italian: 1,220 (37.2%)
- Irish: 408 (12.5%)
- American: 286 (8.7%)
- German: 234 (7.1%)
- English: 116 (3.5%)
- Polish: 94 (2.9%)
- Dutch: 89 (2.7%)
- European: 55 (1.7%)
- Greek: 39 (1.2%)
- Scotch-Irish: 31 (0.9%)
- African: 31 (0.9%)
- Maltese: 21 (0.6%)
- French: 18 (0.5%)
- Austrian: 16 (0.5%)
- Swedish: 14 (0.4%)
- Russian: 13 (0.4%)
- Hungarian: 11 (0.3%)
- French Canadian: 10 (0.3%)
- Norwegian: 10 (0.3%)
- Scottish: 10 (0.3%)
- Ukrainian: 9 (0.3%)
- Guyanese: 7 (0.2%)
- Jamaican: 7 (0.2%)
- Czech: 6 (0.2%)
Most common places of birth for foreign-born residents (%):
| Bayport: | 18.5% (84) |
| New York: | 3.5% (158,432) |
| Bayport: | 9.9% (45) |
| New York: | 0.4% (19,252) |
| Bayport: | 9.9% (45) |
| New York: | 2.5% (111,920) |
| Bayport: | 7.7% (35) |
| New York: | 0.5% (23,242) |
| Bayport: | 6.2% (28) |
| New York: | 1.4% (62,442) |
| Bayport: | 5.7% (26) |
| New York: | 0.9% (38,713) |
| Bayport: | 5.1% (23) |
| New York: | 1.4% (61,245) |
| Bayport: | 4.9% (22) |
| New York: | 0.5% (22,582) |
| Bayport: | 4.6% (21) |
| New York: | 1.4% (65,102) |
| Bayport: | 2.9% (13) |
| New York: | 0.6% (26,772) |
| Bayport: | 2.9% (13) |
| New York: | 0.1% (2,334) |
| Bayport: | 2.0% (9) |
| New York: | 2.0% (91,070) |
| Bayport: | 2.0% (9) |
| New York: | 0.6% (28,604) |
| Bayport: | 1.8% (8) |
| New York: | 1.8% (81,374) |
| Bayport: | 1.8% (8) |
| New York: | 0.1% (6,415) |
| Bayport: | 1.5% (7) |
| New York: | 3.8% (172,129) |
Place of birth for U.S.-born residents:
- This state: 7,710
- Other state: 559
- Northeast: 267
- Midwest: 74
- South: 174
- West: 24
91.0% of Bayport residents lived in the same house 1 years ago.
Out of people who lived in different houses, 46.7% lived in this county.
Out of people who lived in different counties, 30.8% lived in New York.
| Bayport: | 91.0% |
| State average: | 89.6% |
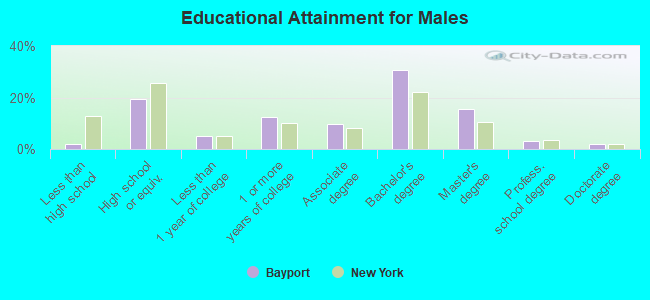
Education attainment for males 25 years and older:
- No schooling: 14
- Nursery to 4th grade: 0
- 5th and 6th grade: 0
- 7th and 8th grade: 16
- 9th grade: 0
- 10th grade: 15
- 11th grade: 4
- 12th grade, no diploma: 15
- High school graduate (or equivalency): 633
- Less than 1 year of college: 159
- Some college more than 1 year, no degree: 407
- Associate degree: 320
- Bachelor's degree: 990
- Master's degree: 509
- Professional school degree: 99
- Doctorate degree: 59
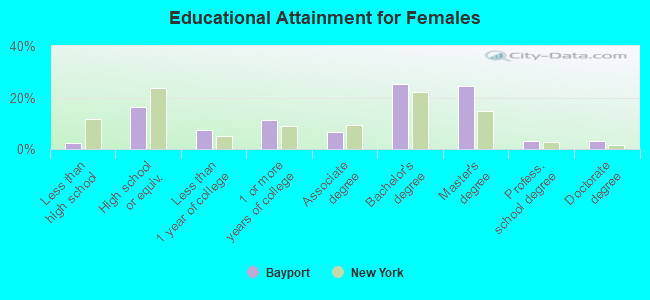
Education attainment for females 25 years and older:
- No schooling: 0
- Nursery to 4th grade: 0
- 5th and 6th grade: 0
- 7th and 8th grade: 0
- 9th grade: 3
- 10th grade: 25
- 11th grade: 22
- 12th grade, no diploma: 31
- High school graduate (or equivalency): 542
- Less than 1 year of college: 245
- Some college more than 1 year, no degree: 368
- Associate degree: 220
- Bachelor's degree: 826
- Master's degree: 802
- Professional school degree: 99
- Doctorate degree: 105


Housing units in structures:
- One, detached: 2,543
- One, attached: 268
- Two: 70
- 3 or 4: 96
- 5 to 9: 52
- 10 to 19: 226
- 20 to 49: 83
- 50 or more: 99
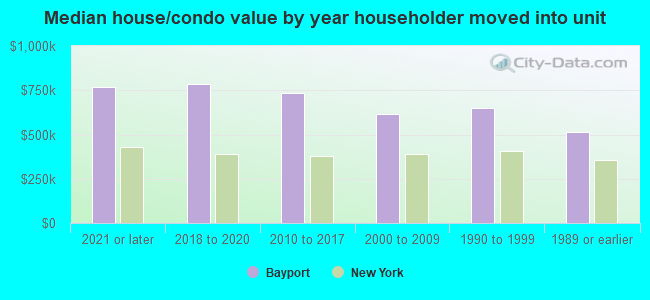
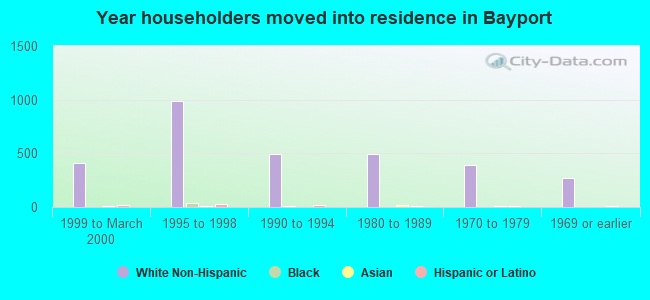
House/condo owner moved in on average 14 years ago
Renter moved in on average 2 years ago
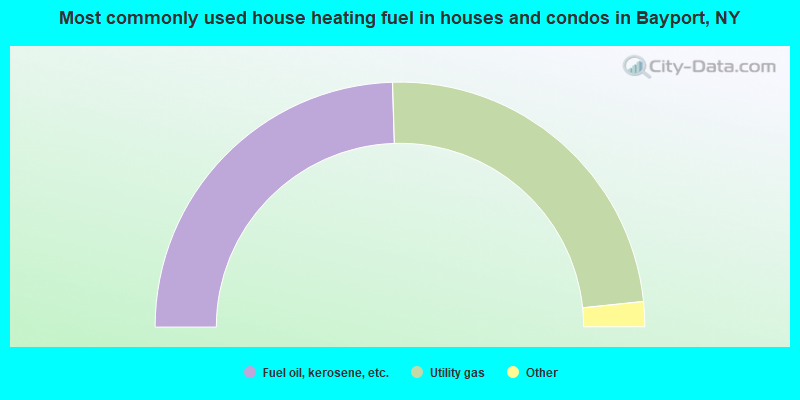
- 49.1%Fuel oil, kerosene, etc.
- 47.7%Utility gas
- 1.8%Other fuel
- 1.5%Bottled, tank, or LP gas
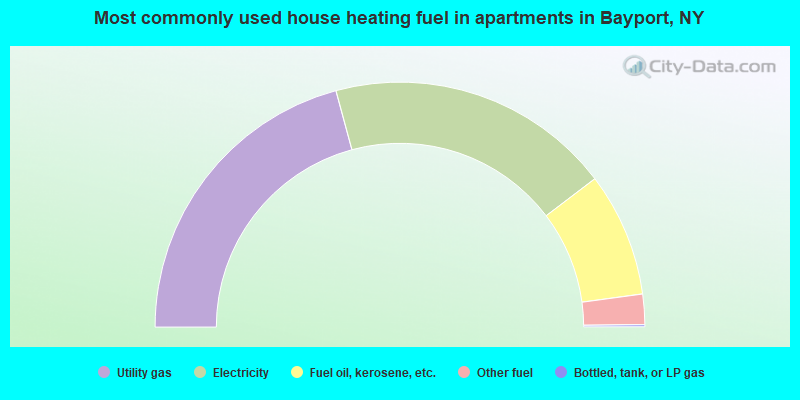
- 41.6%Utility gas
- 37.7%Electricity
- 16.4%Fuel oil, kerosene, etc.
- 4.0%Other fuel
- 0.3%Bottled, tank, or LP gas
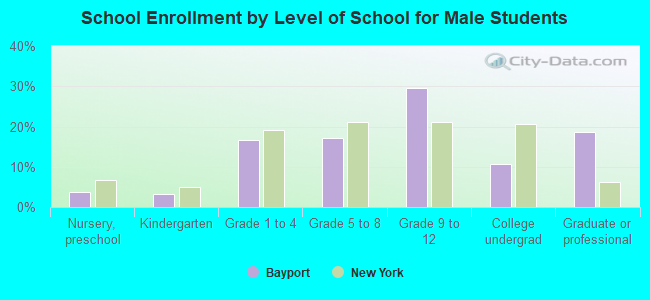
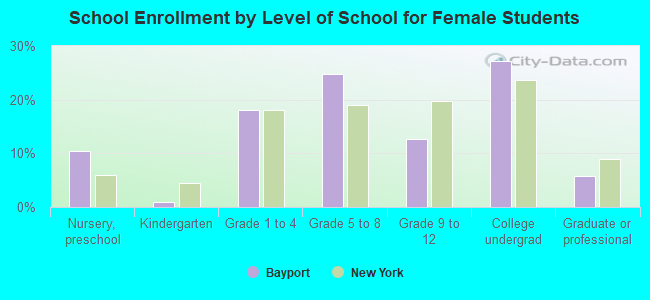
Private vs. public school enrollment:
| Here: | 4.8% |
| New York: | 15.6% |
| Here: | 3.1% |
| New York: | 15.0% |
| Here: | 35.0% |
| New York: | 39.2% |