Bayport, MN (Minnesota) Houses and Residents
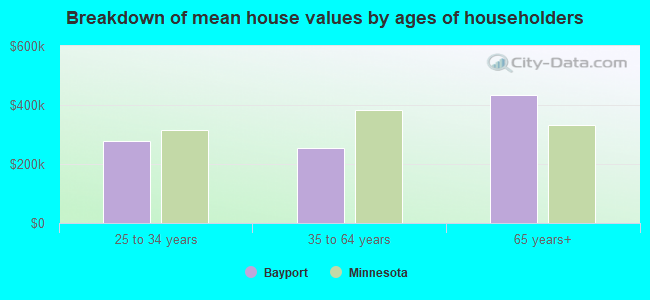
| Bayport: | $376,892 |
| Minnesota: | $314,600 |
Total population: 3,692 (Urban population: 3,154 (all inside urban clusters), Rural population: 0)
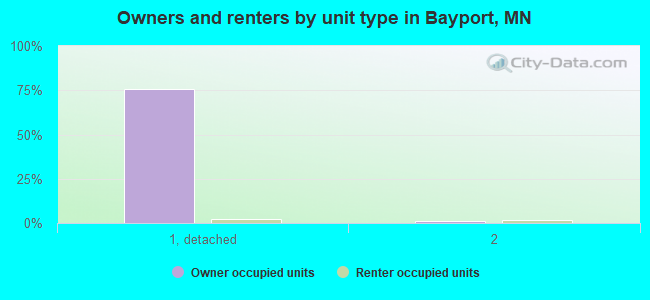
Houses: 1,216 (1,216 occupied: 1,006 owner occupied, 221 renter occupied)
| % of renters here: | 18% |
| State: | 28% |
Housing density: 669 houses/condos per square mile
Median price asked for vacant for-sale houses and condos in 2022 in this county: $276,372.
Median contract rent in 2022: $1,605 (lower quartile is $1,128, upper quartile is $1,878)
Median rent asked for vacant for-rent units in 2022: $2,359
Median gross rent in Bayport, MN in 2022: $1,666
Housing units in Bayport with a mortgage: 695 (62 second mortgage, 5 home equity loan, 50 both second mortgage and home equity loan)
Houses without a mortgage: 1
Median household income for houses/condos with a mortgage: $133,350
Median household income for apartments without a mortgage: $72,751
Median monthly housing costs: $1,768
Compare current foreclosures near Bayport, MN:
| Photo | Address | Area | Beds / Baths | Price | Details |
|---|---|---|---|---|---|

|
#1
4th St S
Bayport, MN 55003
|
1,205 sq. feet
|
2 baths 3 beds |
show details | |

|
#2
2nd Ave N
Bayport, MN 55003
|
1,008 sq. feet
|
1 baths 2 beds |
show details | |

|
#3
Granite St
Saint Paul, MN 55117
|
2,136 sq. feet
|
2 baths 4 beds |
$172,000
|
show details |

|
#4
Saint Croix Ave W
Stillwater, MN 55082
|
2,314 sq. feet
|
2 baths 2 beds |
$344,000
|
show details |

|
#5
Wacouta St Unit Unit Gl-D
Saint Paul, MN 55101
|
- sq. feet
|
1 baths 1 beds |
$179,900
|
show details |

|
#6
Wheelock Ln
Saint Paul, MN 55117
|
907 sq. feet
|
1 baths 2 beds |
show details | |

|
#7
Foothill Rd S
Cottage Grove, MN 55016
|
1,585 sq. feet
|
2 baths 4 beds |
show details | |

|
#8
Hyacinth Ave E
Saint Paul, MN 55106
|
1,183 sq. feet
|
1 baths 3 beds |
show details | |

|
#9
Jessamine Ave E
Saint Paul, MN 55106
|
1,379 sq. feet
|
1 baths 3 beds |
show details | |

|
#10
Maple St
Saint Paul, MN 55106
|
1,436 sq. feet
|
2 baths 3 beds |
show details |
| Photo | Address | Area | Beds / Baths | Price | Details |
|---|---|---|---|---|---|

|
#11
40th St N
Saint Paul, MN 55128
|
1,214 sq. feet
|
2 baths 3 beds |
show details | |

|
#12
Bradley St
Saint Paul, MN 55130
|
- sq. feet
|
2 baths 4 beds |
show details | |

|
#13
13th St
Newport, MN 55055
|
- sq. feet
|
2 baths 3 beds |
show details | |

|
#14
Arkwright St
Saint Paul, MN 55130
|
1,230 sq. feet
|
1 baths 3 beds |
show details | |

|
#15
Bedford St
Saint Paul, MN 55130
|
- sq. feet
|
1 baths 3 beds |
show details | |

|
#16
Wedgewood Dr
Saint Paul, MN 55115
|
1,256 sq. feet
|
2 baths 4 beds |
show details | |

|
#17
Geranium Ave E
Saint Paul, MN 55130
|
2,112 sq. feet
|
2 baths 6 beds |
show details | |

|
#18
Canabury Dr Apt 309
Saint Paul, MN 55117
|
1,251 sq. feet
|
2 baths 2 beds |
show details | |

|
#19
Hemingway Ave S
Cottage Grove, MN 55016
|
1,144 sq. feet
|
2 baths 3 beds |
show details | |

|
#20
Janero Ave S
Cottage Grove, MN 55016
|
1,040 sq. feet
|
1 baths 2 beds |
show details |
| Photo | Address | Area | Beds / Baths | Price | Details |
|---|---|---|---|---|---|

|
#21
Jasmine Ave S
Cottage Grove, MN 55016
|
2,738 sq. feet
|
3 baths 3 beds |
show details | |

|
#22
Hayward Rd N
Saint Paul, MN 55128
|
1,522 sq. feet
|
1 baths 3 beds |
show details | |

|
#23
Jackson St
Saint Paul, MN 55117
|
1,362 sq. feet
|
2 baths 3 beds |
show details | |

|
#24
Margaret St
Saint Paul, MN 55106
|
1,602 sq. feet
|
2 baths 3 beds |
show details | |

|
#25
Cedar St
Saint Paul, MN 55110
|
2,079 sq. feet
|
2 baths 4 beds |
show details | |

|
#26
Wilson Ave
Saint Paul, MN 55106
|
833 sq. feet
|
2 baths 2 beds |
show details | |

|
#27
Lake St
Saint Paul, MN 55119
|
1,008 sq. feet
|
2 baths 3 beds |
show details | |

|
#28
Juliet Dr
Saint Paul, MN 55125
|
1,084 sq. feet
|
2 baths 2 beds |
show details | |

|
#29
Iroquois Ave
Saint Paul, MN 55119
|
1,090 sq. feet
|
1 baths 3 beds |
show details | |

|
#30
Newbury Rd
Saint Paul, MN 55125
|
1,597 sq. feet
|
2 baths 2 beds |
show details |
| Photo | Address | Area | Beds / Baths | Price | Details |
|---|---|---|---|---|---|

|
#31
Cedar Cv
Saint Paul, MN 55110
|
1,310 sq. feet
|
1 baths 2 beds |
show details | |

|
#32
Larpenteur Ave E
Saint Paul, MN 55109
|
1,810 sq. feet
|
2 baths 3 beds |
show details | |

|
#33
Nokomis Ave
Saint Paul, MN 55119
|
1,152 sq. feet
|
2 baths 3 beds |
show details | |

|
#34
Case Ave E
Saint Paul, MN 55119
|
1,196 sq. feet
|
1 baths 2 beds |
show details | |

|
#35
White Bear Ave N
Saint Paul, MN 55110
|
1,246 sq. feet
|
2 baths 2 beds |
show details | |

|
#36
Breen St
Saint Paul, MN 55106
|
1,785 sq. feet
|
2 baths 5 beds |
show details | |

|
#37
Cope Ave E
Saint Paul, MN 55109
|
2,120 sq. feet
|
3 baths 4 beds |
show details | |

|
#38
Winnipeg Ave
Saint Paul, MN 55117
|
1,487 sq. feet
|
1 baths 3 beds |
show details | |

|
#39
Dorland Rd S
Saint Paul, MN 55119
|
1,028 sq. feet
|
2 baths 3 beds |
show details | |

|
#40
Bayhill Rd
Saint Paul, MN 55110
|
2,576 sq. feet
|
3 baths 4 beds |
show details |
| Photo | Address | Area | Beds / Baths | Price | Details |
|---|---|---|---|---|---|

|
#41
6th St E
Saint Paul, MN 55106
|
1,292 sq. feet
|
1 baths 4 beds |
show details | |

|
#42
Totem Rd
Saint Paul, MN 55119
|
1,850 sq. feet
|
2 baths 3 beds |
show details | |

|
#43
Snowshoe Ln E
Saint Paul, MN 55119
|
1,595 sq. feet
|
2 baths 3 beds |
show details | |

|
#44
Jocelyn Ave S
Cottage Grove, MN 55016
|
1,121 sq. feet
|
2 baths 3 beds |
show details | |

|
#45
Exhall Ave N
Hugo, MN 55038
|
2,580 sq. feet
|
3 baths 4 beds |
show details | |

|
#46
Margaret St
Saint Paul, MN 55106
|
1,275 sq. feet
|
1 baths 3 beds |
show details | |

|
#47
Hudson Rd
Saint Paul, MN 55106
|
2,228 sq. feet
|
2 baths 4 beds |
show details | |

|
#48
Sutherland Dr
Saint Paul, MN 55129
|
1,908 sq. feet
|
3 baths 4 beds |
show details | |

|
#49
Orange Ave E
Saint Paul, MN 55119
|
1,039 sq. feet
|
1 baths 3 beds |
show details | |

|
Check over 1 million property listings on Foreclosure.com!
|
browse all offers | |||

Latest news about housing in Bayport, MN collected exclusively by city-data.com from local newspapers, TV, and radio stations

 | Most affordable suburbs of St. Paul (17 replies) |
| Starting a licensed home daycare in Twin Cities (5 replies) |
| Talk to me about Plymouth, please (26 replies) |
| Just shifted from VA to MN (7 replies) |
| Your Top 10 Minnesota cities list (for places to live) (33 replies) |
| St. Paul's Upper Landing riverfront development (14 replies) |

Median year apartment built: 1985
Household type by relationship:
Households: 4,007- Male householders: 708 (169 living alone), Female householders: 487 (153 living alone)
659 spouses (659 opposite-sex spouses), 57 unmarried partners, (57 opposite-sex unmarried partners), 686 children (630 natural, 32 adopted, 22 stepchildren), 13 grandchildren, 10 brothers or sisters, 0 parents, 0 foster children, 20 other relatives, 97 non-relatives
- In group quarters: 1,266
Size of family households: 432 2-persons, 136 3-persons, 200 4-persons, 21 5-persons, 17 6-persons.
Size of nonfamily households: 333 1-person, 47 2-persons, 35 3-persons.
454 married couples with children.
124 single-parent households (28 men, 96 women).
91.9% of residents of Bayport speak English at home.
1.9% of residents speak Spanish at home (72% speak English very well, 11% speak English well, 18% speak English not well).
0.5% of residents speak other Indo-European language at home (79% speak English very well, 21% speak English not well).
2.5% of residents speak Asian or Pacific Island language at home (71% speak English very well, 21% speak English well, 8% speak English not well).
2.9% of residents speak other language at home (93% speak English very well, 7% speak English well).
Foreign born population: 207 (5.2%)
(74.9% of them are naturalized citizens)
| Here: | 7.1 |
| State: | 7.1 |
| Here: | 4.3 |
| State: | 3.8 |

- Bedrooms in owner-occupied houses and condos in Bayport, Minnesota
- 11no bedroom
- 131 bedroom
- 2092 bedrooms
- 4943 bedrooms
- 2284 bedrooms
- 535+ bedrooms
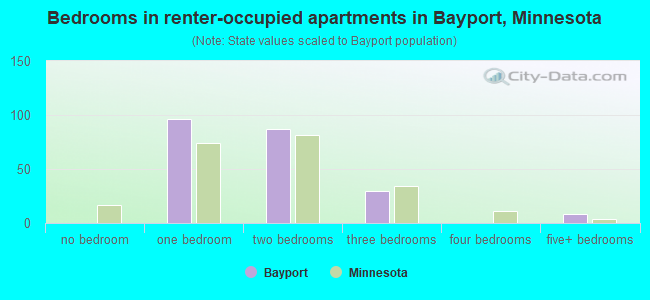
- Bedrooms in renter-occupied apartments in Bayport, Minnesota
- 0no bedroom
- 961 bedroom
- 872 bedrooms
- 303 bedrooms
- 04 bedrooms
- 85+ bedrooms
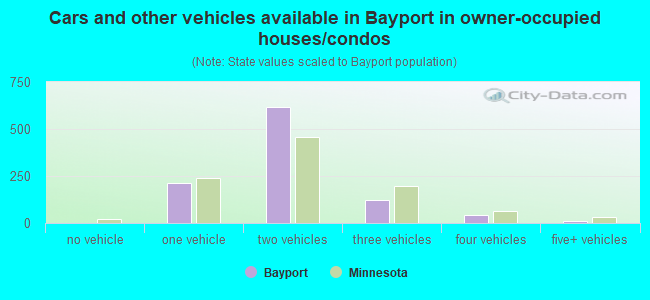
- Cars and other vehicles available in Bayport in owner-occupied houses/condos
- 0no vehicle
- 2111 vehicle
- 6172 vehicles
- 1223 vehicles
- 434 vehicles
- 135+ vehicles
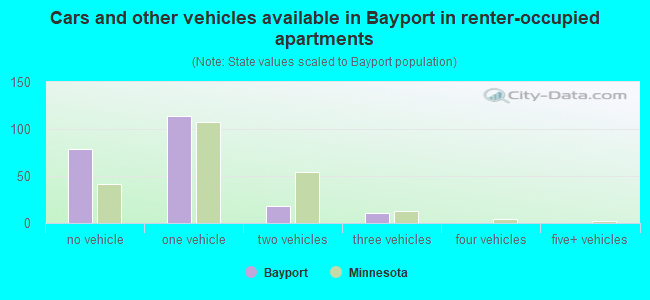
- Cars and other vehicles available in Bayport in renter-occupied apartments
- 79no vehicle
- 1141 vehicle
- 182 vehicles
- 113 vehicles
- 04 vehicles
- 05+ vehicles
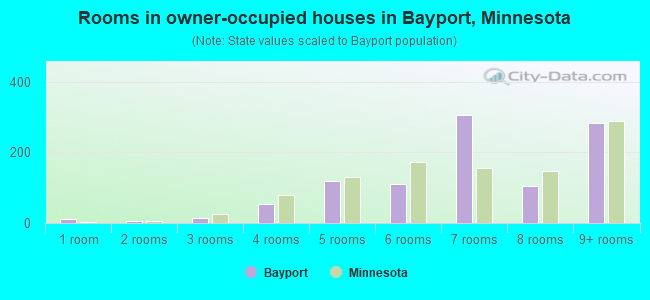
- Rooms in owner-occupied houses in Bayport, Minnesota
- 111 room
- 52 rooms
- 143 rooms
- 534 rooms
- 1195 rooms
- 1106 rooms
- 3077 rooms
- 1048 rooms
- 2849+ rooms
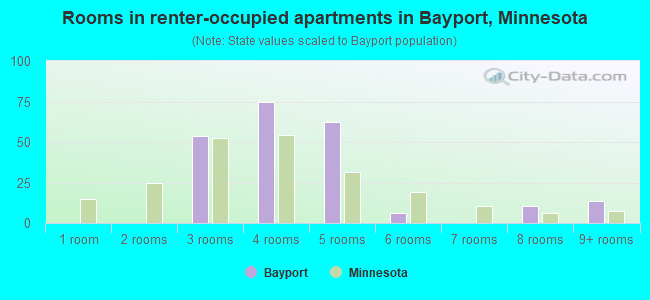
- Rooms in renter-occupied apartments in Bayport, Minnesota
- 01 room
- 02 rooms
- 543 rooms
- 754 rooms
- 625 rooms
- 66 rooms
- 07 rooms
- 118 rooms
- 149+ rooms


Bayport, MN household income distribution

- 30Less than $10,000
- 33$10,000 to $19,999
- 51$20,000 to $29,999
- 166$30,000 to $39,999
- 71$40,000 to $49,999
- 91$50,000 to $59,999
- 75$60,000 to $74,999
- 109$75,000 to $99,999
- 134$100,000 to $124,999
- 123$125,000 to $149,999
- 200$150,000 to $199,999
- 158$200,000 or more

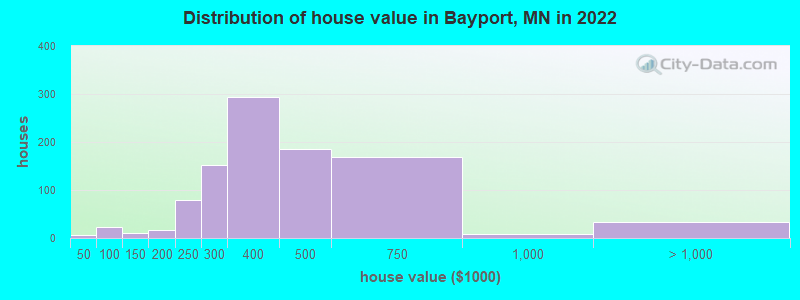
Home value of owner - occupied houses in 2022 in Bayport, MN
-
- 7$30,000 to $34,999
- 21$80,000 to $89,999
- 10$125,000 to $149,999
- 16$175,000 to $199,999
- 78$200,000 to $249,999
- 153$250,000 to $299,999
- 292$300,000 to $399,999
- 184$400,000 to $499,999
- 169$500,000 to $749,999
- 8$750,000 to $999,999
- 14$1,000,000 to $1,499,999
- 18$1,500,000 to $1,999,999
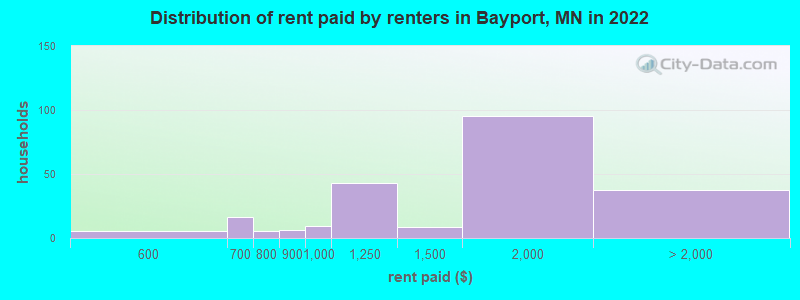
Rent paid by renters in 2022 in Bayport, MN
-
- 5$550 to $599
- 16$600 to $649
- 5$700 to $749
- 6$800 to $899
- 9$900 to $999
- 42$1,000 to $1,249
- 8$1,250 to $1,499
- 95$1,500 to $1,999
- 9$2,000 to $2,499
- 27$2,500 to $2,999
Percentage of workers working in this county: 66.7%
Number of people working at home: 265 (17.7% of all workers)
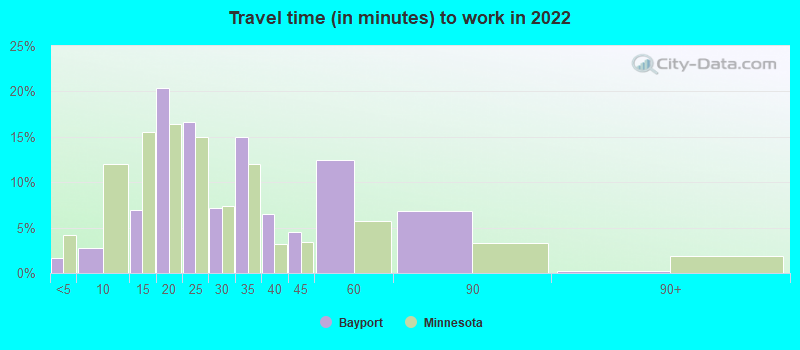
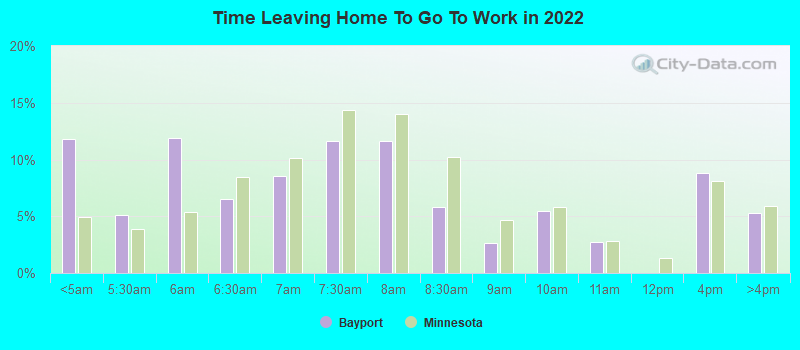
Travel time to work (commute)
- Less than 5 minutes: 16
- 5 to 9 minutes: 94
- 10 to 14 minutes: 137
- 15 to 19 minutes: 228
- 20 to 24 minutes: 103
- 25 to 29 minutes: 202
- 30 to 34 minutes: 304
- 35 to 39 minutes: 48
- 40 to 44 minutes: 12
- 45 to 59 minutes: 35
- 60 to 89 minutes: 14
- 90 or more minutes: 0
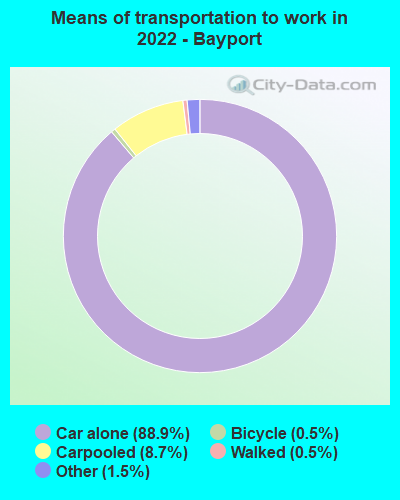
Means of transportation to work:
- Drove a car alone: 3,463 (78.1%)
- Carpooled: 316 (7.1%)
- Taxi: 72 (1.6%)
- Bicycle: 35 (0.8%)
- Walked: 14 (0.3%)
- Worked at home: 265 (6.0%)
- Unemployment by race in 2022
- Unemployment rate for White non-Hispanic residents
- 2.6%Males
- 0.4%Females
- Unemployment rate for two or more race residents
- 25.2%Females
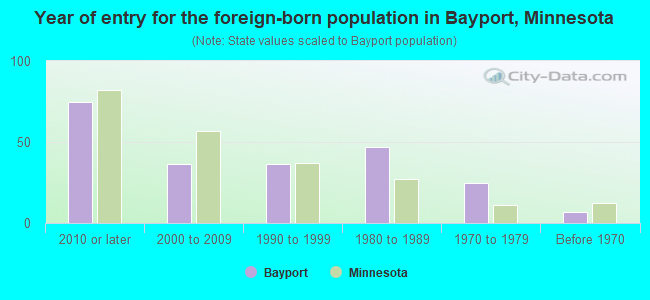
- Year of entry for the foreign-born population in Bayport, Minnesota
- 752010 or later
- 372000 to 2009
- 371990 to 1999
- 471980 to 1989
- 251970 to 1979
- 7Before 1970
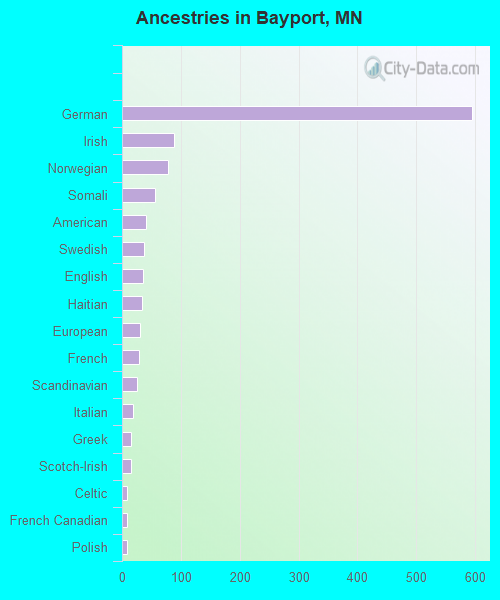
First ancestries reported:
- German: 594 (29.7%)
- Irish: 88 (4.4%)
- Norwegian: 78 (3.9%)
- Somali: 56 (2.8%)
- American: 40 (2.0%)
- Swedish: 38 (1.9%)
- English: 35 (1.7%)
- Haitian: 34 (1.7%)
- European: 31 (1.5%)
- French: 29 (1.4%)
- Scandinavian: 26 (1.3%)
- Italian: 19 (0.9%)
- Greek: 15 (0.7%)
- Scotch-Irish: 15 (0.7%)
- Celtic: 9 (0.4%)
- French Canadian: 8 (0.4%)
- Polish: 8 (0.4%)
- Czech: 4 (0.2%)
- Danish: 4 (0.2%)
- Dutch: 4 (0.2%)
- Canadian: 2 (0.10%)
Most common places of birth for foreign-born residents (%):
| Bayport: | 30.5% (53) |
| Minnesota: | 8.0% (38,461) |
| Bayport: | 11.5% (20) |
| Minnesota: | 3.8% (18,442) |
| Bayport: | 10.9% (19) |
| Minnesota: | 0.1% (327) |
| Bayport: | 8.6% (15) |
| Minnesota: | 0.9% (4,264) |
| Bayport: | 6.9% (12) |
| Minnesota: | 0.2% (872) |
| Bayport: | 5.7% (10) |
| Minnesota: | 0.5% (2,345) |
| Bayport: | 5.7% (10) |
| Minnesota: | 0.8% (4,085) |
| Bayport: | 4.6% (8) |
| Minnesota: | 3.6% (17,119) |
| Bayport: | 4.6% (8) |
| Minnesota: | 12.1% (58,312) |
| Bayport: | 2.3% (4) |
| Minnesota: | 1.4% (6,706) |
| Bayport: | 1.7% (3) |
| Minnesota: | 4.0% (19,333) |
Place of birth for U.S.-born residents:
- This state: 2,575
- Other state: 1,184
- Northeast: 63
- Midwest: 774
- South: 177
- West: 160
73.3% of Bayport residents lived in the same house 1 years ago.
Out of people who lived in different houses, 29.6% lived in this county.
Out of people who lived in different counties, 90.6% lived in Minnesota.
| Bayport: | 73.3% |
| State average: | 87.4% |
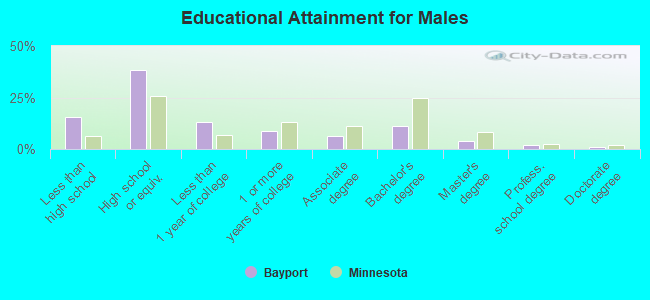
Education attainment for males 25 years and older:
- No schooling: 1
- Nursery to 4th grade: 0
- 5th and 6th grade: 22
- 7th and 8th grade: 15
- 9th grade: 0
- 10th grade: 98
- 11th grade: 95
- 12th grade, no diploma: 89
- High school graduate (or equivalency): 802
- Less than 1 year of college: 269
- Some college more than 1 year, no degree: 186
- Associate degree: 136
- Bachelor's degree: 231
- Master's degree: 84
- Professional school degree: 36
- Doctorate degree: 17
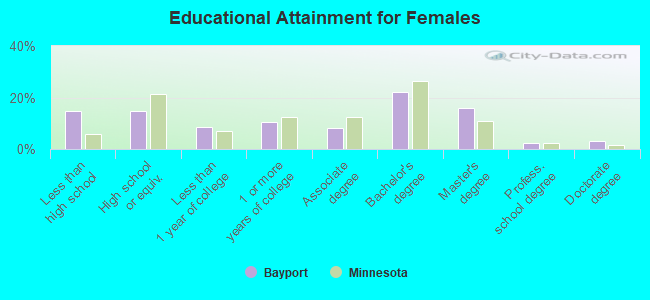
Education attainment for females 25 years and older:
- No schooling: 3
- Nursery to 4th grade: 0
- 5th and 6th grade: 0
- 7th and 8th grade: 0
- 9th grade: 0
- 10th grade: 0
- 11th grade: 0
- 12th grade, no diploma: 147
- High school graduate (or equivalency): 148
- Less than 1 year of college: 85
- Some college more than 1 year, no degree: 108
- Associate degree: 81
- Bachelor's degree: 223
- Master's degree: 163
- Professional school degree: 24
- Doctorate degree: 32


Housing units in structures:
- One, detached: 956
- One, attached: 66
- Two: 37
- 3 or 4: 31
- 5 to 9: 12
- 10 to 19: 5
- 50 or more: 106
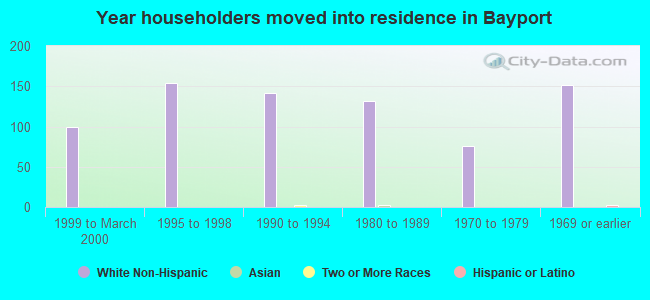
House/condo owner moved in on average 7 years ago
Renter moved in on average 3 years ago
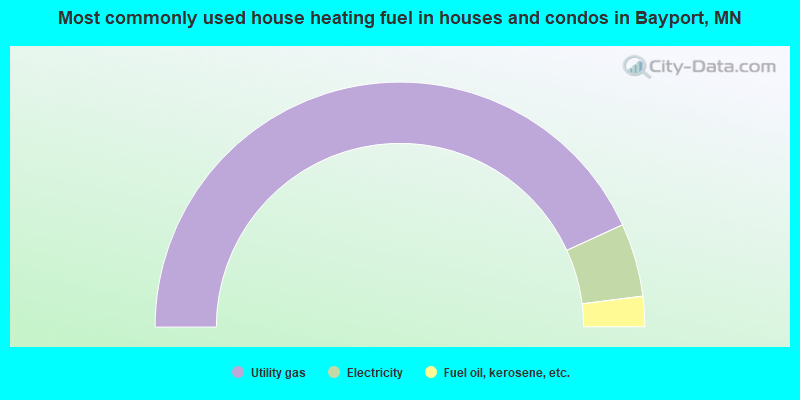
- 86.3%Utility gas
- 9.7%Electricity
- 4.0%Fuel oil, kerosene, etc.
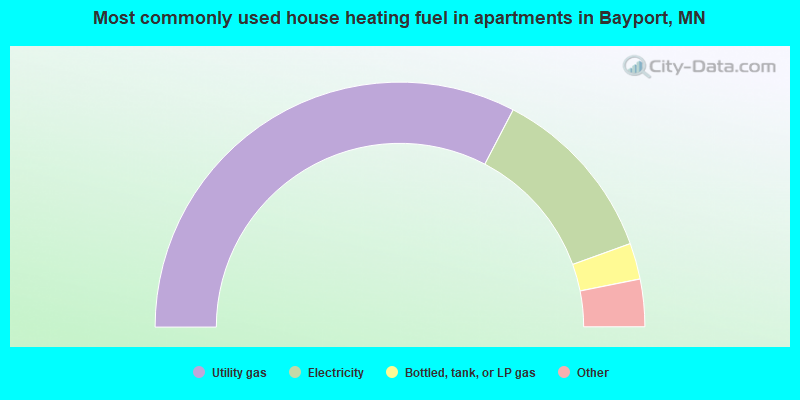
- 65.7%Utility gas
- 23.8%Electricity
- 4.8%Bottled, tank, or LP gas
- 3.3%Other fuel
- 2.4%Fuel oil, kerosene, etc.
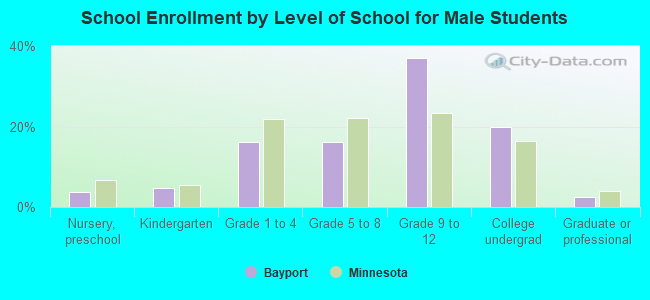
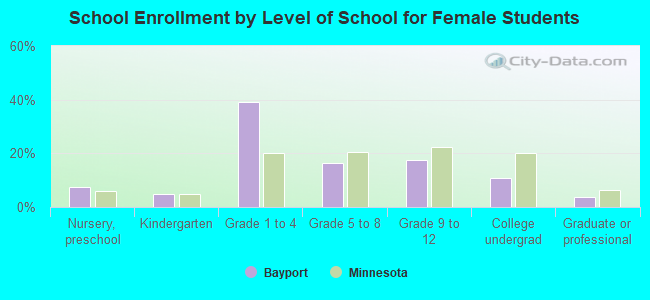
Private vs. public school enrollment:
| Here: | 26.1% |
| Minnesota: | 12.9% |
| Here: | 8.5% |
| Minnesota: | 8.6% |
| Here: | 25.4% |
| Minnesota: | 26.2% |