Jump to a detailed profile or search site with Google Custom Search

Barrington, NH (New Hampshire) Houses and Residents

Estimated median house or condo value in 2022: $393,885 (it was $127,100 in 2000)
Barrington:

$393,885
New Hampshire:

$384,700
Lower value quartile - upper value quartile: $282,860 - $492,637

Total population: 8,576 (Urban population: 0, Rural population: 7,475 (40 farm, 7,435 nonfarm))

Houses: 3,147 (2,756 occupied: 2,345 owner occupied, 411 renter occupied)

% of renters here:

15%
State:

28%

Housing density: 68 houses/condos per square mile

Median price asked for vacant for-sale houses and condos in 2022 in this county: $227,322.

Median contract rent in 2022: $1,422 (lower quartile is $1,067, upper quartile is $1,894)


Median gross rent in Barrington, NH in 2022: $1,532

Housing units in Barrington with a mortgage: 1,345 (79 second mortgage, 158 home equity loan, 0 both second mortgage and home equity loan)
Houses without a mortgage: 322

Compare current foreclosures near Barrington, NH:

Check out more offers near Barrington, NH.
Powered by Foreclosure.com


Latest news about housing in Barrington, NH collected exclusively by city-data.com from local newspapers, TV, and radio stations

Barrington, New Hampshire Age and Sex of Residents

Household type by relationship:

Households: 114,722
  • In family households: 90,890 (20,423 male householders, 9,439 female householders)
    22,797 spouses, 30,805 children (28,609 natural, 627 adopted, 1,569 stepchildren), 1,471 grandchildren, 649 brothers or sisters, 782 parents, foster children, 688 other relatives, 3,256 non-relatives
  • In nonfamily households: 23,832 (8,241 male householders (5,585 living alone)), 8,997 female householders (6,782 living alone)), 6,594 nonrelatives
  • In group quarters: 8,421 (993 institutionalized population)

18,381 married couples with children.
6,426 single-parent households (1,675 men, 4,751 women).

95.7% of residents of Barrington speak English at home.
0.5% of residents speak Spanish at home (74% speak English very well, 26% speak English not well).
2.8% of residents speak other Indo-European language at home (85% speak English very well, 5% speak English well, 11% speak English not well).
0.6% of residents speak Asian or Pacific Island language at home (45% speak English very well, 55% speak English well).
0.4% of residents speak other language at home (52% speak English very well, 48% speak English not well).

Foreign born population: 246 (2.8%)
(42.3% of them are naturalized citizens)

Median number of rooms in houses and condos:
Here:

5.1
State:

6.4

Median number of rooms in apartments
Here:

4.9
State:

4.0

Owner-occupied Renter-occupied
Bedrooms in owner-occupied houses and condos in Barrington, New Hampshire
  • Bedrooms in owner-occupied houses and condos in Barrington, New Hampshire
  • 0no bedroom
  • 1021 bedroom
  • 6062 bedrooms
  • 1,1853 bedrooms
  • 3634 bedrooms
  • 895+ bedrooms
Bedrooms in renter-occupied apartments in Barrington, New Hampshire
  • Bedrooms in renter-occupied apartments in Barrington, New Hampshire
  • 23no bedroom
  • 761 bedroom
  • 2392 bedrooms
  • 733 bedrooms
  • 04 bedrooms
  • 05+ bedrooms
Owner-occupied Renter-occupied
Cars and other vehicles available in Barrington in owner-occupied houses/condos
  • Cars and other vehicles available in Barrington in owner-occupied houses/condos
  • 24no vehicle
  • 5321 vehicle
  • 1,1852 vehicles
  • 5213 vehicles
  • 564 vehicles
  • 275+ vehicles
Cars and other vehicles available in Barrington in renter-occupied apartments
  • Cars and other vehicles available in Barrington in renter-occupied apartments
  • 27no vehicle
  • 2101 vehicle
  • 1542 vehicles
  • 103 vehicles
  • 104 vehicles
  • 05+ vehicles
Owner-occupied Renter-occupied
Rooms in owner-occupied houses in Barrington, New Hampshire
  • Rooms in owner-occupied houses in Barrington, New Hampshire
  • 01 room
  • 252 rooms
  • 583 rooms
  • 3284 rooms
  • 5185 rooms
  • 5656 rooms
  • 4207 rooms
  • 2568 rooms
  • 1759+ rooms
Rooms in renter-occupied apartments in Barrington, New Hampshire
  • Rooms in renter-occupied apartments in Barrington, New Hampshire
  • 151 room
  • 542 rooms
  • 373 rooms
  • 1834 rooms
  • 1025 rooms
  • 206 rooms
  • 07 rooms
  • 08 rooms
  • 09+ rooms
Year house built
Breakdown of mean house values by ages of householders
Owners and renters by unit type in Barrington, NH
  • Barrington, NH household income distribution

  • Distribution of median household income in Barrington, NH in 2022
  • 2,233Less than $10,000
  • 3,016$10,000 to $19,999
  • 4,016$20,000 to $29,999
  • 3,217$30,000 to $39,999
  • 5,026$40,000 to $49,999
  • 3,550$50,000 to $59,999
  • 5,893$60,000 to $74,999
  • 7,166$75,000 to $99,999
  • 6,968$100,000 to $124,999
  • 3,598$125,000 to $149,999
  • 6,222$150,000 to $199,999
  • 7,505$200,000 or more

Percentage of workers working in this county: 57.9%
Number of people working at home: 856 (17.5% of all workers)

Travel time to work (commute)

  • Less than 5 minutes: 34
  • 5 to 9 minutes: 238
  • 10 to 14 minutes: 390
  • 15 to 19 minutes: 613
  • 20 to 24 minutes: 781
  • 25 to 29 minutes: 379
  • 30 to 34 minutes: 624
  • 35 to 39 minutes: 140
  • 40 to 44 minutes: 178
  • 45 to 59 minutes: 299
  • 60 to 89 minutes: 243
  • 90 or more minutes: 79

Means of transportation to work:

  • Drove a car alone: 3,467 (82.7%)
  • Carpooled: 445 (10.6%)
  • Bus or trolley bus: 36 (0.9%)
  • Subway or elevated: 6 (0.1%)
  • Walked: 29 (0.7%)
  • Other means: 15 (0.4%)
  • Worked at home: 194 (4.6%)
Class of Workers in 2000
Year of entry for the foreign-born population in Barrington, New Hampshire
  • Year of entry for the foreign-born population in Barrington, New Hampshire
  • 501995 to March 2000
  • 201990 to 1994
  • 161985 to 1989
  • 01980 to 1984
  • 111975 to 1979
  • 01970 to 1974
  • 01965 to 1969
  • 45Before 1965
Ancestries in Barrington, NH

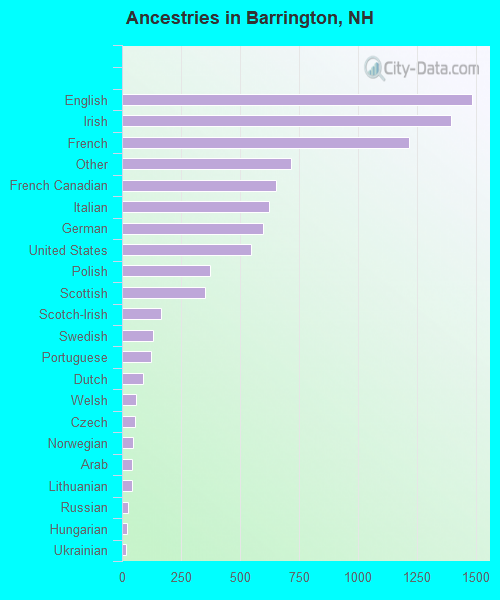
First ancestries reported:

  • English: 1,483 (16.9%)
  • Irish: 1,394 (15.8%)
  • French: 1,216 (13.8%)
  • Other: 717 (8.2%)
  • French Canadian: 654 (7.4%)
  • Italian: 622 (7.1%)
  • German: 598 (6.8%)
  • United States: 548 (6.2%)
  • Polish: 373 (4.2%)
  • Scottish: 354 (4.0%)
  • Scotch-Irish: 167 (1.9%)
  • Swedish: 131 (1.5%)
  • Portuguese: 123 (1.4%)
  • Dutch: 87 (1.0%)
  • Welsh: 61 (0.7%)
  • Czech: 56 (0.6%)
  • Norwegian: 48 (0.5%)
  • Arab: 44 (0.5%)
  • Lithuanian: 41 (0.5%)
  • Russian: 26 (0.3%)
  • Hungarian: 23 (0.3%)
  • Ukrainian: 15 (0.2%)
  • Danish: 8 (0.09%)
  • Slovak: 8 (0.09%)

Most common places of birth for foreign-born residents (%):

Korea
Barrington:

22.5% (32)
New Hampshire:

2.9% (1,582)

Canada
Barrington:

19.7% (28)
New Hampshire:

22.9% (12,397)

United Kingdom
Barrington:

12.7% (18)
New Hampshire:

8.1% (4,396)

Portugal
Barrington:

7.7% (11)
New Hampshire:

1.5% (835)

Czechoslovakia (includes Czech Republic and Slovakia)
Barrington:

7.7% (11)
New Hampshire:

0.3% (176)

Germany
Barrington:

7.0% (10)
New Hampshire:

4.9% (2,670)

Israel
Barrington:

6.3% (9)
New Hampshire:

0.2% (107)

Sweden
Barrington:

5.6% (8)
New Hampshire:

0.5% (250)

Other Northern Europe
Barrington:

5.6% (8)
New Hampshire:

0.9% (508)

Other Western Europe
Barrington:

4.9% (7)
New Hampshire:

0.6% (339)

Place of birth for U.S.-born residents:

  • This state: 3,863
  • Other state: 3,421
  • Northeast: 2,687
  • Midwest: 193
  • South: 283
  • West: 258

61% of Barrington residents lived in the same house 5 years ago.
   Out of people who lived in different houses, 46% lived in this county.
   Out of people who lived in different counties, 43% lived in New Hampshire.

Education attainment for males 25 years and older:

  • No schooling: 0
  • Nursery to 4th grade: 0
  • 5th and 6th grade: 9
  • 7th and 8th grade: 74
  • 9th grade: 52
  • 10th grade: 55
  • 11th grade: 71
  • 12th grade, no diploma: 33
  • High school graduate (or equivalency): 686
  • Less than 1 year of college: 175
  • Some college more than 1 year, no degree: 358
  • Associate degree: 299
  • Bachelor's degree: 473
  • Master's degree: 116
  • Professional school degree: 65
  • Doctorate degree: 26
Educational Attainment for Males

Education attainment for females 25 years and older:

  • No schooling: 0
  • Nursery to 4th grade: 0
  • 5th and 6th grade: 0
  • 7th and 8th grade: 9
  • 9th grade: 6
  • 10th grade: 67
  • 11th grade: 28
  • 12th grade, no diploma: 44
  • High school graduate (or equivalency): 772
  • Less than 1 year of college: 249
  • Some college more than 1 year, no degree: 342
  • Associate degree: 288
  • Bachelor's degree: 510
  • Master's degree: 152
  • Professional school degree: 20
  • Doctorate degree: 7
Educational Attainment for Females
Barrington marital status for males
Barrington marital status for females

Housing units in structures:

  • One, detached: 2,290
  • One, attached: 28
  • Two: 40
  • 3 or 4: 47
  • 5 to 9: 92
  • 10 to 19: 46
  • Mobile homes: 556
  • Boats, RVs, vans, etc.: 48

Median worth of mobile homes: $139,184

Housing units lacking complete plumbing facilities: 2.5%

Housing units lacking complete kitchen facilities: 2.0%
Year householders moved into residence in Barrington
Houses and condos Apartments
Most commonly used house heating fuel in houses and condos in Barrington, NH
  • 72.8%Fuel oil, kerosene, etc.
  • 18.7%Bottled, tank, or LP gas
  • 5.9%Wood
  • 1.9%Electricity
  • 0.4%Other fuel
  • 0.3%Coal or coke
Most commonly used house heating fuel in apartments in Barrington, NH
  • 40.1%Fuel oil, kerosene, etc.
  • 36.5%Bottled, tank, or LP gas
  • 14.1%Electricity
  • 6.1%No fuel used
  • 3.2%Utility gas

Private vs. public school enrollment:

Students in private schools in grades 1 to 8 (elementary and middle school): 40
Here:

4.0%
New Hampshire:

8.9%

Students in private schools in grades 9 to 12 (high school): 49
Here:

11.0%
New Hampshire:

10.7%

Students in private undergraduate colleges: 109
Here:

33.9%
New Hampshire:

36.4%
School Enrollment by Level of School for Male Students
School Enrollment by Level of School for Female Students
Age and Sex of Sensory-Disabled Noninstitutionalized Residents
Age and Sex of Physically-Disabled Noninstitutionalized Residents
Age and Sex of Mentally-Disabled Noninstitutionalized Residents
Age and Sex of Self-Care Disabled Noninstitutionalized Residents
Age and Sex of Go-Outside-Home Disabled Noninstitutionalized Residents
Age and Sex of Noninstitutionalized Residents with Employment Disability