Baldwin Park, CA (California) Houses and Residents
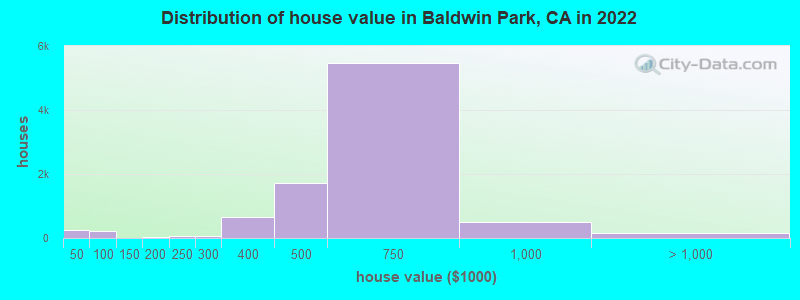
Estimated median house or condo value in 2022: $581,600 (it was $144,100 in 2000 )
Baldwin Park:
$581,600California:
$715,900
Lower value quartile - upper value quartile: $474,300 - $677,000Mean price in 2022: Detached houses: $572,866 Here:
$572,866State:
$988,808
Townhouses or other attached units: $436,207 Here:
$436,207State:
$838,546
In 3-to-4-unit structures: $303,047 Here:
$303,047State:
$824,253
In 5-or-more-unit structures: $400,851 Here:
$400,851State:
$730,996
Mobile homes: $374,780 Here:
$374,780State:
$184,506
Total population: 77,119 (Urban population: 75,753, Rural population: 0)
Houses: 19,165 (18,778 occupied: 10,287 owner occupied, 8,491 renter occupied )
% of renters here:
45%State:
44%
Housing density: 2,876 houses/condos per square mile
Median price asked for vacant for-sale houses and condos in 2022: $593,241.
Median contract rent in 2022: $1,565 (lower quartile is $1,267, upper quartile is $1,932)
Median rent asked for vacant for-rent units in 2022: $2,106
Median gross rent in Baldwin Park, CA in 2022: $1,740
Housing units in Baldwin Park with a mortgage: 7,174 (544 second mortgage, 47 home equity loan, 288 both second mortgage and home equity loan )Houses without a mortgage: 49
Median household income for houses/condos with a mortgage: $84,118
Median household income for apartments without a mortgage: $53,891
Median monthly housing costs: $1,702
Data:
Median house or condo value ($)
Median house or condo value ($ change since 2000)
Median house or condo value ($) - White
Median house or condo value ($) - Black or African American
Median house or condo value ($) - Asian
Median house or condo value ($) - Hispanic or Latino
Median house or condo value ($) - American Indian and Alaska Native
Median house or condo value ($) - Multirace
Median house or condo value ($) - Other Race
Median price asked for mobile homes ($)
Household density (households per square mile)
Mean house or condo value by units in structure - 1, detached ($)
Mean house or condo value by units in structure - 1, attached ($)
Mean house or condo value by units in structure - 2 ($)
Mean house or condo value by units in structure by units in structure - 3 or 4 ($)
Mean house or condo value by units in structure - 5 or more ($)
Mean house or condo value by units in structure - Boat, RV, van, etc. ($)
Mean house or condo value by units in structure - Mobile home ($)
Median contract rent ($)
Median contract rent - Lower quartile ($)
Median contract rent - Upper quartile ($)
Median gross rent ($)
Urban houses (%)
Rural houses (%)
Houses occupied (%)
Houses occupied (% change since 2000)
Houses owner occupied (%)
Houses owner occupied (% change since 2000)
Houses renter occupied (%)
Houses renter occupied (% change since 2000)
Vacant housing units - For rent (%)
Vacant housing units - For rent (% change since 2000)
Vacant housing units - For sale only (%)
Vacant housing units - For sale only (% change since 2000)
Vacant housing units - Rented or sold, not occupied (%)
Vacant housing units - Rented or sold, not occupied (% change since 2000)
Vacant housing units - For seasonal, recreational, or occasional use (%)
Vacant housing units - For seasonal, recreational, or occasional use (% change since 2000)
Vacant housing units - For migrant workers (%)
Vacant housing units - For migrant workers (% change since 2000)
Vacant housing units - Other vacant (%)
Vacant housing units - Other vacant (% change since 2000)
Median monthly housing costs ($)
Median household income for houses/condos with a mortgage ($)
Median household income for houses/condos without a mortgage ($)
Median household income ($)
Median household income ($) - White
Median household income ($) - Black or African American
Median household income ($) - Asian
Median household income ($) - Hispanic or Latino
Median household income ($) - American Indian and Alaska Native
Median household income ($) - Multirace
Median household income ($) - Other Race
Mortgage status - with mortgage (%)
Mortgage status - with second mortgage (%)
Mortgage status - with home equity loan (%)
Mortgage status - with both second mortgage and home equity loan (%)
Mortgage status - without a mortgage (%)
Median year house/condo built
Median year apartment built
Household type by relationship - Male householder living alone (%)
Household type by relationship - Male householder not living alone (%)
Household type by relationship - Female householder living alone (%)
Household type by relationship - Female householder not living alone (%)
Household type by relationship - Opposite-Sex spouse (%)
Household type by relationship - Same-Sex spouse (%)
Household type by relationship - Opposite-Sex unmarried partner (%)
Household type by relationship - Same-Sex unmarried partner (%)
Household type by relationship - In group quarters (%)
Size of family households - 2-person household (%)
Size of family households - 3-person household (%)
Size of family households - 4-person household (%)
Size of family households - 5-person household (%)
Size of family households - 6-person household (%)
Size of family households - 7-or-more-person household (%)
Size of nonfamily households - 1-person household (%)
Size of nonfamily households - 2-person household (%)
Size of nonfamily households - 3-person household (%)
Size of nonfamily households - 4-person household (%)
Size of nonfamily households - 5-person household (%)
Size of nonfamily households - 6-person household (%)
Size of nonfamily households - 7-or-moreperson household (%)
Year house built - Built 2010 or later (%)
Year house built - Built 2000 to 2009 (%)
Year house built - Built 1990 to 1999 (%)
Year house built - Built 1980 to 1989 (%)
Year house built - Built 1970 to 1979 (%)
Year house built - Built 1960 to 1969 (%)
Year house built - Built 1950 to 1959 (%)
Year house built - Built 1940 to 1949 (%)
Year house built - Built 1939 or earlier (%)
Median number of rooms in houses and condos
Median number of rooms in apartments
Median number of bedrooms in owner occupied houses
Mean number of bedrooms in owner occupied houses
Median number of bedrooms in renter occupied houses
Mean number of bedrooms in renter occupied houses
Median number of vehichles in owner occupied houses
Mean number of vehichles in owner occupied houses
Median number of vehichles in renter occupied houses
Mean number of vehichles in renter occupied houses
Rooms in owner-occupied houses - 1 room (%)
Rooms in owner-occupied houses - 2 rooms (%)
Rooms in owner-occupied houses - 3 rooms (%)
Rooms in owner-occupied houses - 4 rooms (%)
Rooms in owner-occupied houses - 5 rooms (%)
Rooms in owner-occupied houses - 6 rooms (%)
Rooms in owner-occupied houses - 7 rooms (%)
Rooms in owner-occupied houses - 8 rooms (%)
Rooms in owner-occupied houses - 9+ rooms (%)
Rooms in renter-occupied houses - 1 room (%)
Rooms in renter-occupied houses - 2 rooms (%)
Rooms in renter-occupied houses - 3 rooms (%)
Rooms in renter-occupied houses - 4 rooms (%)
Rooms in renter-occupied houses - 5 rooms (%)
Rooms in renter-occupied houses - 6 rooms (%)
Rooms in renter-occupied houses - 7 rooms (%)
Rooms in renter-occupied houses - 8 rooms (%)
Rooms in renter-occupied houses - 9+ rooms (%)
Bedrooms in owner-occupied houses - no bedrooms (%)
Bedrooms in owner-occupied houses - 1 bedroom (%)
Bedrooms in owner-occupied houses - 2 bedrooms (%)
Bedrooms in owner-occupied houses - 3 bedrooms (%)
Bedrooms in owner-occupied houses - 4 bedrooms (%)
Bedrooms in owner-occupied houses - 5+ bedrooms (%)
Bedrooms in renter-occupied houses - no bedrooms (%)
Bedrooms in renter-occupied houses - 1 bedroom (%)
Bedrooms in renter-occupied houses - 2 bedrooms (%)
Bedrooms in renter-occupied houses - 3 bedrooms (%)
Bedrooms in renter-occupied houses - 4 bedrooms (%)
Bedrooms in renter-occupied houses - 5+ bedrooms (%)
Vehicles available in owner-occupied houses - no vehicle available (%)
Vehicles available in owner-occupied houses - 1 vehicle available(%)
Vehicles available in owner-occupied houses - 2 Vehicles available (%)
Vehicles available in owner-occupied houses - 3 Vehicles available (%)
Vehicles available in owner-occupied houses - 4 Vehicles available (%)
Vehicles available in owner-occupied houses - 5+ Vehicles available (%)
Vehicles available in renter-occupied houses - no vehicle available (%)
Vehicles available in renter-occupied houses - 1 vehicle available (%)
Vehicles available in renter-occupied houses - 2 Vehicles available (%)
Vehicles available in renter-occupied houses - 3 Vehicles available (%)
Vehicles available in renter-occupied houses - 4 Vehicles available (%)
Vehicles available in renter-occupied houses - 5+ Vehicles available (%)
Housing units in structures - 1, detached (%)
Housing units in structures - 1, attached (%)
Housing units in structures - 2 (%)
Housing units in structures - 3 or 4 (%)
Housing units in structures - 5 to 9 (%)
Housing units in structures - 10 to 19 (%)
Housing units in structures - 20 to 49 (%)
Housing units in structures - 50 or more (%)
Housing units in structures - Mobile home (%)
Housing units in structures - Boat, RV, van, etc. (%)
Housing units in structures - Owners - 1, detached (%)
Housing units in structures - Owners - 1, attached (%)
Housing units in structures - Owners - 2 (%)
Housing units in structures - Owners - 3 or 4 (%)
Housing units in structures - Owners - 5 to 9 (%)
Housing units in structures - Owners - 10 to 19 (%)
Housing units in structures - Owners - 20 to 49 (%)
Housing units in structures - Owners - 50 or more (%)
Housing units in structures - Owners - Mobile home (%)
Housing units in structures - Owners - Boat, RV, van, etc. (%)
Housing units in structures - Renters - 1, detached (%)
Housing units in structures - Renters - 1, attached (%)
Housing units in structures - Renters - 2 (%)
Housing units in structures - Renters - 3 or 4 (%)
Housing units in structures - Renters - 5 to 9 (%)
Housing units in structures - Renters - 10 to 19 (%)
Housing units in structures - Renters - 20 to 49 (%)
Housing units in structures - Renters - 50 or more (%)
Housing units in structures - Renters - Mobile home (%)
Housing units in structures - Renters - Boat, RV, van, etc. (%)
House/condo owner moved in on average (years ago)
Renter moved in on average (years ago)
Year householder moved into unit - Moved in 1999 to March 2000 (%)
Year householder moved into unit - Moved in 1999 to March 2000 (%) - White
Year householder moved into unit - Moved in 1999 to March 2000 (%) - Black or African American
Year householder moved into unit - Moved in 1999 to March 2000 (%) - Asian
Year householder moved into unit - Moved in 1999 to March 2000 (%) - Hispanic or Latino
Year householder moved into unit - Moved in 1999 to March 2000 (%) - American Indian and Alaska Native
Year householder moved into unit - Moved in 1999 to March 2000 (%) - Multirace
Year householder moved into unit - Moved in 1999 to March 2000 (%) - Other Race
Year householder moved into unit - Moved in 1995 to 1998 (%)
Year householder moved into unit - Moved in 1995 to 1998 (%) - White
Year householder moved into unit - Moved in 1995 to 1998 (%) - Black or African American
Year householder moved into unit - Moved in 1995 to 1998 (%) - Asian
Year householder moved into unit - Moved in 1995 to 1998 (%) - Hispanic or Latino
Year householder moved into unit - Moved in 1995 to 1998 (%) - American Indian and Alaska Native
Year householder moved into unit - Moved in 1995 to 1998 (%) - Multirace
Year householder moved into unit - Moved in 1995 to 1998 (%) - Other Race
Year householder moved into unit - Moved in 1990 to 1994 (%)
Year householder moved into unit - Moved in 1990 to 1994 (%) - White
Year householder moved into unit - Moved in 1990 to 1994 (%) - Black or African American
Year householder moved into unit - Moved in 1990 to 1994 (%) - Asian
Year householder moved into unit - Moved in 1990 to 1994 (%) - Hispanic or Latino
Year householder moved into unit - Moved in 1990 to 1994 (%) - American Indian and Alaska Native
Year householder moved into unit - Moved in 1990 to 1994 (%) - Multirace
Year householder moved into unit - Moved in 1990 to 1994 (%) - Other Race
Year householder moved into unit - Moved in 1980 to 1989 (%)
Year householder moved into unit - Moved in 1980 to 1989 (%) - White
Year householder moved into unit - Moved in 1980 to 1989 (%) - Black or African American
Year householder moved into unit - Moved in 1980 to 1989 (%) - Asian
Year householder moved into unit - Moved in 1980 to 1989 (%) - Hispanic or Latino
Year householder moved into unit - Moved in 1980 to 1989 (%) - American Indian and Alaska Native
Year householder moved into unit - Moved in 1980 to 1989 (%) - Multirace
Year householder moved into unit - Moved in 1980 to 1989 (%) - Other Race
Year householder moved into unit - Moved in 1970 to 1979 (%)
Year householder moved into unit - Moved in 1970 to 1979 (%) - White
Year householder moved into unit - Moved in 1970 to 1979 (%) - Black or African American
Year householder moved into unit - Moved in 1970 to 1979 (%) - Asian
Year householder moved into unit - Moved in 1970 to 1979 (%) - Hispanic or Latino
Year householder moved into unit - Moved in 1970 to 1979 (%) - American Indian and Alaska Native
Year householder moved into unit - Moved in 1970 to 1979 (%) - Multirace
Year householder moved into unit - Moved in 1970 to 1979 (%) - Other Race
Year householder moved into unit - Moved in 1969 or earlier (%)
Year householder moved into unit - Moved in 1969 or earlier (%) - White
Year householder moved into unit - Moved in 1969 or earlier (%) - Black or African American
Year householder moved into unit - Moved in 1969 or earlier (%) - Asian
Year householder moved into unit - Moved in 1969 or earlier (%) - Hispanic or Latino
Year householder moved into unit - Moved in 1969 or earlier (%) - American Indian and Alaska Native
Year householder moved into unit - Moved in 1969 or earlier (%) - Multirace
Year householder moved into unit - Moved in 1969 or earlier (%) - Other Race
Housing units lacking complete plumbing facilities (%)
Housing units lacking complete kitchen facilities (%)
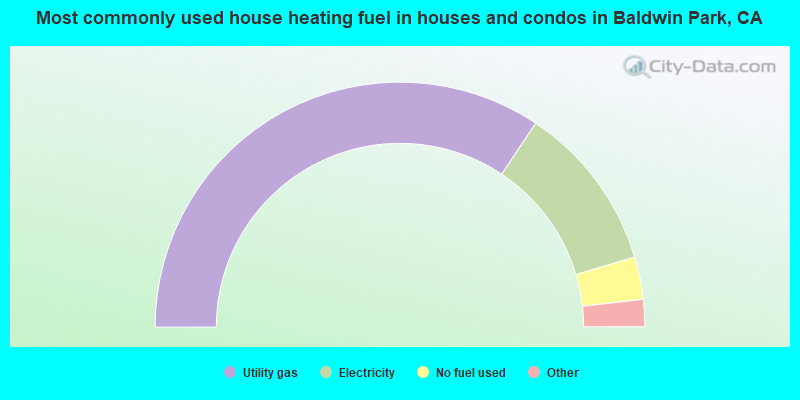
House heating fuel used in houses and condos - Utility gas (%)
House heating fuel used in houses and condos - Bottled, tank, or LP gas (%)
House heating fuel used in houses and condos - Electricity (%)
House heating fuel used in houses and condos - Fuel oil, kerosene, etc. (%)
House heating fuel used in houses and condos - Coal or coke (%)
House heating fuel used in houses and condos - Wood (%)
House heating fuel used in houses and condos - Solar energy (%)
House heating fuel used in houses and condos - Other fuel (%)
House heating fuel used in houses and condos - No fuel used (%)
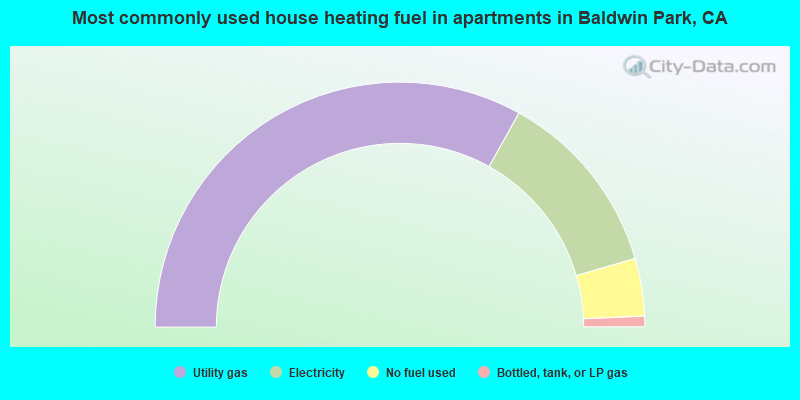
House heating fuel used in apartments - Utility gas (%)
House heating fuel used in apartments - Bottled, tank, or LP gas (%)
House heating fuel used in apartments - Electricity (%)
House heating fuel used in apartments - Fuel oil, kerosene, etc. (%)
House heating fuel used in apartments - Coal or coke (%)
House heating fuel used in apartments - Wood (%)
House heating fuel used in apartments - Solar energy (%)
House heating fuel used in apartments - Other fuel (%)
House heating fuel used in apartments - No fuel used (%)
Median year house/condo built: 1962Median year apartment built: 1969Household type by relationship:
Households: 69,450
Male householders: 9,915 (1,275 living alone ), Female householders: 8,863 (1,136 living alone )8,776 spouses (8,659 opposite-sex spouses ), 2,189 unmarried partners , (1,983 opposite-sex unmarried partners ), 23,218 children (21,935 natural , 476 adopted , 807 stepchildren ), 3,025 grandchildren , 2,411 brothers or sisters , 4,097 parents , 0 foster children , 4,636 other relatives , 1,765 non-relatives In group quarters: 555
Size of family households: 3,682 2-persons , 3,284 3-persons , 3,569 4-persons , 2,784 5-persons , 1,681 6-persons , 991 7-or-more-persons .
Size of nonfamily households: 2,411 1-person , 256 2-persons , 65 3-persons , 55 4-persons .
6,276 married couples with children. single-parent households (2,394 men , 2,087 women ).
19.9% of residents of Baldwin Park speak English at home. of residents speak Spanish at home (57% speak English very well , 14% speak English well , 16% speak English not well , 14% don't speak English at all ).of residents speak other Indo-European language at home (35% speak English very well , 37% speak English well , 28% speak English not well ).of residents speak Asian or Pacific Island language at home (37% speak English very well , 23% speak English well , 26% speak English not well , 14% don't speak English at all ).of residents speak other language at home (53% speak English very well , 24% speak English well , 24% speak English not well ).
Foreign born population: 29,304 (42.2%)of them are naturalized citizens )
Median number of rooms in houses and condos:
Median number of rooms in apartments
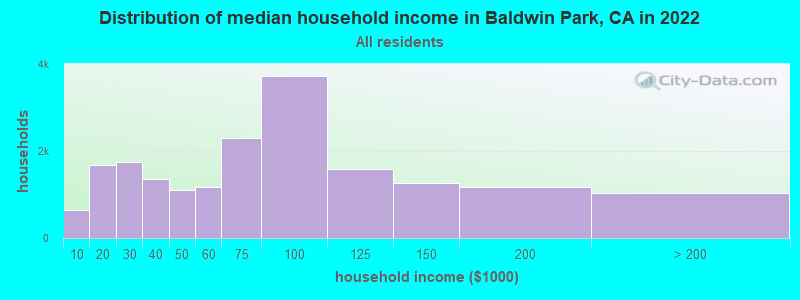
Baldwin Park, CA household income distribution 653 Less than $10,0001,670 $10,000 to $19,9991,753 $20,000 to $29,9991,359 $30,000 to $39,9991,104 $40,000 to $49,9991,167 $50,000 to $59,9992,309 $60,000 to $74,9993,715 $75,000 to $99,9991,586 $100,000 to $124,9991,261 $125,000 to $149,9991,165 $150,000 to $199,9991,036 $200,000 or more
Home value of owner - occupied houses in 2022 in Baldwin Park, CA 166 Less than $10,0003 $15,000 to $19,99927 $20,000 to $24,9995 $25,000 to $29,99911 $30,000 to $34,99932 $40,000 to $49,99954 $50,000 to $59,99945 $60,000 to $69,99922 $70,000 to $79,99960 $80,000 to $89,99919 $90,000 to $99,9999 $150,000 to $174,99932 $175,000 to $199,99948 $200,000 to $249,99968 $250,000 to $299,999664 $300,000 to $399,9991,726 $400,000 to $499,9995,461 $500,000 to $749,999504 $750,000 to $999,99985 $1,000,000 to $1,499,99962 $1,500,000 to $1,999,9994 $2,000,000 or moreRent paid by renters in 2022 in Baldwin Park, CA 36 Less than $100109 $200 to $24975 $250 to $29948 $300 to $34963 $400 to $44927 $450 to $49965 $500 to $54923 $550 to $59912 $600 to $64935 $650 to $69913 $700 to $74910 $750 to $799117 $800 to $899218 $900 to $999781 $1,000 to $1,2491,212 $1,250 to $1,4993,019 $1,500 to $1,999998 $2,000 to $2,499239 $2,500 to $2,99979 $3,000 to $3,49911 $3,500 or more353 No cash rent
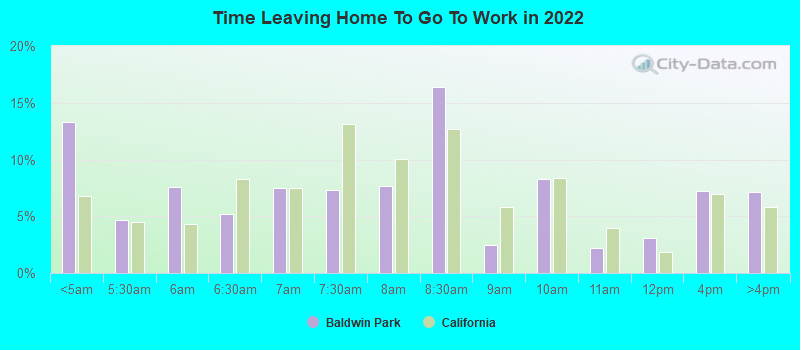
Percentage of workers working in this county: 89.5%Number of people working at home: 1,998 (6.0% of all workers )
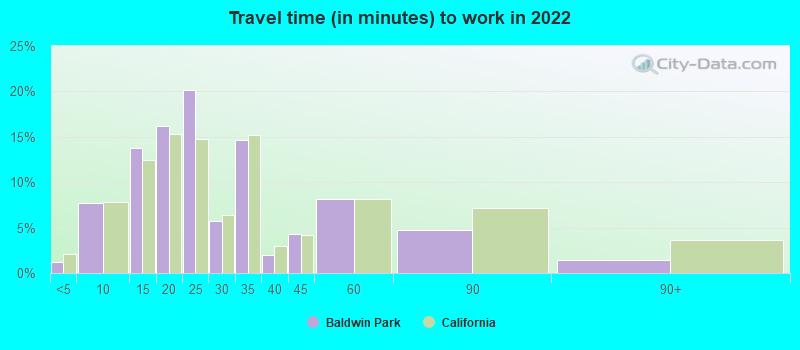
Travel time to work (commute)
Less than 5 minutes: 2475 to 9 minutes: 1,73710 to 14 minutes: 4,86915 to 19 minutes: 6,29020 to 24 minutes: 3,77925 to 29 minutes: 1,59330 to 34 minutes: 4,03535 to 39 minutes: 28440 to 44 minutes: 1,34445 to 59 minutes: 2,45460 to 89 minutes: 2,75190 or more minutes: 683
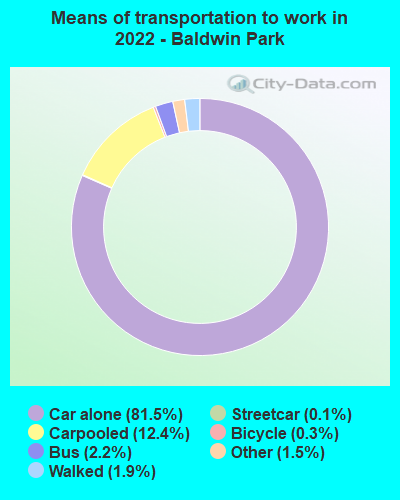
Means of transportation to work:
Drove a car alone: 15,515 (71.8%)Carpooled: 2,612 (12.1%)Bus : 380 (1.8%)Subway or elevated rail : 18 (0.1%)Light rail, streetcar or trolley : 5 (0.0%)Taxi: 315 (1.5%)Bicycle: 62 (0.3%)Walked: 389 (1.8%)Worked at home: 1,998 (9.2%)
Unemployment by race in 2022
Unemployment rate for White non-Hispanic residents 0.5% Males1.9% FemalesUnemployment rate for Black residents 3.4% Males36.4% FemalesUnemployment rate for American Indian and Alaska Native residents 2.9% Males5.8% FemalesUnemployment rate for Asian residents 4.6% Males9.3% FemalesUnemployment rate for other race residents 4.1% Males3.8% FemalesUnemployment rate for two or more race residents 3.6% Males4.0% FemalesUnemployment rate for Hispanic or Latino residents 5.1% Males4.8% Females
Year of entry for the foreign-born population in Baldwin Park, California
3,952 2010 or later 5,910 2000 to 2009 6,991 1990 to 1999 11,829 1980 to 1989 9,270 1970 to 1979 3,494 Before 1970
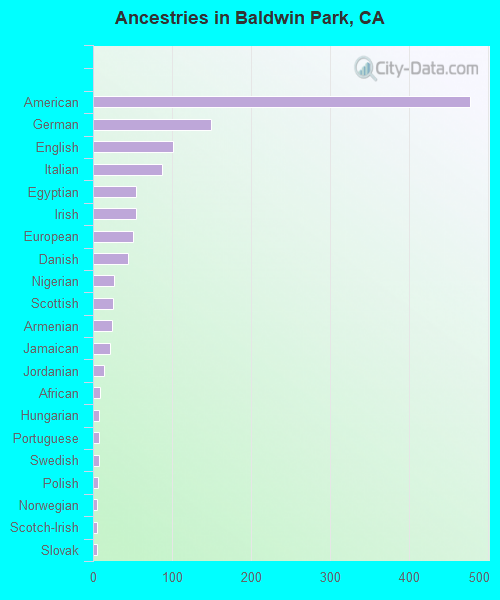
First ancestries reported:
American: 478 (0.9%)
German: 149 (0.3%)
English: 101 (0.2%)
Italian: 88 (0.2%)
Egyptian: 55 (0.1%)
Irish: 55 (0.1%)
European: 51 (0.10%)
Danish: 44 (0.09%)
Nigerian: 26 (0.05%)
Scottish: 25 (0.05%)
Armenian: 24 (0.05%)
Jamaican: 22 (0.04%)
Jordanian: 14 (0.03%)
African: 9 (0.02%)
Hungarian: 8 (0.02%)
Portuguese: 8 (0.02%)
Swedish: 7 (0.01%)
Polish: 6 (0.01%)
Norwegian: 5 (0.01%)
Scotch-Irish: 5 (0.01%)
Slovak: 5 (0.01%)
Scandinavian: 3 (0.01%) Most common places of birth for foreign-born residents (%): Mexico Baldwin Park:
50.3% (15,600)California:
37.2% (3,881,193)
China, excluding Hong Kong and Taiwan Baldwin Park:
12.1% (3,756)California:
6.6% (684,672)
Vietnam Baldwin Park:
9.7% (3,006)California:
4.9% (512,335)
Philippines Baldwin Park:
6.7% (2,089)California:
7.8% (818,297)
El Salvador Baldwin Park:
5.7% (1,779)California:
4.2% (440,287)
Guatemala Baldwin Park:
3.0% (946)California:
2.8% (290,436)
Nicaragua Baldwin Park:
1.7% (541)California:
0.6% (58,161)
Taiwan Baldwin Park:
1.6% (493)California:
1.7% (176,274)
Place of birth for U.S.-born residents:
This state: 37,618Other state: 1,746Northeast: 117Midwest: 184South: 851West: 594 96.1% of Baldwin Park residents lived in the same house 1 years ago.
Out of people who lived in different houses, 44.3% lived in this county.
Out of people who lived in different counties, 51.5% lived in California.
Baldwin Park:
96.1%State average:
88.9%
Education attainment for males 25 years and older:
No schooling: 2,011Nursery to 4th grade: 3905th and 6th grade: 1,1837th and 8th grade: 8399th grade: 26710th grade: 23811th grade: 23012th grade, no diploma: 1,833High school graduate (or equivalency): 7,399Less than 1 year of college: 510Some college more than 1 year, no degree: 2,592Associate degree: 1,191Bachelor's degree: 2,443Master's degree: 462Professional school degree: 134Doctorate degree: 97
Education attainment for females 25 years and older:
No schooling: 2,427Nursery to 4th grade: 7945th and 6th grade: 1,9727th and 8th grade: 3959th grade: 32310th grade: 21711th grade: 48112th grade, no diploma: 981High school graduate (or equivalency): 6,740Less than 1 year of college: 769Some college more than 1 year, no degree: 3,927Associate degree: 1,181Bachelor's degree: 2,605Master's degree: 386Professional school degree: 263Doctorate degree: 44
Housing units in structures:
One, detached: 13,016One, attached: 1,767Two: 1403 or 4: 9075 to 9: 29010 to 19: 33820 to 49: 1,34650 or more: 951Mobile homes: 410Median worth of mobile homes: $71,450
Housing units lacking complete kitchen facilities in 2022: 0.9%House/condo owner moved in on average 16 years ago
Renter moved in on average 8 years ago
Private vs. public school enrollment:
Students in private schools in grades 1 to 8 (elementary and middle school): 135 Here:
2.1%California:
10.5%
Students in private schools in grades 9 to 12 (high school): 97 Students in private undergraduate colleges: 1,085 Here:
21.5%California:
15.9%