Housing density: 1,197 houses/condos per square mile
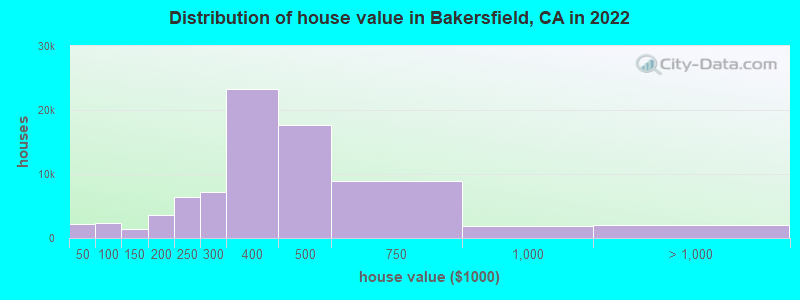
Median price asked for vacant for-sale houses and condos in 2022: $327,539.
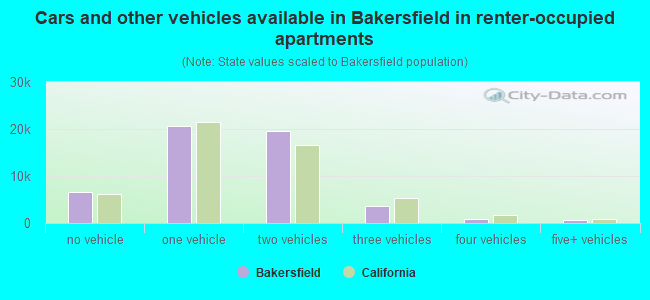
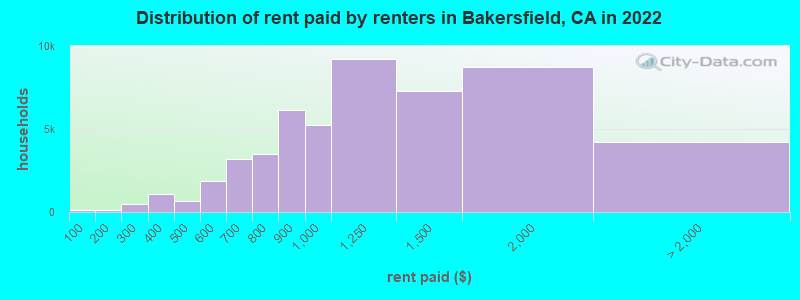
Median contract rent in 2022: $1,072 (lower quartile is $825, upper quartile is $1,455)
Median rent asked for vacant for-rent units in 2022: $2,007
Median gross rent in Bakersfield, CA in 2022: $1,365
Housing units in Bakersfield with a mortgage: 56,337 (2,258 second mortgage, 237 home equity loan, 1,416 both second mortgage and home equity loan) Houses without a mortgage: 436
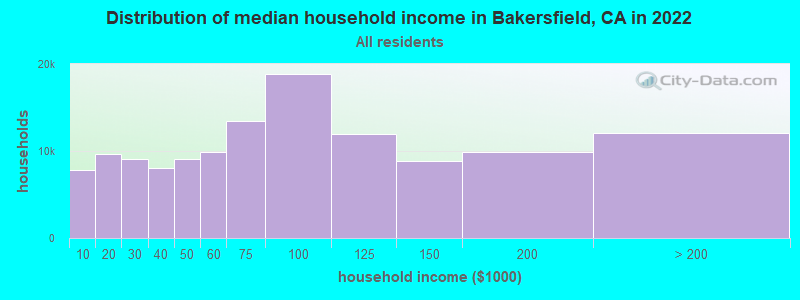
Median household income for houses/condos with a mortgage: $98,748
Median household income for apartments without a mortgage: $71,337
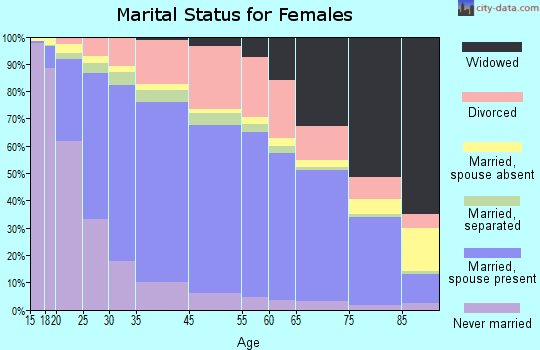
71,167 married couples with children.
37,022 single-parent households (11,957 men, 25,065 women).
54.9% of residents of Bakersfield speak English at home.
36.1% of residents speak Spanish at home (70% speak English very well, 13% speak English well, 12% speak English not well, 6% don't speak English at all).
3.5% of residents speak other Indo-European language at home (67% speak English very well, 12% speak English well, 16% speak English not well, 6% don't speak English at all).
4.1% of residents speak Asian or Pacific Island language at home (78% speak English very well, 11% speak English well, 9% speak English not well, 2% don't speak English at all).
1.4% of residents speak other language at home (55% speak English very well, 30% speak English well, 13% speak English not well, 1% don't speak English at all).
Foreign born population: 82,872 (20.2%)
(47.8% of them are naturalized citizens)
Percentage of workers working in this county: 96.8% Number of people working at home: 13,312 (7.7% of all workers)
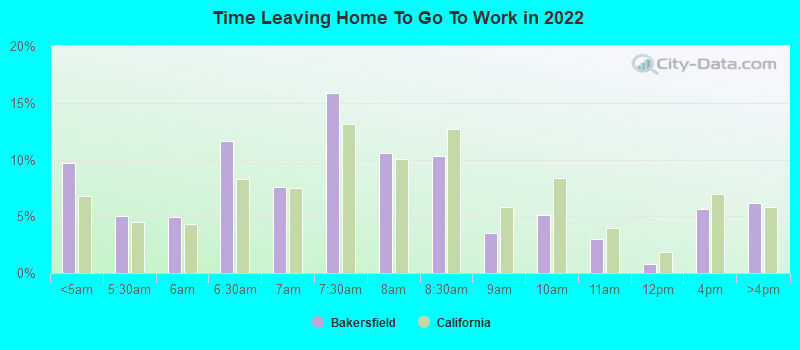
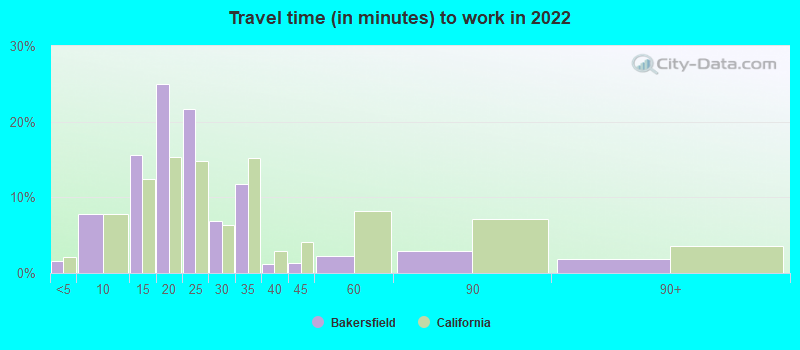
Travel time to work (commute)
Less than 5 minutes: 1,975
5 to 9 minutes: 12,861
10 to 14 minutes: 23,832
15 to 19 minutes: 39,485
20 to 24 minutes: 33,757
25 to 29 minutes: 10,639
30 to 34 minutes: 19,470
35 to 39 minutes: 1,903
40 to 44 minutes: 2,691
45 to 59 minutes: 3,621
60 to 89 minutes: 5,185
90 or more minutes: 3,832
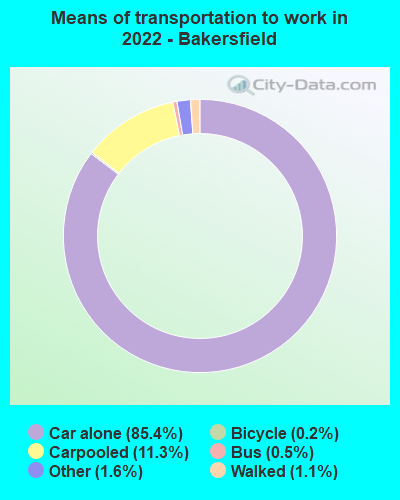
Means of transportation to work:
Drove a car alone: 142,918 (79.1%)
Carpooled: 18,836 (10.4%)
Bus: 808 (0.4%)
Taxi: 2,608 (1.4%)
Bicycle: 252 (0.1%)
Walked: 1,862 (1.0%)
Worked at home: 13,312 (7.4%)
Unemployment by race in 2022
Unemployment rate for White non-Hispanic residents
5.0%Males
5.2%Females
Unemployment rate for Black residents
21.6%Males
14.5%Females
Unemployment rate for American Indian and Alaska Native residents
6.4%Males
2.6%Females
Unemployment rate for Asian residents
2.5%Males
2.4%Females
Unemployment rate for other race residents
8.1%Males
8.8%Females
Unemployment rate for two or more race residents
7.9%Males
8.1%Females
Unemployment rate for Hispanic or Latino residents
7.9%Males
7.6%Females
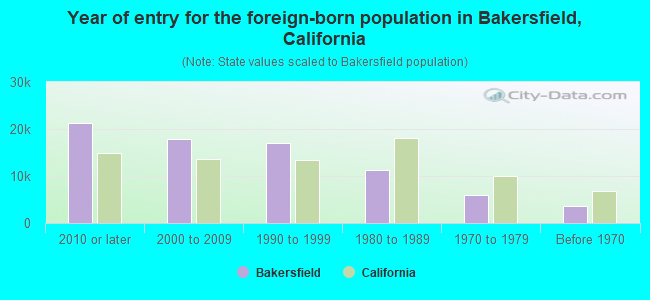
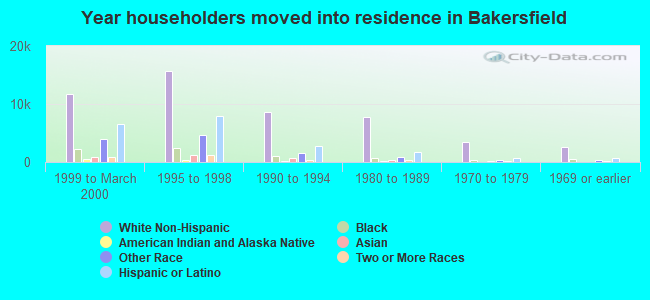
Year of entry for the foreign-born population in Bakersfield, California
21,1712010 or later
17,7662000 to 2009
17,0171990 to 1999
11,2891980 to 1989
6,0221970 to 1979
3,535Before 1970
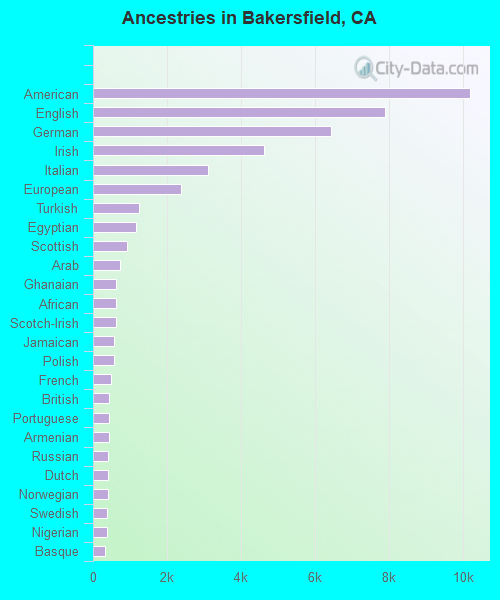
First ancestries reported:
American: 10,194 (3.9%)
English: 7,886 (3.0%)
German: 6,444 (2.5%)
Irish: 4,629 (1.8%)
Italian: 3,101 (1.2%)
European: 2,366 (0.9%)
Turkish: 1,233 (0.5%)
Egyptian: 1,171 (0.4%)
Scottish: 923 (0.4%)
Arab: 727 (0.3%)
Ghanaian: 630 (0.2%)
African: 624 (0.2%)
Scotch-Irish: 623 (0.2%)
Jamaican: 575 (0.2%)
Polish: 560 (0.2%)
French: 489 (0.2%)
British: 441 (0.2%)
Portuguese: 432 (0.2%)
Armenian: 430 (0.2%)
Russian: 403 (0.2%)
Dutch: 400 (0.2%)
Norwegian: 393 (0.1%)
Swedish: 382 (0.1%)
Nigerian: 366 (0.1%)
Basque: 316 (0.1%)
Jordanian: 278 (0.1%)
Danish: 278 (0.1%)
Ugandan: 269 (0.1%)
Iranian: 269 (0.1%)
Scandinavian: 242 (0.09%)
Northern European: 240 (0.09%)
Belizean: 235 (0.09%)
Canadian: 186 (0.07%)
Greek: 167 (0.06%)
Welsh: 166 (0.06%)
French Canadian: 157 (0.06%)
Syrian: 136 (0.05%)
Brazilian: 134 (0.05%)
Palestinian: 126 (0.05%)
Romanian: 118 (0.04%)
Hungarian: 101 (0.04%)
Eastern European: 88 (0.03%)
Lebanese: 86 (0.03%)
Swiss: 83 (0.03%)
Belgian: 78 (0.03%)
Haitian: 75 (0.03%)
Afghan: 72 (0.03%)
Ukrainian: 70 (0.03%)
Croatian: 68 (0.03%)
Lithuanian: 63 (0.02%)
West Indian: 56 (0.02%)
Serbian: 53 (0.02%)
Ethiopian: 46 (0.02%)
Yugoslavian: 25 (0.01%)
Finnish: 24 (0.01%)
Czech: 17 (0.01%)
Pennsylvania German: 15 (0.01%)
Trinidadian and Tobagonian: 15 (0.01%)
Most common places of birth for foreign-born residents (%):
Mexico
Bakersfield:
53.3% (42,242)
California:
37.2% (3,881,193)
India
Bakersfield:
10.1% (7,999)
California:
5.2% (539,184)
Philippines
Bakersfield:
7.4% (5,857)
California:
7.8% (818,297)
El Salvador
Bakersfield:
4.8% (3,777)
California:
4.2% (440,287)
Guatemala
Bakersfield:
2.0% (1,580)
California:
2.8% (290,436)
China, excluding Hong Kong and Taiwan
Bakersfield:
1.7% (1,338)
California:
6.6% (684,672)
Honduras
Bakersfield:
1.6% (1,306)
California:
0.6% (66,590)
Vietnam
Bakersfield:
1.6% (1,262)
California:
4.9% (512,335)
Place of birth for U.S.-born residents:
This state: 282,712
Other state: 39,418
Northeast: 4,355
Midwest: 10,803
South: 13,213
West: 11,047
90.6% of Bakersfield residents lived in the same house 1 years ago. Out of people who lived in different houses, 43.8% lived in this county. Out of people who lived in different counties, 76.0% lived in California.
Bakersfield:
90.6%
State average:
88.9%
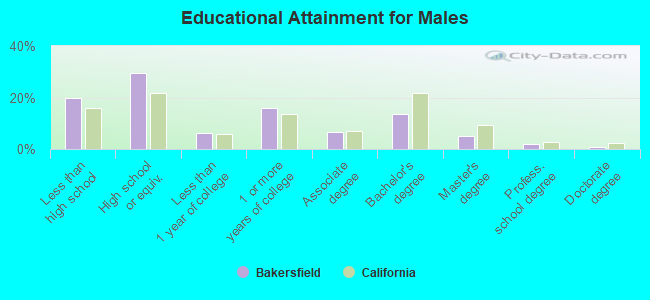
Education attainment for males 25 years and older:
No schooling: 5,228
Nursery to 4th grade: 1,628
5th and 6th grade: 3,080
7th and 8th grade: 3,211
9th grade: 1,541
10th grade: 1,756
11th grade: 1,626
12th grade, no diploma: 6,246
High school graduate (or equivalency): 36,071
Less than 1 year of college: 7,825
Some college more than 1 year, no degree: 19,642
Associate degree: 8,159
Bachelor's degree: 16,596
Master's degree: 6,072
Professional school degree: 2,444
Doctorate degree: 1,152
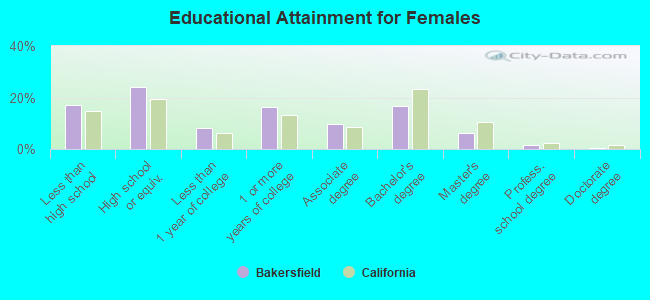
Education attainment for females 25 years and older:
No schooling: 5,013
Nursery to 4th grade: 1,548
5th and 6th grade: 2,748
7th and 8th grade: 2,484
9th grade: 1,646
10th grade: 2,106
11th grade: 1,484
12th grade, no diploma: 4,759
High school graduate (or equivalency): 30,793
Less than 1 year of college: 10,201
Some college more than 1 year, no degree: 20,835
Associate degree: 12,179
Bachelor's degree: 21,251
Master's degree: 7,862
Professional school degree: 1,886
Doctorate degree: 370
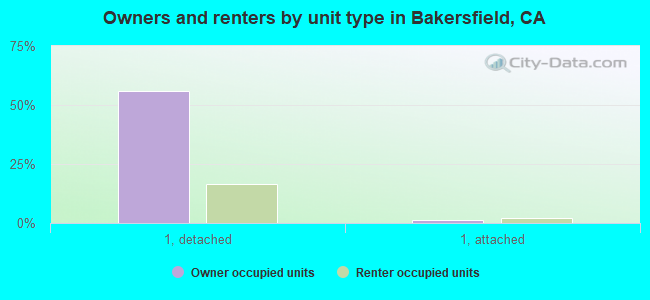
Housing units in structures:
One, detached: 94,841
One, attached: 4,711
Two: 2,108
3 or 4: 10,133
5 to 9: 4,676
10 to 19: 3,541
20 to 49: 2,867
50 or more: 7,358
Mobile homes: 4,905
Boats, RVs, vans, etc.: 223
Median worth of mobile homes: $74,200
Housing units lacking complete plumbing facilities in 2022: 0.6%
Housing units lacking complete kitchen facilities in 2022: 2.4%
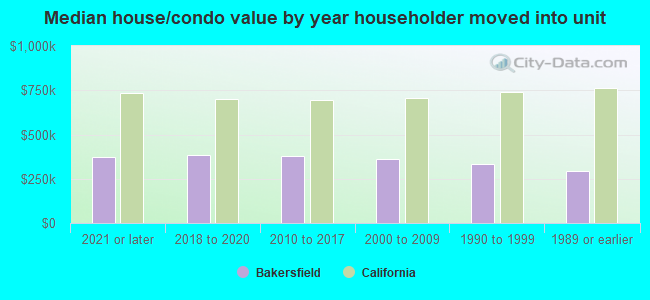
House/condo owner moved in on average 10 years ago