Babylon, NY (New York) Houses and Residents
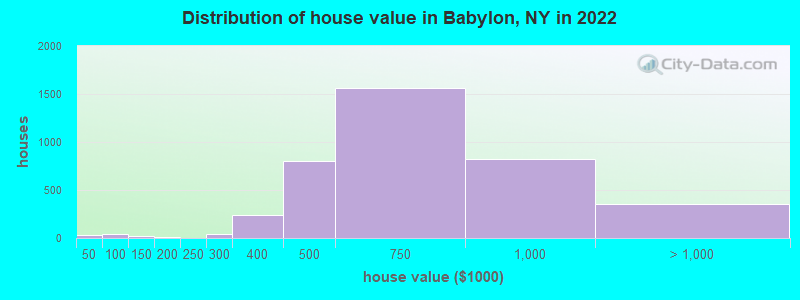
Estimated median house or condo value in 2022: $651,882 (it was $207,300 in 2000 )
Babylon:
$651,882New York:
$400,400
Lower value quartile - upper value quartile: $486,613 - $805,655Mean price in 2022: Detached houses: $668,915 Here:
$668,915State:
$476,719
Townhouses or other attached units: $645,653 Here:
$645,653State:
$699,270
In 3-to-4-unit structures: $446,350 Here:
$446,350State:
$764,568
In 5-or-more-unit structures: $385,680 Here:
$385,680State:
$912,009
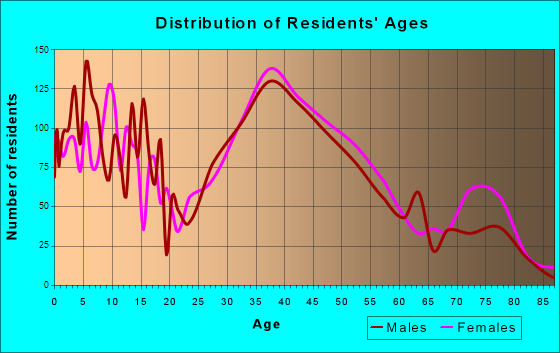
Total population: 12,172 (All urban)
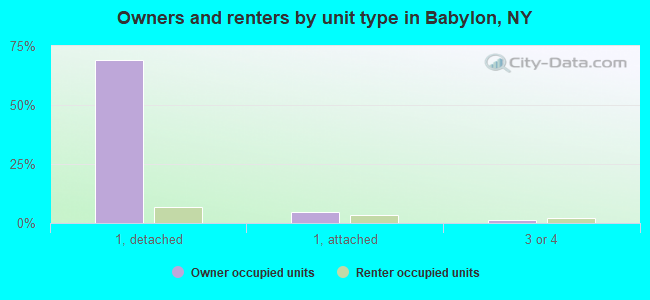
Houses: 4,911 (4,689 occupied: 3,688 owner occupied, 999 renter occupied )
% of renters here:
21%State:
46%
Housing density: 2,035 houses/condos per square mile
Median price asked for vacant for-sale houses and condos in 2022: $625,712.
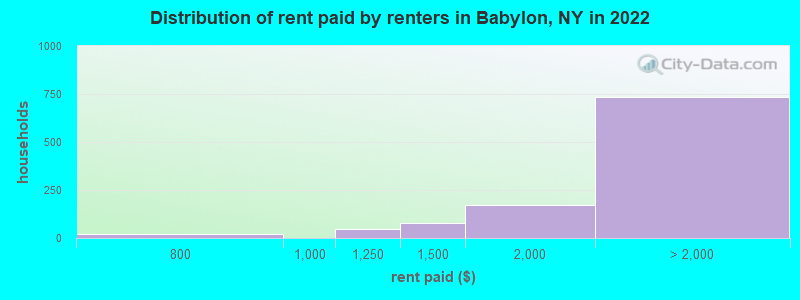
Median contract rent in 2022: over $2,000 (lower quartile is $1,659, upper quartile is over $2,000)
Median rent asked for vacant for-rent units in 2022: $3,665
Median gross rent in Babylon, NY in 2022: over $2,000
Housing units in Babylon with a mortgage: 2,532 (302 second mortgage, 0 home equity loan, 303 both second mortgage and home equity loan )Houses without a mortgage: 338
Median household income for houses/condos with a mortgage: $184,144
Median household income for apartments without a mortgage: $90,611
Median monthly housing costs: $2,738
Data:
Median house or condo value ($)
Median house or condo value ($ change since 2000)
Median house or condo value ($) - White
Median house or condo value ($) - Black or African American
Median house or condo value ($) - Asian
Median house or condo value ($) - Hispanic or Latino
Median house or condo value ($) - American Indian and Alaska Native
Median house or condo value ($) - Multirace
Median house or condo value ($) - Other Race
Median price asked for mobile homes ($)
Household density (households per square mile)
Mean house or condo value by units in structure - 1, detached ($)
Mean house or condo value by units in structure - 1, attached ($)
Mean house or condo value by units in structure - 2 ($)
Mean house or condo value by units in structure by units in structure - 3 or 4 ($)
Mean house or condo value by units in structure - 5 or more ($)
Mean house or condo value by units in structure - Boat, RV, van, etc. ($)
Mean house or condo value by units in structure - Mobile home ($)
Median contract rent ($)
Median contract rent - Lower quartile ($)
Median contract rent - Upper quartile ($)
Median gross rent ($)
Urban houses (%)
Rural houses (%)
Houses occupied (%)
Houses occupied (% change since 2000)
Houses owner occupied (%)
Houses owner occupied (% change since 2000)
Houses renter occupied (%)
Houses renter occupied (% change since 2000)
Vacant housing units - For rent (%)
Vacant housing units - For rent (% change since 2000)
Vacant housing units - For sale only (%)
Vacant housing units - For sale only (% change since 2000)
Vacant housing units - Rented or sold, not occupied (%)
Vacant housing units - Rented or sold, not occupied (% change since 2000)
Vacant housing units - For seasonal, recreational, or occasional use (%)
Vacant housing units - For seasonal, recreational, or occasional use (% change since 2000)
Vacant housing units - For migrant workers (%)
Vacant housing units - For migrant workers (% change since 2000)
Vacant housing units - Other vacant (%)
Vacant housing units - Other vacant (% change since 2000)
Median monthly housing costs ($)
Median household income for houses/condos with a mortgage ($)
Median household income for houses/condos without a mortgage ($)
Median household income ($)
Median household income ($) - White
Median household income ($) - Black or African American
Median household income ($) - Asian
Median household income ($) - Hispanic or Latino
Median household income ($) - American Indian and Alaska Native
Median household income ($) - Multirace
Median household income ($) - Other Race
Mortgage status - with mortgage (%)
Mortgage status - with second mortgage (%)
Mortgage status - with home equity loan (%)
Mortgage status - with both second mortgage and home equity loan (%)
Mortgage status - without a mortgage (%)
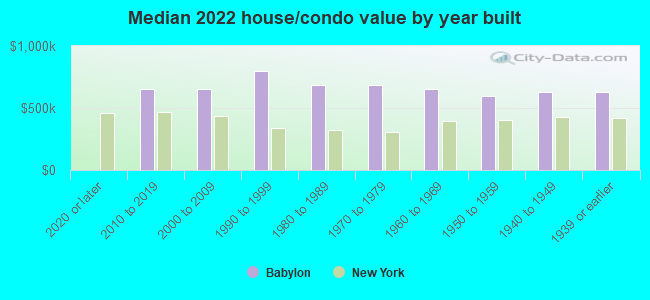
Median year house/condo built
Median year apartment built
Household type by relationship - Male householder living alone (%)
Household type by relationship - Male householder not living alone (%)
Household type by relationship - Female householder living alone (%)
Household type by relationship - Female householder not living alone (%)
Household type by relationship - Opposite-Sex spouse (%)
Household type by relationship - Same-Sex spouse (%)
Household type by relationship - Opposite-Sex unmarried partner (%)
Household type by relationship - Same-Sex unmarried partner (%)
Household type by relationship - In group quarters (%)
Size of family households - 2-person household (%)
Size of family households - 3-person household (%)
Size of family households - 4-person household (%)
Size of family households - 5-person household (%)
Size of family households - 6-person household (%)
Size of family households - 7-or-more-person household (%)
Size of nonfamily households - 1-person household (%)
Size of nonfamily households - 2-person household (%)
Size of nonfamily households - 3-person household (%)
Size of nonfamily households - 4-person household (%)
Size of nonfamily households - 5-person household (%)
Size of nonfamily households - 6-person household (%)
Size of nonfamily households - 7-or-moreperson household (%)
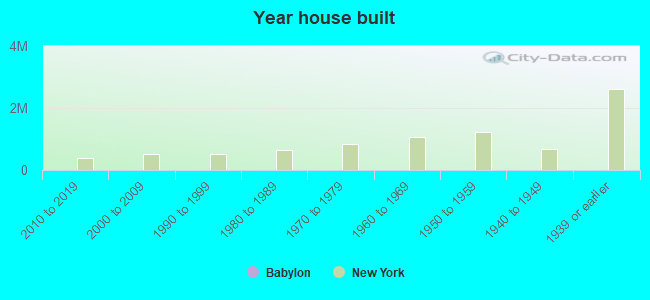
Year house built - Built 2010 or later (%)
Year house built - Built 2000 to 2009 (%)
Year house built - Built 1990 to 1999 (%)
Year house built - Built 1980 to 1989 (%)
Year house built - Built 1970 to 1979 (%)
Year house built - Built 1960 to 1969 (%)
Year house built - Built 1950 to 1959 (%)
Year house built - Built 1940 to 1949 (%)
Year house built - Built 1939 or earlier (%)
Median number of rooms in houses and condos
Median number of rooms in apartments
Median number of bedrooms in owner occupied houses
Mean number of bedrooms in owner occupied houses
Median number of bedrooms in renter occupied houses
Mean number of bedrooms in renter occupied houses
Median number of vehichles in owner occupied houses
Mean number of vehichles in owner occupied houses
Median number of vehichles in renter occupied houses
Mean number of vehichles in renter occupied houses
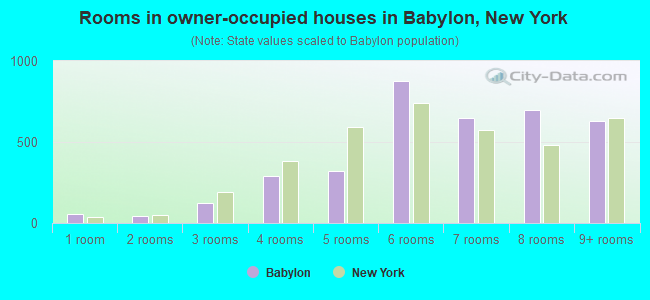
Rooms in owner-occupied houses - 1 room (%)
Rooms in owner-occupied houses - 2 rooms (%)
Rooms in owner-occupied houses - 3 rooms (%)
Rooms in owner-occupied houses - 4 rooms (%)
Rooms in owner-occupied houses - 5 rooms (%)
Rooms in owner-occupied houses - 6 rooms (%)
Rooms in owner-occupied houses - 7 rooms (%)
Rooms in owner-occupied houses - 8 rooms (%)
Rooms in owner-occupied houses - 9+ rooms (%)
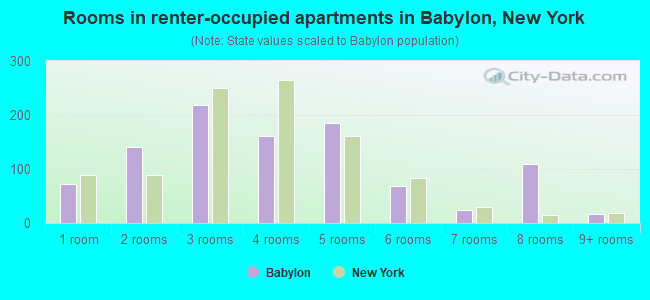
Rooms in renter-occupied houses - 1 room (%)
Rooms in renter-occupied houses - 2 rooms (%)
Rooms in renter-occupied houses - 3 rooms (%)
Rooms in renter-occupied houses - 4 rooms (%)
Rooms in renter-occupied houses - 5 rooms (%)
Rooms in renter-occupied houses - 6 rooms (%)
Rooms in renter-occupied houses - 7 rooms (%)
Rooms in renter-occupied houses - 8 rooms (%)
Rooms in renter-occupied houses - 9+ rooms (%)
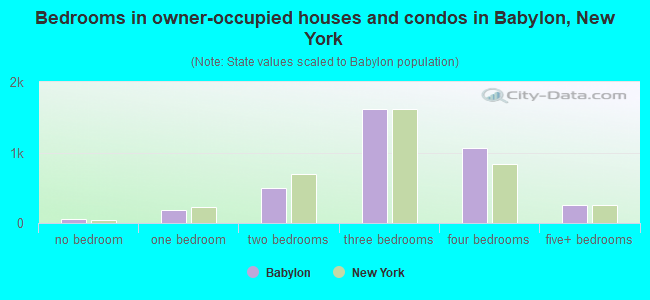
Bedrooms in owner-occupied houses - no bedrooms (%)
Bedrooms in owner-occupied houses - 1 bedroom (%)
Bedrooms in owner-occupied houses - 2 bedrooms (%)
Bedrooms in owner-occupied houses - 3 bedrooms (%)
Bedrooms in owner-occupied houses - 4 bedrooms (%)
Bedrooms in owner-occupied houses - 5+ bedrooms (%)
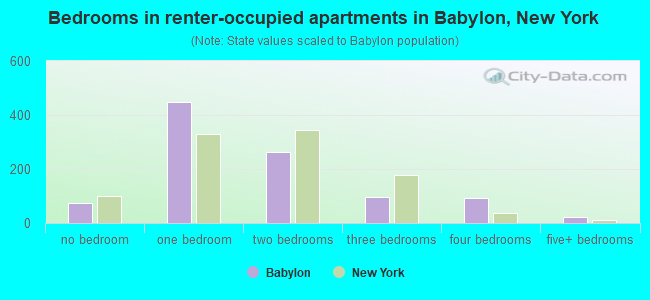
Bedrooms in renter-occupied houses - no bedrooms (%)
Bedrooms in renter-occupied houses - 1 bedroom (%)
Bedrooms in renter-occupied houses - 2 bedrooms (%)
Bedrooms in renter-occupied houses - 3 bedrooms (%)
Bedrooms in renter-occupied houses - 4 bedrooms (%)
Bedrooms in renter-occupied houses - 5+ bedrooms (%)
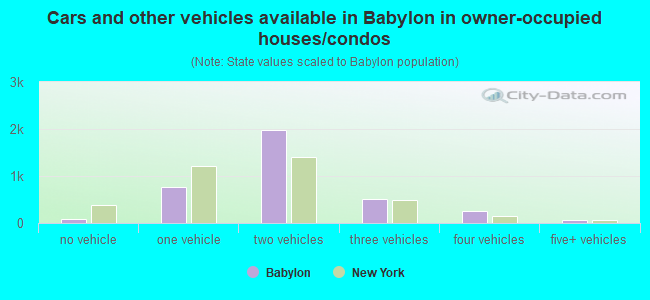
Vehicles available in owner-occupied houses - no vehicle available (%)
Vehicles available in owner-occupied houses - 1 vehicle available(%)
Vehicles available in owner-occupied houses - 2 Vehicles available (%)
Vehicles available in owner-occupied houses - 3 Vehicles available (%)
Vehicles available in owner-occupied houses - 4 Vehicles available (%)
Vehicles available in owner-occupied houses - 5+ Vehicles available (%)
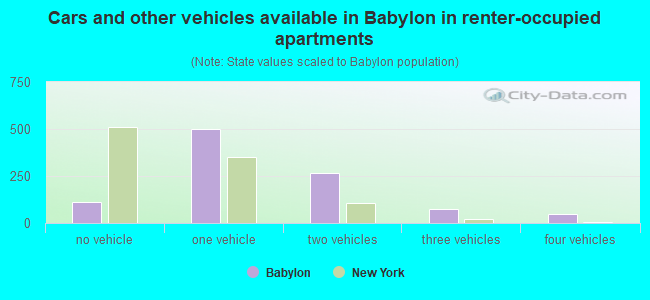
Vehicles available in renter-occupied houses - no vehicle available (%)
Vehicles available in renter-occupied houses - 1 vehicle available (%)
Vehicles available in renter-occupied houses - 2 Vehicles available (%)
Vehicles available in renter-occupied houses - 3 Vehicles available (%)
Vehicles available in renter-occupied houses - 4 Vehicles available (%)
Vehicles available in renter-occupied houses - 5+ Vehicles available (%)
Housing units in structures - 1, detached (%)
Housing units in structures - 1, attached (%)
Housing units in structures - 2 (%)
Housing units in structures - 3 or 4 (%)
Housing units in structures - 5 to 9 (%)
Housing units in structures - 10 to 19 (%)
Housing units in structures - 20 to 49 (%)
Housing units in structures - 50 or more (%)
Housing units in structures - Mobile home (%)
Housing units in structures - Boat, RV, van, etc. (%)
Housing units in structures - Owners - 1, detached (%)
Housing units in structures - Owners - 1, attached (%)
Housing units in structures - Owners - 2 (%)
Housing units in structures - Owners - 3 or 4 (%)
Housing units in structures - Owners - 5 to 9 (%)
Housing units in structures - Owners - 10 to 19 (%)
Housing units in structures - Owners - 20 to 49 (%)
Housing units in structures - Owners - 50 or more (%)
Housing units in structures - Owners - Mobile home (%)
Housing units in structures - Owners - Boat, RV, van, etc. (%)
Housing units in structures - Renters - 1, detached (%)
Housing units in structures - Renters - 1, attached (%)
Housing units in structures - Renters - 2 (%)
Housing units in structures - Renters - 3 or 4 (%)
Housing units in structures - Renters - 5 to 9 (%)
Housing units in structures - Renters - 10 to 19 (%)
Housing units in structures - Renters - 20 to 49 (%)
Housing units in structures - Renters - 50 or more (%)
Housing units in structures - Renters - Mobile home (%)
Housing units in structures - Renters - Boat, RV, van, etc. (%)
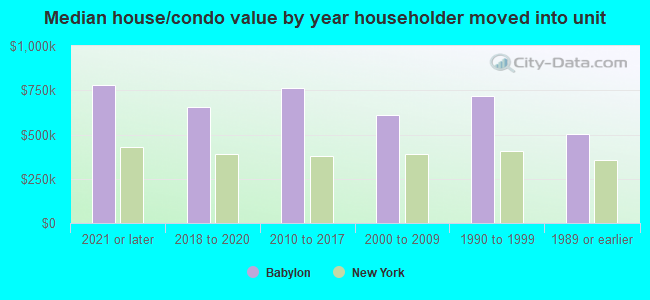
House/condo owner moved in on average (years ago)
Renter moved in on average (years ago)
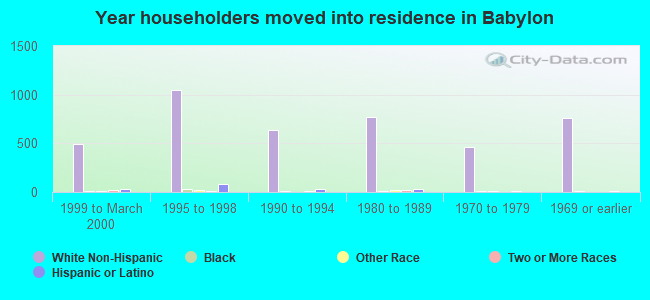
Year householder moved into unit - Moved in 1999 to March 2000 (%)
Year householder moved into unit - Moved in 1999 to March 2000 (%) - White
Year householder moved into unit - Moved in 1999 to March 2000 (%) - Black or African American
Year householder moved into unit - Moved in 1999 to March 2000 (%) - Asian
Year householder moved into unit - Moved in 1999 to March 2000 (%) - Hispanic or Latino
Year householder moved into unit - Moved in 1999 to March 2000 (%) - American Indian and Alaska Native
Year householder moved into unit - Moved in 1999 to March 2000 (%) - Multirace
Year householder moved into unit - Moved in 1999 to March 2000 (%) - Other Race
Year householder moved into unit - Moved in 1995 to 1998 (%)
Year householder moved into unit - Moved in 1995 to 1998 (%) - White
Year householder moved into unit - Moved in 1995 to 1998 (%) - Black or African American
Year householder moved into unit - Moved in 1995 to 1998 (%) - Asian
Year householder moved into unit - Moved in 1995 to 1998 (%) - Hispanic or Latino
Year householder moved into unit - Moved in 1995 to 1998 (%) - American Indian and Alaska Native
Year householder moved into unit - Moved in 1995 to 1998 (%) - Multirace
Year householder moved into unit - Moved in 1995 to 1998 (%) - Other Race
Year householder moved into unit - Moved in 1990 to 1994 (%)
Year householder moved into unit - Moved in 1990 to 1994 (%) - White
Year householder moved into unit - Moved in 1990 to 1994 (%) - Black or African American
Year householder moved into unit - Moved in 1990 to 1994 (%) - Asian
Year householder moved into unit - Moved in 1990 to 1994 (%) - Hispanic or Latino
Year householder moved into unit - Moved in 1990 to 1994 (%) - American Indian and Alaska Native
Year householder moved into unit - Moved in 1990 to 1994 (%) - Multirace
Year householder moved into unit - Moved in 1990 to 1994 (%) - Other Race
Year householder moved into unit - Moved in 1980 to 1989 (%)
Year householder moved into unit - Moved in 1980 to 1989 (%) - White
Year householder moved into unit - Moved in 1980 to 1989 (%) - Black or African American
Year householder moved into unit - Moved in 1980 to 1989 (%) - Asian
Year householder moved into unit - Moved in 1980 to 1989 (%) - Hispanic or Latino
Year householder moved into unit - Moved in 1980 to 1989 (%) - American Indian and Alaska Native
Year householder moved into unit - Moved in 1980 to 1989 (%) - Multirace
Year householder moved into unit - Moved in 1980 to 1989 (%) - Other Race
Year householder moved into unit - Moved in 1970 to 1979 (%)
Year householder moved into unit - Moved in 1970 to 1979 (%) - White
Year householder moved into unit - Moved in 1970 to 1979 (%) - Black or African American
Year householder moved into unit - Moved in 1970 to 1979 (%) - Asian
Year householder moved into unit - Moved in 1970 to 1979 (%) - Hispanic or Latino
Year householder moved into unit - Moved in 1970 to 1979 (%) - American Indian and Alaska Native
Year householder moved into unit - Moved in 1970 to 1979 (%) - Multirace
Year householder moved into unit - Moved in 1970 to 1979 (%) - Other Race
Year householder moved into unit - Moved in 1969 or earlier (%)
Year householder moved into unit - Moved in 1969 or earlier (%) - White
Year householder moved into unit - Moved in 1969 or earlier (%) - Black or African American
Year householder moved into unit - Moved in 1969 or earlier (%) - Asian
Year householder moved into unit - Moved in 1969 or earlier (%) - Hispanic or Latino
Year householder moved into unit - Moved in 1969 or earlier (%) - American Indian and Alaska Native
Year householder moved into unit - Moved in 1969 or earlier (%) - Multirace
Year householder moved into unit - Moved in 1969 or earlier (%) - Other Race
Housing units lacking complete plumbing facilities (%)
Housing units lacking complete kitchen facilities (%)
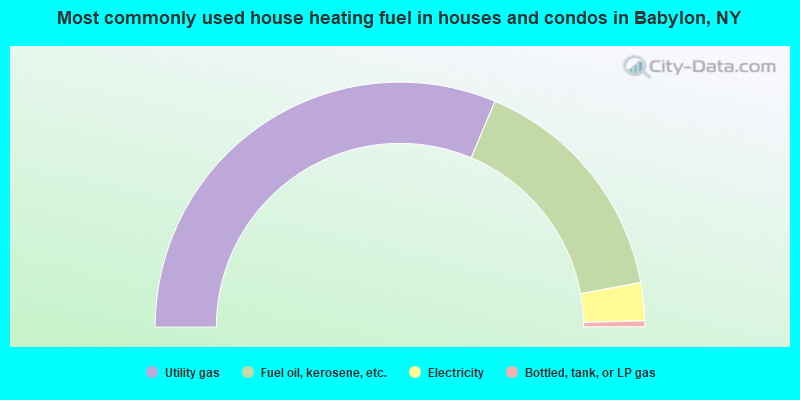
House heating fuel used in houses and condos - Utility gas (%)
House heating fuel used in houses and condos - Bottled, tank, or LP gas (%)
House heating fuel used in houses and condos - Electricity (%)
House heating fuel used in houses and condos - Fuel oil, kerosene, etc. (%)
House heating fuel used in houses and condos - Coal or coke (%)
House heating fuel used in houses and condos - Wood (%)
House heating fuel used in houses and condos - Solar energy (%)
House heating fuel used in houses and condos - Other fuel (%)
House heating fuel used in houses and condos - No fuel used (%)
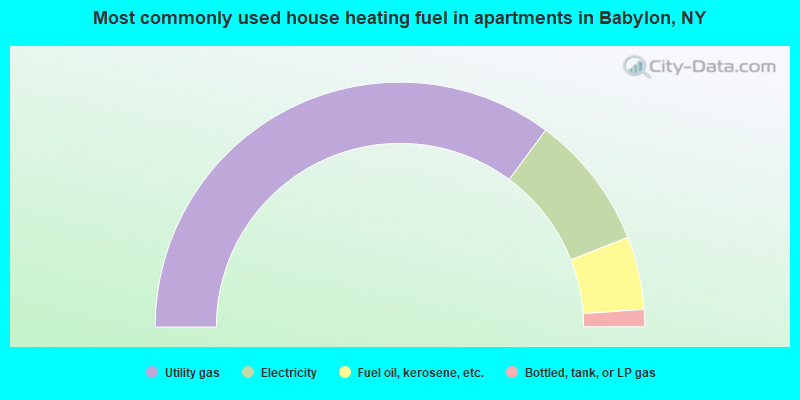
House heating fuel used in apartments - Utility gas (%)
House heating fuel used in apartments - Bottled, tank, or LP gas (%)
House heating fuel used in apartments - Electricity (%)
House heating fuel used in apartments - Fuel oil, kerosene, etc. (%)
House heating fuel used in apartments - Coal or coke (%)
House heating fuel used in apartments - Wood (%)
House heating fuel used in apartments - Solar energy (%)
House heating fuel used in apartments - Other fuel (%)
House heating fuel used in apartments - No fuel used (%)
Latest news about housing in Babylon, NY collected exclusively by city-data.com from local newspapers, TV, and radio stations
Median year house/condo built: 1954Median year apartment built: 1963Household type by relationship:
Households: 12,192
Male householders: 2,123 (448 living alone ), Female householders: 2,555 (694 living alone )2,628 spouses (2,599 opposite-sex spouses ), 306 unmarried partners , (306 opposite-sex unmarried partners ), 3,657 children (3,576 natural , 46 adopted , 35 stepchildren ), 151 grandchildren , 55 brothers or sisters , 161 parents , 0 foster children , 231 other relatives , 283 non-relatives In group quarters: 40
Size of family households: 1,326 2-persons , 949 3-persons , 557 4-persons , 195 5-persons , 152 6-persons , 5 7-or-more-persons .
Size of nonfamily households: 1,151 1-person , 291 2-persons , 33 3-persons , 34 4-persons .
1,670 married couples with children. single-parent households (72 men , 182 women ).
86.7% of residents of Babylon speak English at home. of residents speak Spanish at home (72% speak English very well , 6% speak English well , 23% speak English not well ).of residents speak other Indo-European language at home (81% speak English very well , 14% speak English well , 4% speak English not well ).of residents speak Asian or Pacific Island language at home (57% speak English very well , 43% speak English well ).
Foreign born population: 926 (7.6%)of them are naturalized citizens )
Median number of rooms in houses and condos:
Median number of rooms in apartments
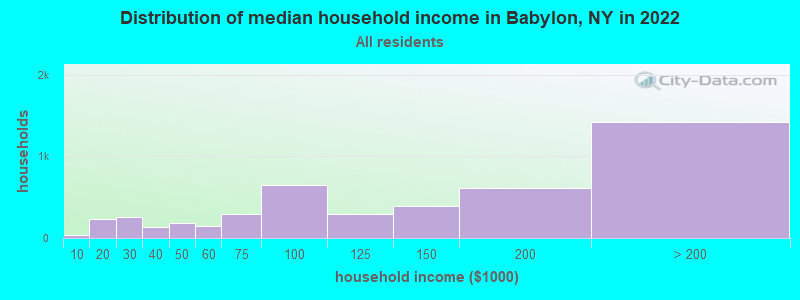
Babylon, NY household income distribution 39 Less than $10,000229 $10,000 to $19,999254 $20,000 to $29,999135 $30,000 to $39,999179 $40,000 to $49,999144 $50,000 to $59,999291 $60,000 to $74,999650 $75,000 to $99,999298 $100,000 to $124,999397 $125,000 to $149,999608 $150,000 to $199,9991,420 $200,000 or more
Home value of owner - occupied houses in 2022 in Babylon, NY 24 Less than $10,0006 $40,000 to $49,99922 $50,000 to $59,9994 $60,000 to $69,9995 $80,000 to $89,99924 $100,000 to $124,99912 $175,000 to $199,99945 $250,000 to $299,999242 $300,000 to $399,999803 $400,000 to $499,9991,566 $500,000 to $749,999820 $750,000 to $999,999316 $1,000,000 to $1,499,99936 $2,000,000 or moreRent paid by renters in 2022 in Babylon, NY 19 $750 to $79948 $1,000 to $1,24976 $1,250 to $1,499170 $1,500 to $1,999347 $2,000 to $2,499262 $2,500 to $2,99930 $3,000 to $3,49958 $3,500 or more33 No cash rent
Percentage of workers working in this county: 73.2%Number of people working at home: 1,562 (22.4% of all workers )
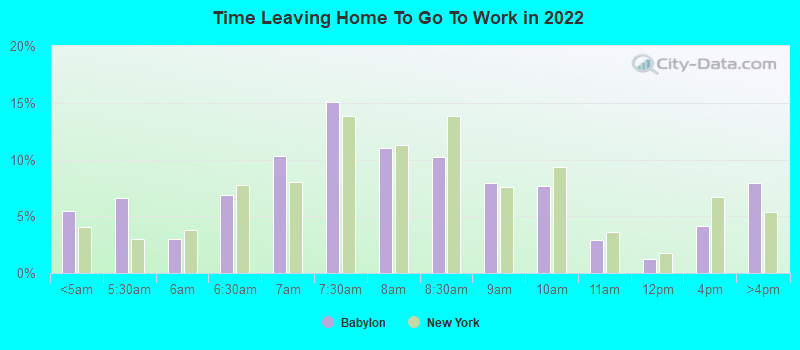
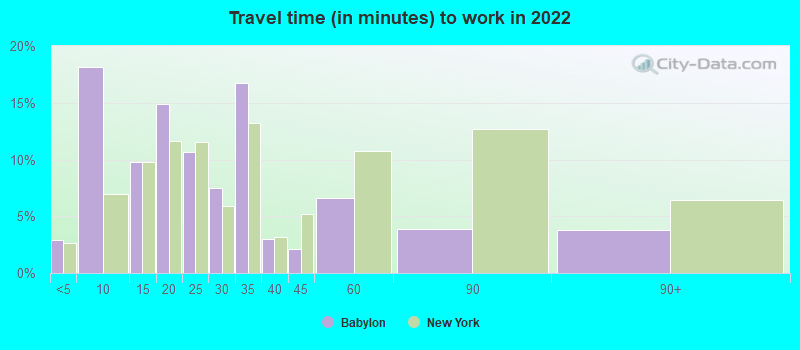
Travel time to work (commute)
Less than 5 minutes: 1555 to 9 minutes: 73610 to 14 minutes: 61715 to 19 minutes: 63220 to 24 minutes: 48825 to 29 minutes: 32230 to 34 minutes: 86435 to 39 minutes: 6240 to 44 minutes: 18745 to 59 minutes: 41460 to 89 minutes: 59990 or more minutes: 529
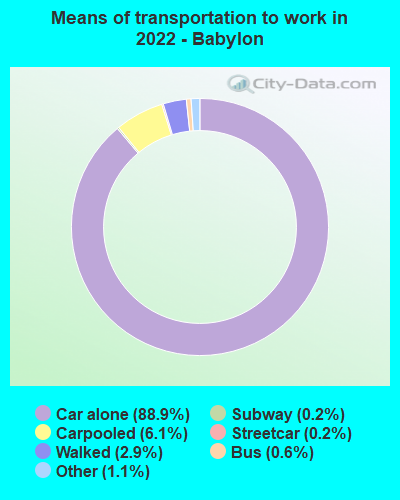
Means of transportation to work:
Drove a car alone: 4,994 (70.1%)Carpooled: 390 (5.5%)Bus : 31 (0.4%)Subway or elevated rail : 14 (0.2%)Long-distance train or commuter rail : 13 (0.2%)Taxi: 77 (1.1%)Walked: 172 (2.4%)Worked at home: 1,562 (21.9%)
Unemployment by race in 2022
Unemployment rate for White non-Hispanic residents 4.4% Males1.7% FemalesUnemployment rate for Asian residents 27.5% MalesUnemployment rate for other race residents 5.2% MalesUnemployment rate for two or more race residents 9.8% Males3.8% FemalesUnemployment rate for Hispanic or Latino residents 10.1% Males
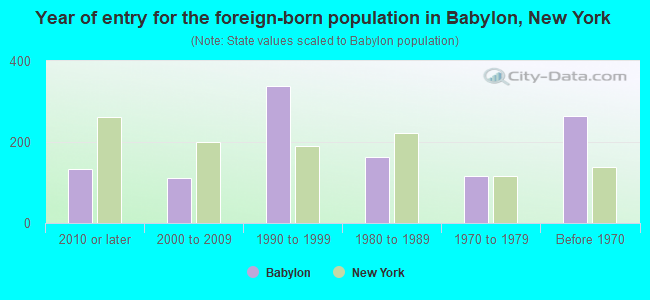
Year of entry for the foreign-born population in Babylon, New York
134 2010 or later 112 2000 to 2009 338 1990 to 1999 163 1980 to 1989 115 1970 to 1979 264 Before 1970
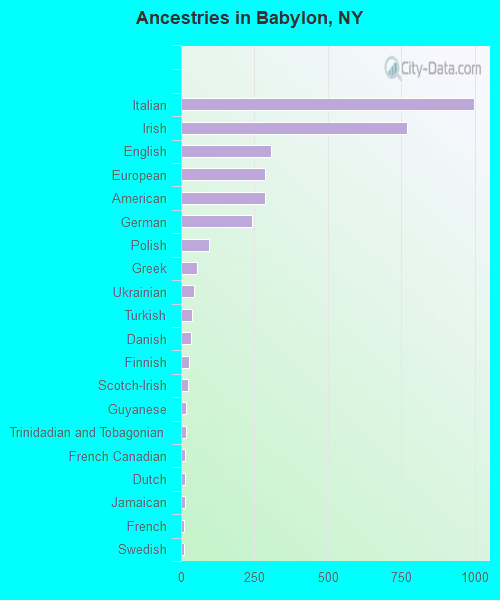
First ancestries reported:
Italian: 998 (24.0%)
Irish: 770 (18.5%)
English: 306 (7.3%)
European: 287 (6.9%)
American: 285 (6.8%)
German: 240 (5.8%)
Polish: 95 (2.3%)
Greek: 53 (1.3%)
Ukrainian: 44 (1.1%)
Turkish: 36 (0.9%)
Danish: 33 (0.8%)
Finnish: 26 (0.6%)
Scotch-Irish: 25 (0.6%)
Guyanese: 18 (0.4%)
Trinidadian and Tobagonian: 16 (0.4%)
French Canadian: 15 (0.4%)
Dutch: 12 (0.3%)
Jamaican: 12 (0.3%)
French: 10 (0.2%)
Swedish: 10 (0.2%)
Eastern European: 9 (0.2%)
Croatian: 8 (0.2%)
Welsh: 8 (0.2%)
Northern European: 5 (0.1%)
Russian: 5 (0.1%)
Norwegian: 3 (0.07%) Most common places of birth for foreign-born residents (%): Canada Babylon:
10.2% (87)New York:
1.3% (59,107)
Ireland Babylon:
7.4% (63)New York:
0.6% (26,772)
India Babylon:
7.1% (61)New York:
3.5% (158,432)
Korea Babylon:
5.9% (50)New York:
1.8% (82,786)
Argentina Babylon:
5.6% (48)New York:
0.5% (21,928)
Ecuador Babylon:
5.6% (48)New York:
3.9% (177,448)
Dominican Republic Babylon:
5.5% (47)New York:
11.1% (501,040)
Italy Babylon:
4.9% (42)New York:
1.8% (81,374)
Philippines Babylon:
4.7% (40)New York:
2.0% (91,070)
Mexico Babylon:
4.3% (37)New York:
4.8% (214,559)
Brazil Babylon:
4.1% (35)New York:
0.7% (30,658)
Turkey Babylon:
4.0% (34)New York:
0.5% (21,009)
Denmark Babylon:
3.7% (32)New York:
0.0% (2,145)
Guyana Babylon:
3.3% (28)New York:
3.8% (172,129)
Germany Babylon:
3.2% (27)New York:
0.9% (38,713)
Colombia Babylon:
2.8% (24)New York:
2.5% (111,920)
Chile Babylon:
2.7% (23)New York:
0.3% (11,831)
Peru Babylon:
2.3% (20)New York:
1.2% (54,759)
Other South America Babylon:
2.3% (20)New York:
0.2% (8,613)
Poland Babylon:
2.2% (19)New York:
1.4% (65,102)
Trinidad and Tobago Babylon:
1.6% (14)New York:
2.0% (91,428)
Place of birth for U.S.-born residents:
This state: 10,014Other state: 896Northeast: 353Midwest: 101South: 277West: 152 92.5% of Babylon residents lived in the same house 1 years ago.
Out of people who lived in different houses, 35.0% lived in this county.
Out of people who lived in different counties, 88.2% lived in New York.
Babylon:
92.5%State average:
89.6%
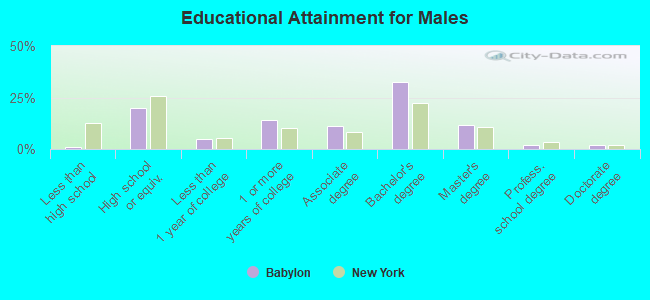
Education attainment for males 25 years and older:
No schooling: 1Nursery to 4th grade: 05th and 6th grade: 07th and 8th grade: 09th grade: 1410th grade: 411th grade: 012th grade, no diploma: 26High school graduate (or equivalency): 888Less than 1 year of college: 218Some college more than 1 year, no degree: 628Associate degree: 502Bachelor's degree: 1,444Master's degree: 521Professional school degree: 94Doctorate degree: 88
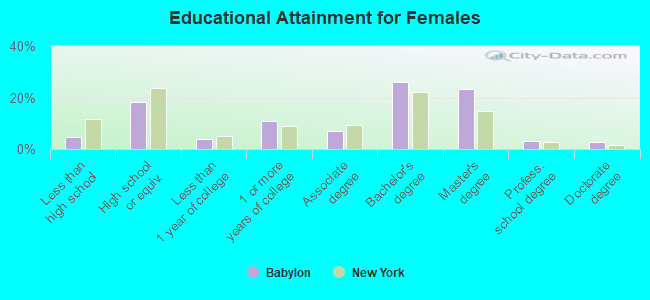
Education attainment for females 25 years and older:
No schooling: 72Nursery to 4th grade: 175th and 6th grade: 117th and 8th grade: 199th grade: 5310th grade: 1011th grade: 1612th grade, no diploma: 16High school graduate (or equivalency): 879Less than 1 year of college: 194Some college more than 1 year, no degree: 517Associate degree: 339Bachelor's degree: 1,245Master's degree: 1,107Professional school degree: 158Doctorate degree: 129
Housing units in structures:
One, detached: 3,613One, attached: 289Two: 2723 or 4: 3405 to 9: 13010 to 19: 7720 to 49: 7250 or more: 114Housing units lacking complete plumbing facilities in 2022: 1.2%Housing units lacking complete kitchen facilities in 2022: 2.8%House/condo owner moved in on average 16 years ago
Renter moved in on average 2 years ago
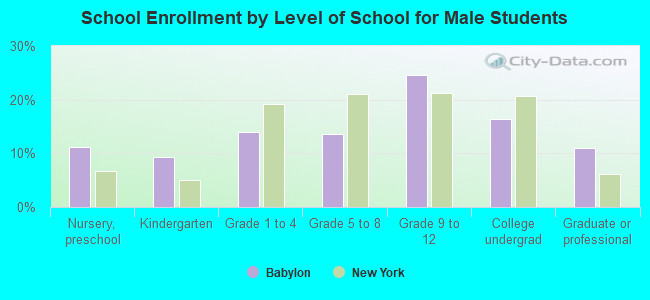
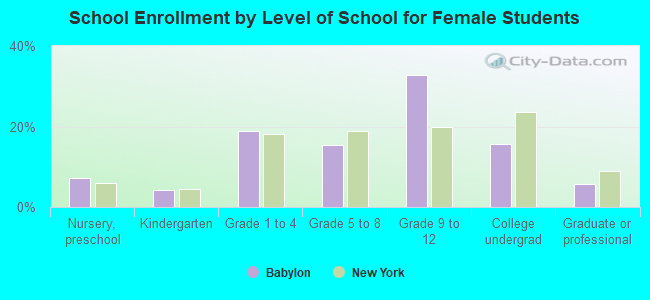
Private vs. public school enrollment:
Students in private schools in grades 1 to 8 (elementary and middle school): 49 Students in private schools in grades 9 to 12 (high school): 20 Students in private undergraduate colleges: 109