Avra Valley, AZ (Arizona) Houses and Residents
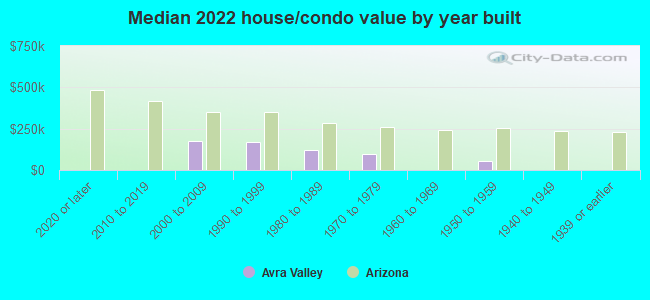
| Avra Valley: | $166,170 |
| Arizona: | $402,800 |
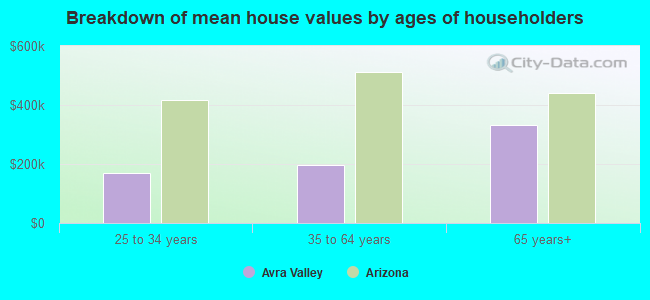
Mean price in 2022:
Detached houses: $324,121
Here: $324,121 State: $521,408 Townhouses or other attached units: $336,379
Here: $336,379 State: $387,465 Mobile homes: $152,626
Here: $152,626 State: $141,516
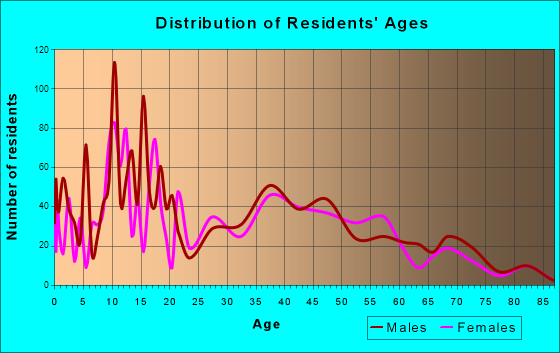
Total population: 6,050 (Urban population: 3,466 (all inside urban clusters), Rural population: 1,645 (all nonfarm))
Houses: 2,495 (2,438 occupied: 1,834 owner occupied, 636 renter occupied)
| % of renters here: | 26% |
| State: | 33% |
Housing density: 113 houses/condos per square mile
Median price asked for vacant for-sale houses and condos in 2022 in this county: $287,979.
Median contract rent in 2022: $656
Median rent asked for vacant for-rent units in 2022: $438
Median gross rent in Avra Valley, AZ in 2022: $725
Housing units in Avra Valley with a mortgage: 977 (32 second mortgage, 0 home equity loan, 32 both second mortgage and home equity loan)
Houses without a mortgage: 0
Median household income for houses/condos with a mortgage: $59,918
Median household income for apartments without a mortgage: $52,011
Median monthly housing costs: $789
Compare current foreclosures near Avra Valley, AZ:
| Photo | Address | Area | Beds / Baths | Price | Details |
|---|---|---|---|---|---|

|
#1
W Massey Dr
Marana, AZ 85653
|
2,345 sq. feet
|
3 baths 5 beds |
show details | |

|
#2
W Tangerine Rd
Marana, AZ 85658
|
- sq. feet
|
2 baths 4 beds |
show details | |

|
#3
W Folsom Point Dr
Marana, AZ 85658
|
- sq. feet
|
2 baths 3 beds |
show details | |

|
#4
W Old Pecos Pl
Tucson, AZ 85743
|
1,749 sq. feet
|
2 baths 3 beds |
show details | |

|
#5
W Placita Casa Sevilla
Marana, AZ 85658
|
- sq. feet
|
2 baths 4 beds |
show details | |

|
#6
W Placita Dato
Marana, AZ 85653
|
1,344 sq. feet
|
2 baths 3 beds |
show details | |

|
#7
S Colony Dr
Red Rock, AZ 85145
|
1,776 sq. feet
|
2 baths 3 beds |
show details | |

|
#8
Hot Desert Trail
Tucson, AZ 85743
|
- sq. feet
|
2 baths 2 beds |
show details | |

|
#9
N Gibbs Ave
Marana, AZ 85653
|
1,912 sq. feet
|
- baths - beds |
show details | |

|
#10
N Mill Crossing Way
Tucson, AZ 85743
|
2,011 sq. feet
|
2 baths - beds |
show details |
| Photo | Address | Area | Beds / Baths | Price | Details |
|---|---|---|---|---|---|

|
#11
N Flintlock Rd
Marana, AZ 85653
|
- sq. feet
|
2 baths 3 beds |
show details | |

|
#12
W Yuma Mine Cir
Tucson, AZ 85743
|
- sq. feet
|
3 baths - beds |
show details | |

|
#13
N Puma Rd
Marana, AZ 85653
|
- sq. feet
|
2 baths 3 beds |
show details | |

|
#14
S Colony Dr
Red Rock, AZ 85145
|
2,640 sq. feet
|
- baths - beds |
show details | |

|
#15
N Silverbell Rd Apt 1105
Tucson, AZ 85743
|
- sq. feet
|
- baths - beds |
show details | |

|
#16
N Sandra Rd
Marana, AZ 85658
|
- sq. feet
|
- baths - beds |
show details | |

|
#17
N Silverbell Rd Apt 24101
Tucson, AZ 85743
|
- sq. feet
|
- baths - beds |
show details | |

|
#18
N Silverbell Rd Apt 13201
Tucson, AZ 85743
|
- sq. feet
|
- baths - beds |
show details | |

|
#19
N Red Diamond Ave
Tucson, AZ 85742
|
1,558 sq. feet
|
- baths - beds |
show details | |

|
#20
W Sunset Vista Pl
Marana, AZ 85658
|
1,318 sq. feet
|
- baths - beds |
show details |
| Photo | Address | Area | Beds / Baths | Price | Details |
|---|---|---|---|---|---|

|
#21
N Silverbell Rd Apt 21602
Tucson, AZ 85743
|
- sq. feet
|
- baths - beds |
show details | |

|
#22
W Durham Hills St
Marana, AZ 85658
|
1,581 sq. feet
|
- baths - beds |
show details | |

|
#23
W Acacia Blossom Pl
Marana, AZ 85658
|
- sq. feet
|
- baths - beds |
show details | |

|
#24
W Avella Dr
Marana, AZ 85658
|
- sq. feet
|
- baths - beds |
show details | |

|
#25
N Continental Links Dr
Tucson, AZ 85743
|
- sq. feet
|
- baths - beds |
show details | |

|
#26
W Sugar Pine Trl
Tucson, AZ 85743
|
- sq. feet
|
- baths - beds |
show details | |

|
#27
W Copperhead Dr
Tucson, AZ 85742
|
2,886 sq. feet
|
- baths - beds |
show details | |

|
#28
W Marana Center Blvd, Apt 11107
Tucson, AZ 85742
|
- sq. feet
|
- baths - beds |
show details | |

|
#29
W Calle Madero
Tucson, AZ 85743
|
288 sq. feet
|
- baths - beds |
show details | |

|
#30
W Red Hawk Pl
Marana, AZ 85658
|
- sq. feet
|
- baths - beds |
show details |
| Photo | Address | Area | Beds / Baths | Price | Details |
|---|---|---|---|---|---|

|
#31
W Red Hawk Pl
Marana, AZ 85658
|
- sq. feet
|
- baths - beds |
show details | |

|
#32
N Coltrane Ln
Tucson, AZ 85743
|
2,854 sq. feet
|
- baths - beds |
show details | |

|
#33
W Deserama Dr
Tucson, AZ 85743
|
2,450 sq. feet
|
- baths - beds |
show details | |

|
#34
N Lawndale Dr
Tucson, AZ 85743
|
1,351 sq. feet
|
- baths - beds |
show details | |

|
#35
N Ahwatukee Way
Tucson, AZ 85743
|
2,828 sq. feet
|
- baths - beds |
show details | |

|
#36
N Maple Ridge Pl
Tucson, AZ 85743
|
1,805 sq. feet
|
- baths - beds |
show details | |

|
#37
W Odyssey Way
Tucson, AZ 85743
|
1,350 sq. feet
|
- baths - beds |
show details | |

|
#38
N Sunny Rock Ridge Dr
Tucson, AZ 85743
|
1,805 sq. feet
|
- baths - beds |
show details | |

|
#39
W Mesquite River Dr
Tucson, AZ 85743
|
1,152 sq. feet
|
- baths - beds |
show details | |

|
#40
N Sunset Gallery Dr
Marana, AZ 85658
|
- sq. feet
|
- baths - beds |
show details |
| Photo | Address | Area | Beds / Baths | Price | Details |
|---|---|---|---|---|---|

|
#41
W Scenic Park Dr
Tucson, AZ 85742
|
- sq. feet
|
- baths - beds |
show details | |

|
#42
W Shady Grove Dr
Tucson, AZ 85742
|
2,591 sq. feet
|
- baths - beds |
show details | |

|
#43
N Oldfather Dr
Tucson, AZ 85741
|
1,283 sq. feet
|
- baths - beds |
show details | |

|
#44
N Juniper Rd
Tucson, AZ 85741
|
1,584 sq. feet
|
- baths - beds |
show details | |

|
#45
N Camino Martin Ste 102
Tucson, AZ 85741
|
- sq. feet
|
- baths - beds |
show details | |

|
#46
W Firethorn St
Tucson, AZ 85741
|
1,822 sq. feet
|
- baths - beds |
show details | |

|
#47
W Cortaro Farms Rd Unit 67
Tucson, AZ 85742
|
- sq. feet
|
- baths - beds |
show details | |

|
#48
N Holly Brook Ave
Tucson, AZ 85742
|
1,028 sq. feet
|
- baths - beds |
show details | |

|
#49
N Delta Way
Tucson, AZ 85742
|
- sq. feet
|
- baths - beds |
show details | |

|
Check over 1 million property listings on Foreclosure.com!
|
browse all offers | |||


 | New westside housing and I-11 (11 replies) |
| How Do You Classify Tucson: Desert or Semi Arid? (11 replies) |
| I-11 will degrade SNP, TMP and the ASDM? (23 replies) |
| Phoenix and Tucson to Merge? (78 replies) |
| 10 Reasons Not To Move To Tucson (622 replies) |
| How long of a drive from Marana to Tucson? (9 replies) |
Median year apartment built: 1993
Household type by relationship:
Households: 6,372- Male householders: 1,344 (414 living alone), Female householders: 1,085 (267 living alone)
1,049 spouses (1,049 opposite-sex spouses), 280 unmarried partners, (280 opposite-sex unmarried partners), 1,845 children (1,615 natural, 65 adopted, 164 stepchildren), 164 grandchildren, 17 brothers or sisters, 53 parents, 0 foster children, 155 other relatives, 377 non-relatives
Size of family households: 644 2-persons, 260 3-persons, 275 4-persons, 228 5-persons, 79 6-persons, 44 7-or-more-persons.
Size of nonfamily households: 721 1-person, 178 2-persons, 16 4-persons.
882 married couples with children.
357 single-parent households (227 men, 130 women).
93.7% of residents of Avra Valley speak English at home.
5.5% of residents speak Spanish at home (78% speak English very well, 8% speak English well, 14% speak English not well).
0.8% of residents speak other Indo-European language at home (59% speak English very well, 41% speak English well).
1.1% of residents speak Asian or Pacific Island language at home (88% speak English very well, 12% speak English well).
Foreign born population: 239 (3.8%)
(92.9% of them are naturalized citizens)
| Here: | 5.5 |
| State: | 6.0 |
| Here: | 4.4 |
| State: | 4.1 |
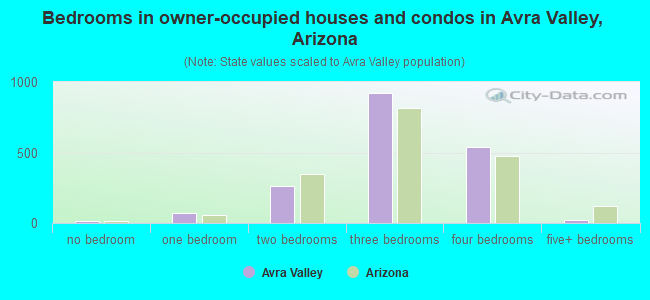
- Bedrooms in owner-occupied houses and condos in Avra Valley, Arizona
- 13no bedroom
- 701 bedroom
- 2642 bedrooms
- 9253 bedrooms
- 5424 bedrooms
- 205+ bedrooms
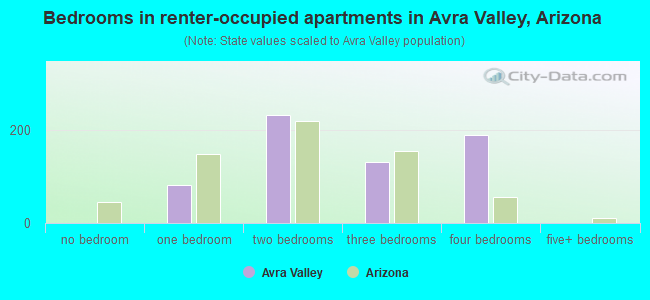
- Bedrooms in renter-occupied apartments in Avra Valley, Arizona
- 0no bedroom
- 831 bedroom
- 2332 bedrooms
- 1323 bedrooms
- 1894 bedrooms
- 05+ bedrooms
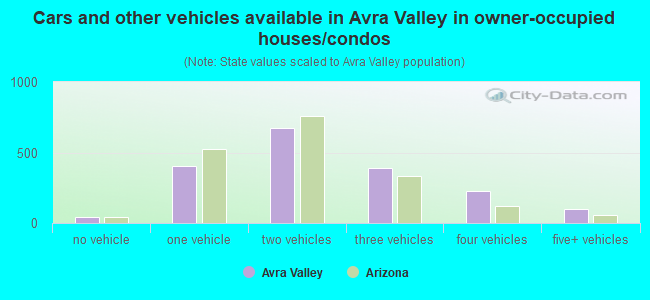
- Cars and other vehicles available in Avra Valley in owner-occupied houses/condos
- 45no vehicle
- 4041 vehicle
- 6712 vehicles
- 3923 vehicles
- 2244 vehicles
- 985+ vehicles
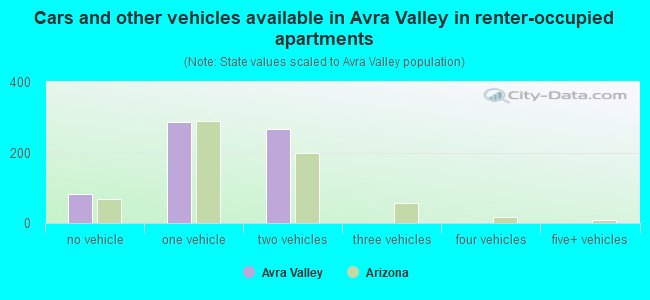
- Cars and other vehicles available in Avra Valley in renter-occupied apartments
- 83no vehicle
- 2871 vehicle
- 2672 vehicles
- 03 vehicles
- 04 vehicles
- 05+ vehicles
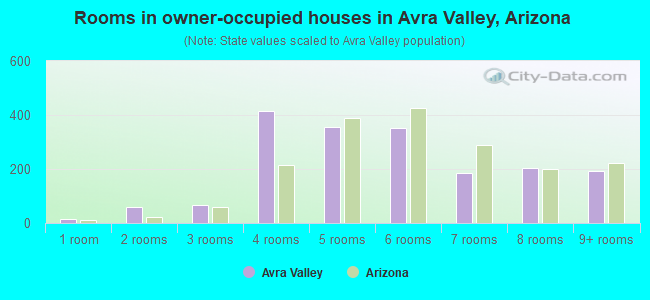
- Rooms in owner-occupied houses in Avra Valley, Arizona
- 131 room
- 592 rooms
- 653 rooms
- 4134 rooms
- 3545 rooms
- 3536 rooms
- 1847 rooms
- 2028 rooms
- 1929+ rooms
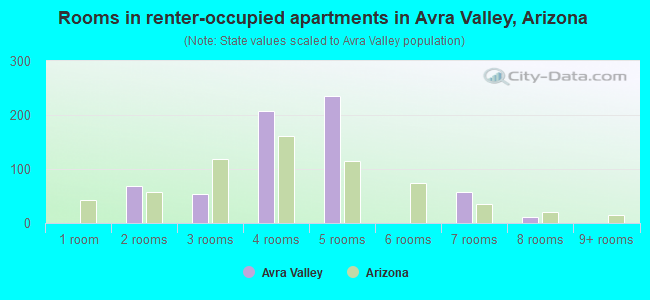
- Rooms in renter-occupied apartments in Avra Valley, Arizona
- 01 room
- 692 rooms
- 543 rooms
- 2084 rooms
- 2365 rooms
- 06 rooms
- 577 rooms
- 128 rooms
- 09+ rooms
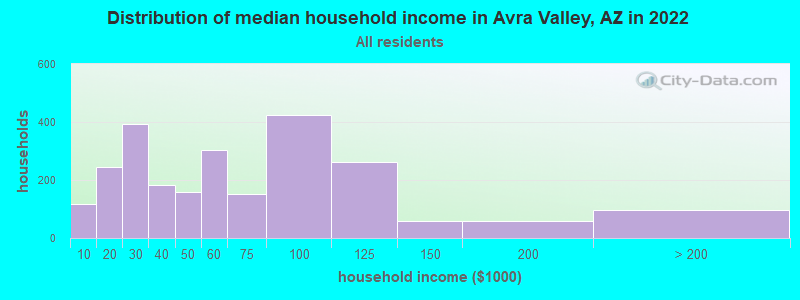
Avra Valley, AZ household income distribution

- 117Less than $10,000
- 244$10,000 to $19,999
- 393$20,000 to $29,999
- 182$30,000 to $39,999
- 159$40,000 to $49,999
- 305$50,000 to $59,999
- 151$60,000 to $74,999
- 423$75,000 to $99,999
- 262$100,000 to $124,999
- 59$125,000 to $149,999
- 57$150,000 to $199,999
- 97$200,000 or more
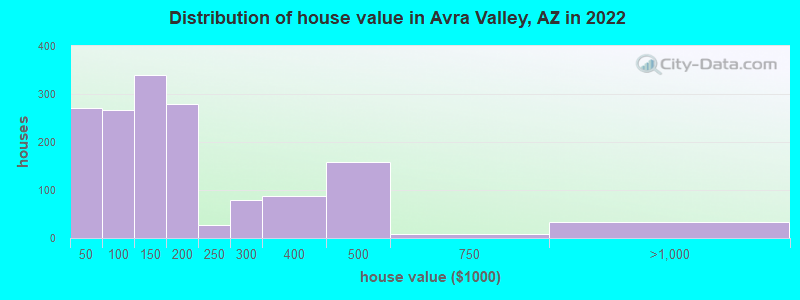
Home value of owner - occupied houses in 2022 in Avra Valley, AZ
-
- 8Less than $10,000
- 20$10,000 to $14,999
- 12$15,000 to $19,999
- 45$20,000 to $24,999
- 27$25,000 to $29,999
- 29$30,000 to $34,999
- 43$35,000 to $39,999
- 82$40,000 to $49,999
- 38$60,000 to $69,999
- 61$70,000 to $79,999
- 16$80,000 to $89,999
- 67$90,000 to $99,999
- 205$100,000 to $124,999
- 134$125,000 to $149,999
- 169$150,000 to $174,999
- 109$175,000 to $199,999
- 27$200,000 to $249,999
- 79$250,000 to $299,999
- 87$300,000 to $399,999
- 159$400,000 to $499,999
- 9$500,000 to $749,999
- 33$750,000 to $999,999
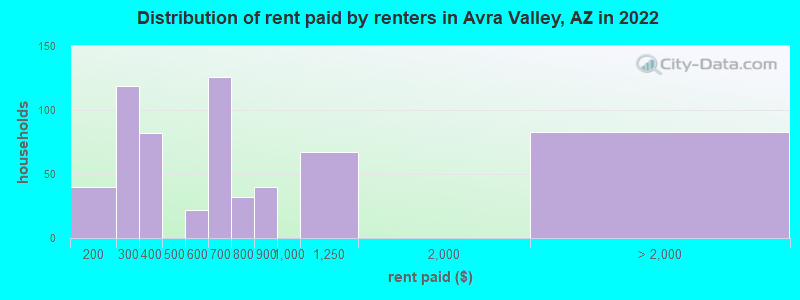
Rent paid by renters in 2022 in Avra Valley, AZ
-
- 39$150 to $199
- 118$200 to $249
- 82$300 to $349
- 21$550 to $599
- 65$600 to $649
- 61$650 to $699
- 32$750 to $799
- 40$800 to $899
- 66$1,000 to $1,249
- 82No cash rent
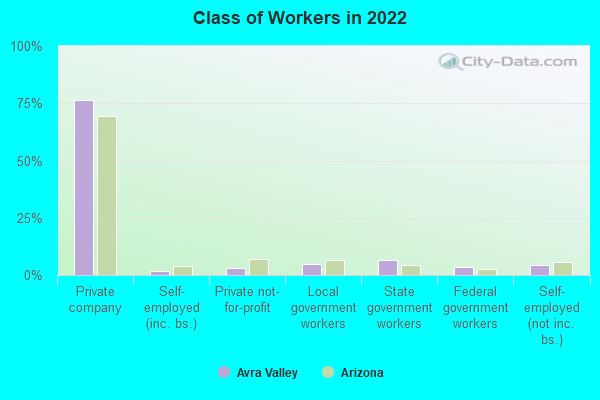
Percentage of workers working in this county: 89.6%
Number of people working at home: 0 (0.0% of all workers)
Travel time to work (commute)
- Less than 5 minutes: 109
- 5 to 9 minutes: 21
- 10 to 14 minutes: 258
- 15 to 19 minutes: 295
- 20 to 24 minutes: 485
- 25 to 29 minutes: 177
- 30 to 34 minutes: 187
- 35 to 39 minutes: 231
- 40 to 44 minutes: 217
- 45 to 59 minutes: 719
- 60 to 89 minutes: 128
- 90 or more minutes: 11
Means of transportation to work:
- Drove a car alone: 1,562 (72.9%)
- Carpooled: 409 (19.1%)
- Bus or trolley bus: 7 (0.3%)
- Motorcycle: 10 (0.5%)
- Walked: 32 (1.5%)
- Other means: 53 (2.5%)
- Worked at home: 71 (3.3%)
- Unemployment by race in 2022
- Unemployment rate for White non-Hispanic residents
- 2.4%Males
- 12.2%Females
- Unemployment rate for Asian residents
- 58.7%Females
- Unemployment rate for two or more race residents
- 76.1%Females
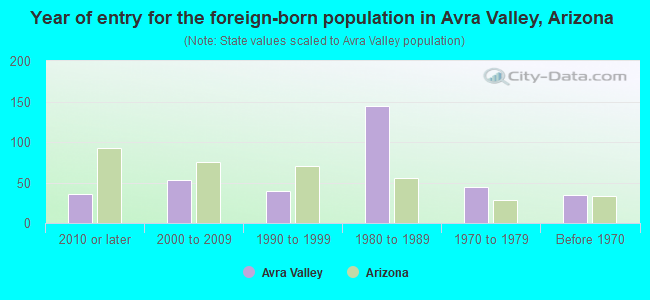
- Year of entry for the foreign-born population in Avra Valley, Arizona
- 362010 or later
- 532000 to 2009
- 391990 to 1999
- 1451980 to 1989
- 451970 to 1979
- 35Before 1970
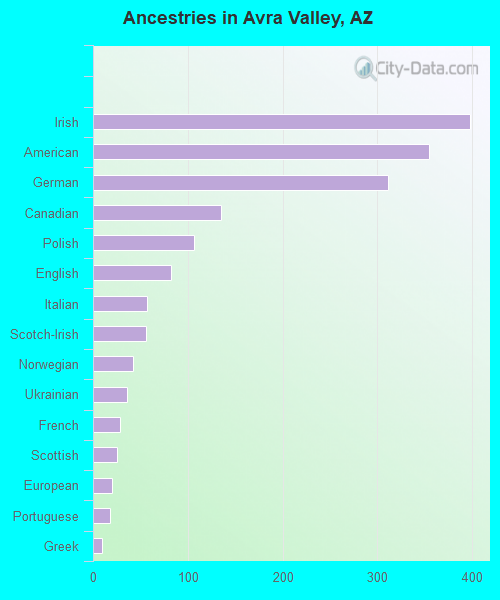
First ancestries reported:
- Irish: 398 (18.4%)
- American: 355 (16.4%)
- German: 311 (14.4%)
- Canadian: 135 (6.2%)
- Polish: 107 (4.9%)
- English: 82 (3.8%)
- Italian: 57 (2.6%)
- Scotch-Irish: 56 (2.6%)
- Norwegian: 42 (1.9%)
- Ukrainian: 36 (1.7%)
- French: 28 (1.3%)
- Scottish: 25 (1.2%)
- European: 20 (0.9%)
- Portuguese: 18 (0.8%)
- Greek: 10 (0.5%)
Most common places of birth for foreign-born residents (%):
| Avra Valley: | 25.6% (64) |
| Arizona: | 3.2% (30,378) |
| Avra Valley: | 24.0% (60) |
| Arizona: | 1.5% (14,058) |
| Avra Valley: | 21.6% (54) |
| Arizona: | 0.7% (6,565) |
| Avra Valley: | 12.0% (30) |
| Arizona: | 53.4% (500,086) |
| Avra Valley: | 5.2% (13) |
| Arizona: | 0.6% (5,893) |
| Avra Valley: | 3.2% (8) |
| Arizona: | 0.2% (2,223) |
Place of birth for U.S.-born residents:
- This state: 2,841
- Other state: 3,207
- Northeast: 670
- Midwest: 1,386
- South: 246
- West: 874
83.7% of Avra Valley residents lived in the same house 1 years ago.
Out of people who lived in different houses, 42.8% lived in this county.
Out of people who lived in different counties, 0.0% lived in Arizona.
| Avra Valley: | 83.7% |
| State average: | 86.0% |
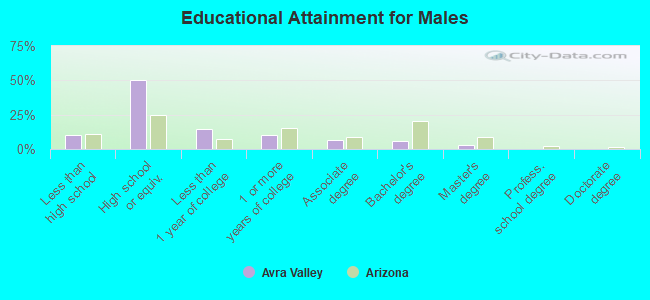
Education attainment for males 25 years and older:
- No schooling: 12
- Nursery to 4th grade: 0
- 5th and 6th grade: 14
- 7th and 8th grade: 15
- 9th grade: 0
- 10th grade: 25
- 11th grade: 96
- 12th grade, no diploma: 72
- High school graduate (or equivalency): 1,164
- Less than 1 year of college: 344
- Some college more than 1 year, no degree: 245
- Associate degree: 148
- Bachelor's degree: 129
- Master's degree: 60
- Professional school degree: 0
- Doctorate degree: 0
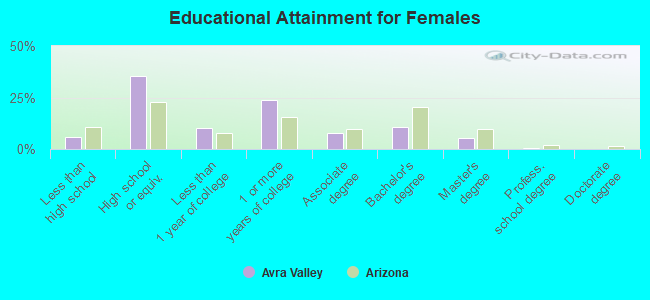
Education attainment for females 25 years and older:
- No schooling: 11
- Nursery to 4th grade: 0
- 5th and 6th grade: 0
- 7th and 8th grade: 6
- 9th grade: 0
- 10th grade: 40
- 11th grade: 45
- 12th grade, no diploma: 15
- High school graduate (or equivalency): 695
- Less than 1 year of college: 202
- Some college more than 1 year, no degree: 465
- Associate degree: 153
- Bachelor's degree: 208
- Master's degree: 100
- Professional school degree: 13
- Doctorate degree: 0
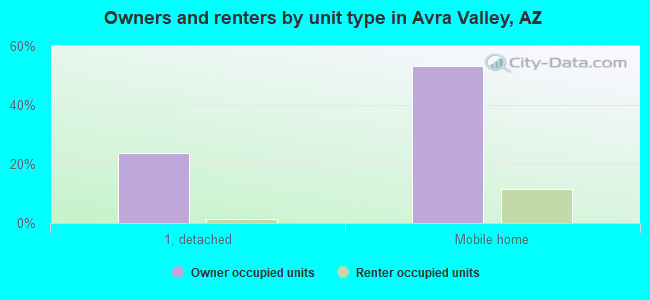
Housing units in structures:
- One, detached: 593
- 50 or more: 13
- Mobile homes: 1,852
- Boats, RVs, vans, etc.: 36
Median worth of mobile homes: $160,387
Housing units lacking complete kitchen facilities in 2022: 1.8%
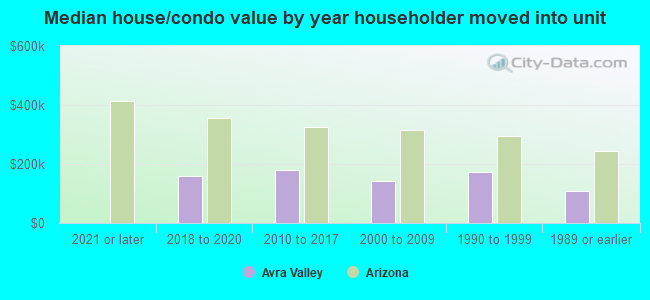
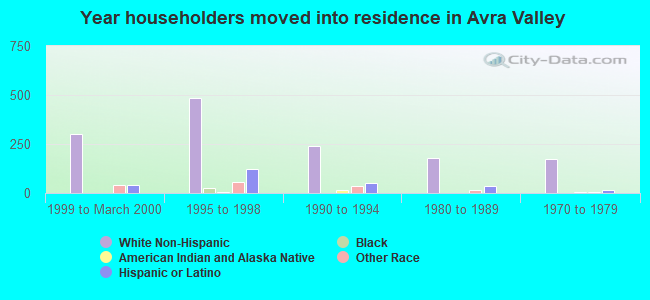
House/condo owner moved in on average 12 years ago
Renter moved in on average 9 years ago
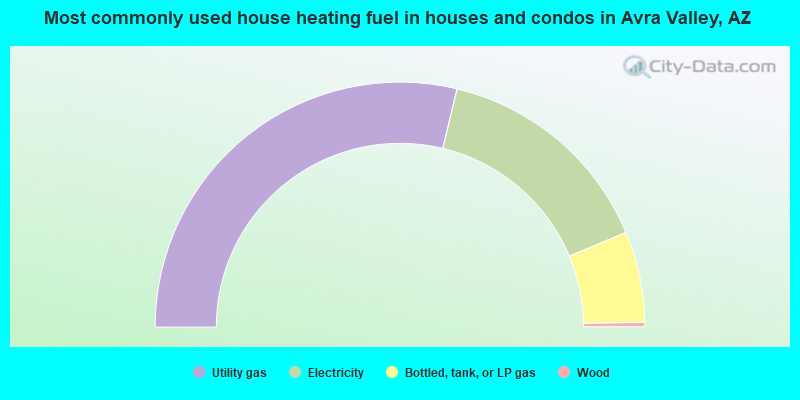
- 57.5%Utility gas
- 29.9%Electricity
- 12.0%Bottled, tank, or LP gas
- 0.6%Wood
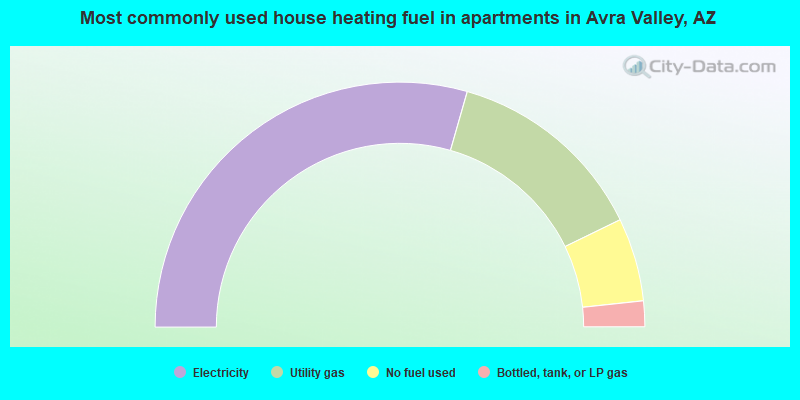
- 58.8%Electricity
- 26.7%Utility gas
- 11.0%No fuel used
- 3.4%Bottled, tank, or LP gas
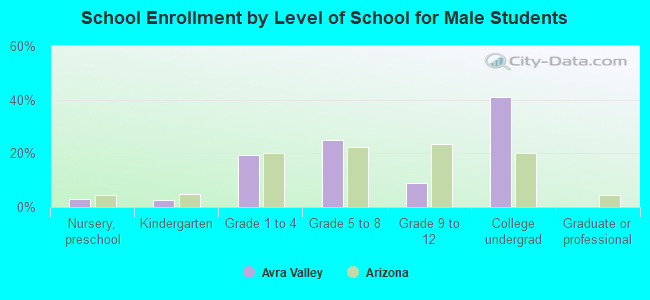
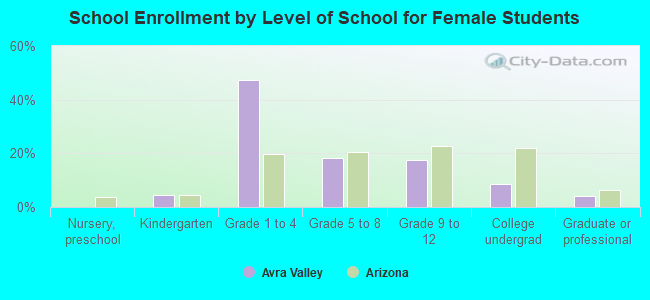
Private vs. public school enrollment:
| Here: | 7.4% |
| Arizona: | 10.4% |
| Here: | 0.0% |
| Arizona: | 8.8% |
| Here: | 3.8% |
| Arizona: | 13.1% |