Ashtabula, OH (Ohio) Houses and Residents
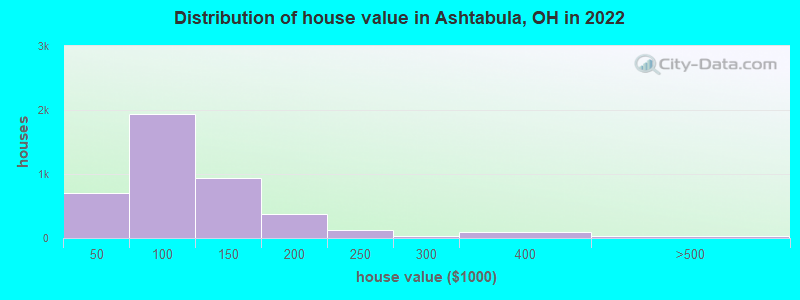
Estimated median house or condo value in 2022: $97,361 (it was $66,400 in 2000 )
Ashtabula:
$97,361Ohio:
$204,100
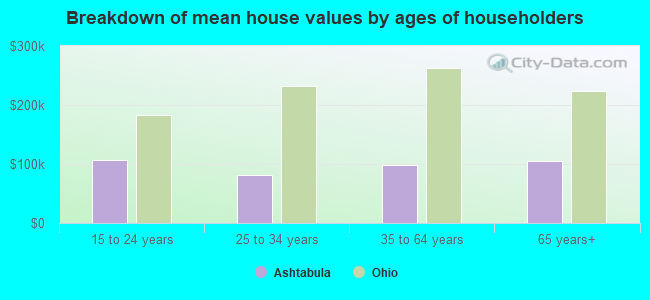
Lower value quartile - upper value quartile: $60,597 - $140,196Mean price in 2022: Detached houses: $123,439 Here:
$123,439State:
$254,366
Townhouses or other attached units: $167,444 Here:
$167,444State:
$225,733
In 2-unit structures: $198,397 Here:
$198,397State:
$144,384
In 3-to-4-unit structures: $186,563 Here:
$186,563State:
$203,002
Mobile homes: $21,690 Here:
$21,690State:
$62,719
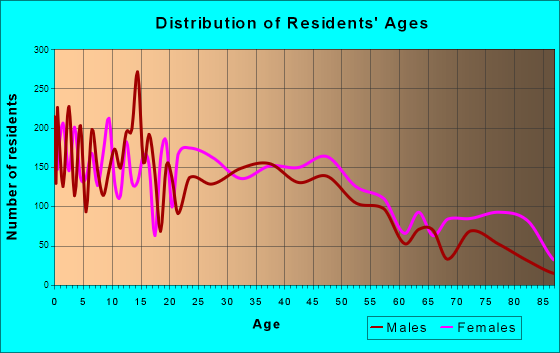
Total population: 18,508 (All urban)
Houses: 8,621 (7,698 occupied: 4,096 owner occupied, 3,638 renter occupied )
% of renters here:
47%State:
33%
Housing density: 1,142 houses/condos per square mile
Median price asked for vacant for-sale houses and condos in 2022: $72,416.
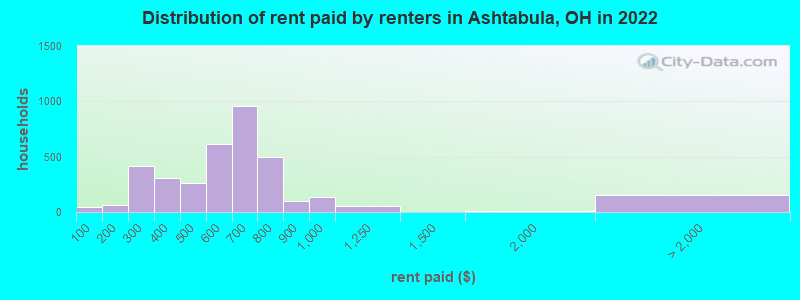
Median contract rent in 2022: $610 (lower quartile is $445, upper quartile is $694)
Median rent asked for vacant for-rent units in 2022: $1,057
Median gross rent in Ashtabula, OH in 2022: $778
Housing units in Ashtabula with a mortgage: 2,039 (166 second mortgage, 54 home equity loan, 113 both second mortgage and home equity loan )Houses without a mortgage: 81
Median household income for houses/condos with a mortgage: $53,032
Median household income for apartments without a mortgage: $52,414
Median monthly housing costs: $721
Data:
Median house or condo value ($)
Median house or condo value ($ change since 2000)
Median house or condo value ($) - White
Median house or condo value ($) - Black or African American
Median house or condo value ($) - Asian
Median house or condo value ($) - Hispanic or Latino
Median house or condo value ($) - American Indian and Alaska Native
Median house or condo value ($) - Multirace
Median house or condo value ($) - Other Race
Median price asked for mobile homes ($)
Household density (households per square mile)
Mean house or condo value by units in structure - 1, detached ($)
Mean house or condo value by units in structure - 1, attached ($)
Mean house or condo value by units in structure - 2 ($)
Mean house or condo value by units in structure by units in structure - 3 or 4 ($)
Mean house or condo value by units in structure - 5 or more ($)
Mean house or condo value by units in structure - Boat, RV, van, etc. ($)
Mean house or condo value by units in structure - Mobile home ($)
Median contract rent ($)
Median contract rent - Lower quartile ($)
Median contract rent - Upper quartile ($)
Median gross rent ($)
Urban houses (%)
Rural houses (%)
Houses occupied (%)
Houses occupied (% change since 2000)
Houses owner occupied (%)
Houses owner occupied (% change since 2000)
Houses renter occupied (%)
Houses renter occupied (% change since 2000)
Vacant housing units - For rent (%)
Vacant housing units - For rent (% change since 2000)
Vacant housing units - For sale only (%)
Vacant housing units - For sale only (% change since 2000)
Vacant housing units - Rented or sold, not occupied (%)
Vacant housing units - Rented or sold, not occupied (% change since 2000)
Vacant housing units - For seasonal, recreational, or occasional use (%)
Vacant housing units - For seasonal, recreational, or occasional use (% change since 2000)
Vacant housing units - For migrant workers (%)
Vacant housing units - For migrant workers (% change since 2000)
Vacant housing units - Other vacant (%)
Vacant housing units - Other vacant (% change since 2000)
Median monthly housing costs ($)
Median household income for houses/condos with a mortgage ($)
Median household income for houses/condos without a mortgage ($)
Median household income ($)
Median household income ($) - White
Median household income ($) - Black or African American
Median household income ($) - Asian
Median household income ($) - Hispanic or Latino
Median household income ($) - American Indian and Alaska Native
Median household income ($) - Multirace
Median household income ($) - Other Race
Mortgage status - with mortgage (%)
Mortgage status - with second mortgage (%)
Mortgage status - with home equity loan (%)
Mortgage status - with both second mortgage and home equity loan (%)
Mortgage status - without a mortgage (%)
Median year house/condo built
Median year apartment built
Household type by relationship - Male householder living alone (%)
Household type by relationship - Male householder not living alone (%)
Household type by relationship - Female householder living alone (%)
Household type by relationship - Female householder not living alone (%)
Household type by relationship - Opposite-Sex spouse (%)
Household type by relationship - Same-Sex spouse (%)
Household type by relationship - Opposite-Sex unmarried partner (%)
Household type by relationship - Same-Sex unmarried partner (%)
Household type by relationship - In group quarters (%)
Size of family households - 2-person household (%)
Size of family households - 3-person household (%)
Size of family households - 4-person household (%)
Size of family households - 5-person household (%)
Size of family households - 6-person household (%)
Size of family households - 7-or-more-person household (%)
Size of nonfamily households - 1-person household (%)
Size of nonfamily households - 2-person household (%)
Size of nonfamily households - 3-person household (%)
Size of nonfamily households - 4-person household (%)
Size of nonfamily households - 5-person household (%)
Size of nonfamily households - 6-person household (%)
Size of nonfamily households - 7-or-moreperson household (%)
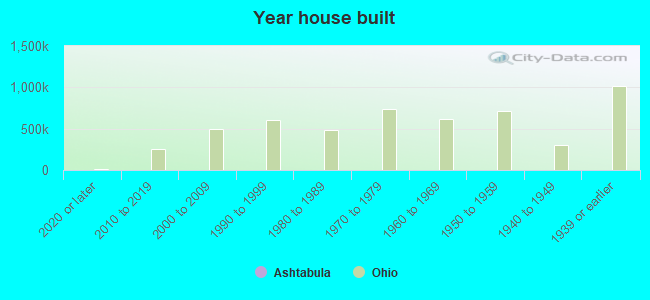
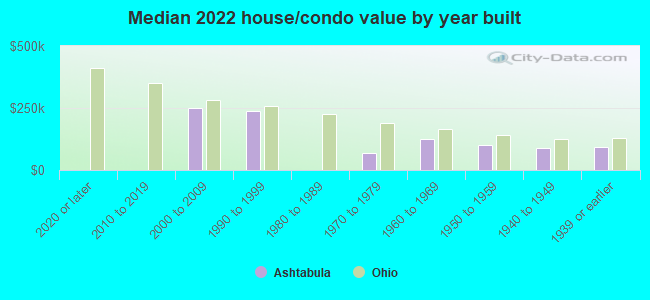
Year house built - Built 2010 or later (%)
Year house built - Built 2000 to 2009 (%)
Year house built - Built 1990 to 1999 (%)
Year house built - Built 1980 to 1989 (%)
Year house built - Built 1970 to 1979 (%)
Year house built - Built 1960 to 1969 (%)
Year house built - Built 1950 to 1959 (%)
Year house built - Built 1940 to 1949 (%)
Year house built - Built 1939 or earlier (%)
Median number of rooms in houses and condos
Median number of rooms in apartments
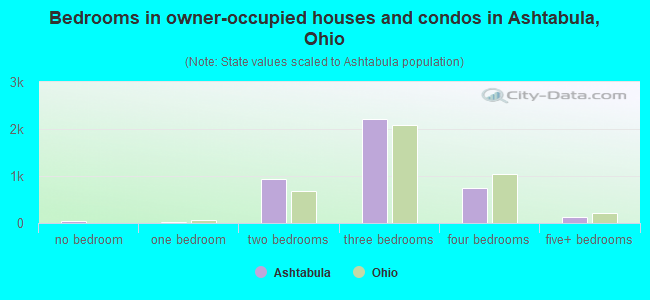
Median number of bedrooms in owner occupied houses
Mean number of bedrooms in owner occupied houses
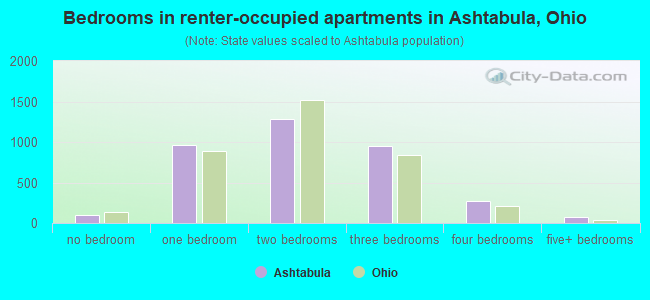
Median number of bedrooms in renter occupied houses
Mean number of bedrooms in renter occupied houses
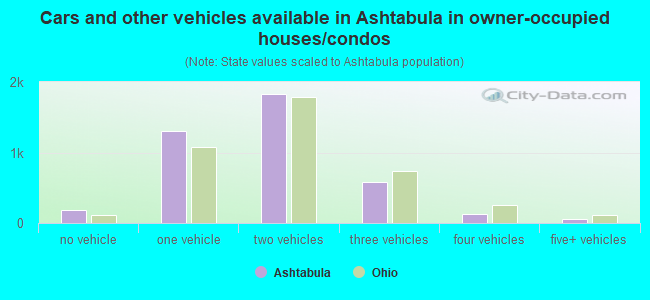
Median number of vehichles in owner occupied houses
Mean number of vehichles in owner occupied houses
Median number of vehichles in renter occupied houses
Mean number of vehichles in renter occupied houses
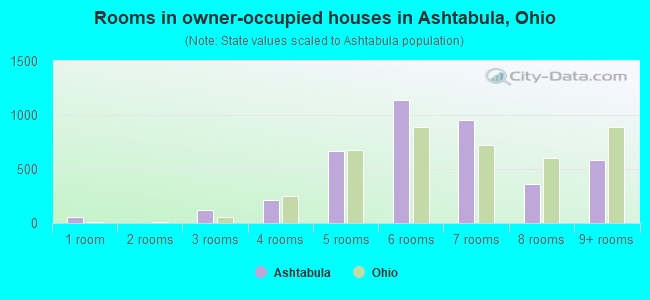
Rooms in owner-occupied houses - 1 room (%)
Rooms in owner-occupied houses - 2 rooms (%)
Rooms in owner-occupied houses - 3 rooms (%)
Rooms in owner-occupied houses - 4 rooms (%)
Rooms in owner-occupied houses - 5 rooms (%)
Rooms in owner-occupied houses - 6 rooms (%)
Rooms in owner-occupied houses - 7 rooms (%)
Rooms in owner-occupied houses - 8 rooms (%)
Rooms in owner-occupied houses - 9+ rooms (%)
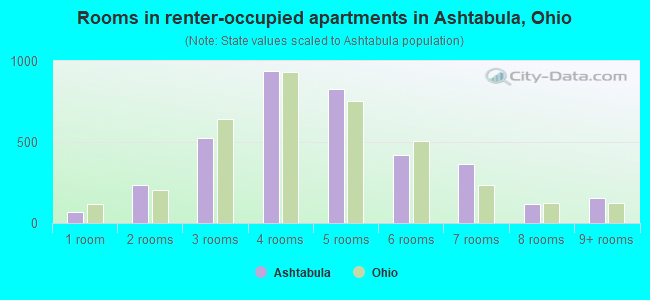
Rooms in renter-occupied houses - 1 room (%)
Rooms in renter-occupied houses - 2 rooms (%)
Rooms in renter-occupied houses - 3 rooms (%)
Rooms in renter-occupied houses - 4 rooms (%)
Rooms in renter-occupied houses - 5 rooms (%)
Rooms in renter-occupied houses - 6 rooms (%)
Rooms in renter-occupied houses - 7 rooms (%)
Rooms in renter-occupied houses - 8 rooms (%)
Rooms in renter-occupied houses - 9+ rooms (%)
Bedrooms in owner-occupied houses - no bedrooms (%)
Bedrooms in owner-occupied houses - 1 bedroom (%)
Bedrooms in owner-occupied houses - 2 bedrooms (%)
Bedrooms in owner-occupied houses - 3 bedrooms (%)
Bedrooms in owner-occupied houses - 4 bedrooms (%)
Bedrooms in owner-occupied houses - 5+ bedrooms (%)
Bedrooms in renter-occupied houses - no bedrooms (%)
Bedrooms in renter-occupied houses - 1 bedroom (%)
Bedrooms in renter-occupied houses - 2 bedrooms (%)
Bedrooms in renter-occupied houses - 3 bedrooms (%)
Bedrooms in renter-occupied houses - 4 bedrooms (%)
Bedrooms in renter-occupied houses - 5+ bedrooms (%)
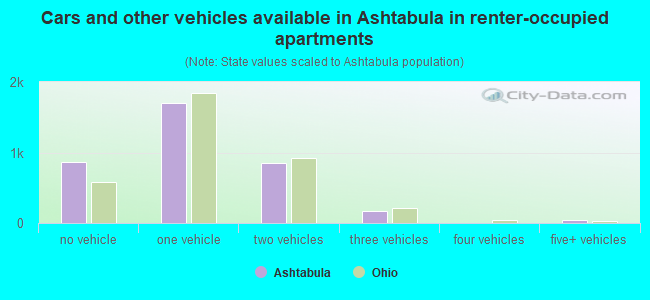
Vehicles available in owner-occupied houses - no vehicle available (%)
Vehicles available in owner-occupied houses - 1 vehicle available(%)
Vehicles available in owner-occupied houses - 2 Vehicles available (%)
Vehicles available in owner-occupied houses - 3 Vehicles available (%)
Vehicles available in owner-occupied houses - 4 Vehicles available (%)
Vehicles available in owner-occupied houses - 5+ Vehicles available (%)
Vehicles available in renter-occupied houses - no vehicle available (%)
Vehicles available in renter-occupied houses - 1 vehicle available (%)
Vehicles available in renter-occupied houses - 2 Vehicles available (%)
Vehicles available in renter-occupied houses - 3 Vehicles available (%)
Vehicles available in renter-occupied houses - 4 Vehicles available (%)
Vehicles available in renter-occupied houses - 5+ Vehicles available (%)
Housing units in structures - 1, detached (%)
Housing units in structures - 1, attached (%)
Housing units in structures - 2 (%)
Housing units in structures - 3 or 4 (%)
Housing units in structures - 5 to 9 (%)
Housing units in structures - 10 to 19 (%)
Housing units in structures - 20 to 49 (%)
Housing units in structures - 50 or more (%)
Housing units in structures - Mobile home (%)
Housing units in structures - Boat, RV, van, etc. (%)
Housing units in structures - Owners - 1, detached (%)
Housing units in structures - Owners - 1, attached (%)
Housing units in structures - Owners - 2 (%)
Housing units in structures - Owners - 3 or 4 (%)
Housing units in structures - Owners - 5 to 9 (%)
Housing units in structures - Owners - 10 to 19 (%)
Housing units in structures - Owners - 20 to 49 (%)
Housing units in structures - Owners - 50 or more (%)
Housing units in structures - Owners - Mobile home (%)
Housing units in structures - Owners - Boat, RV, van, etc. (%)
Housing units in structures - Renters - 1, detached (%)
Housing units in structures - Renters - 1, attached (%)
Housing units in structures - Renters - 2 (%)
Housing units in structures - Renters - 3 or 4 (%)
Housing units in structures - Renters - 5 to 9 (%)
Housing units in structures - Renters - 10 to 19 (%)
Housing units in structures - Renters - 20 to 49 (%)
Housing units in structures - Renters - 50 or more (%)
Housing units in structures - Renters - Mobile home (%)
Housing units in structures - Renters - Boat, RV, van, etc. (%)
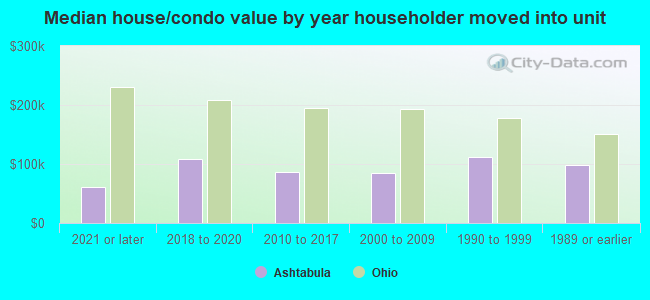
House/condo owner moved in on average (years ago)
Renter moved in on average (years ago)
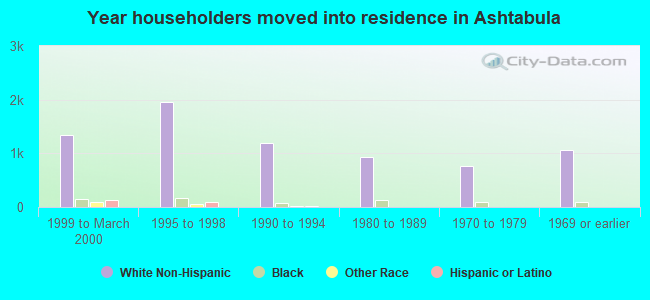
Year householder moved into unit - Moved in 1999 to March 2000 (%)
Year householder moved into unit - Moved in 1999 to March 2000 (%) - White
Year householder moved into unit - Moved in 1999 to March 2000 (%) - Black or African American
Year householder moved into unit - Moved in 1999 to March 2000 (%) - Asian
Year householder moved into unit - Moved in 1999 to March 2000 (%) - Hispanic or Latino
Year householder moved into unit - Moved in 1999 to March 2000 (%) - American Indian and Alaska Native
Year householder moved into unit - Moved in 1999 to March 2000 (%) - Multirace
Year householder moved into unit - Moved in 1999 to March 2000 (%) - Other Race
Year householder moved into unit - Moved in 1995 to 1998 (%)
Year householder moved into unit - Moved in 1995 to 1998 (%) - White
Year householder moved into unit - Moved in 1995 to 1998 (%) - Black or African American
Year householder moved into unit - Moved in 1995 to 1998 (%) - Asian
Year householder moved into unit - Moved in 1995 to 1998 (%) - Hispanic or Latino
Year householder moved into unit - Moved in 1995 to 1998 (%) - American Indian and Alaska Native
Year householder moved into unit - Moved in 1995 to 1998 (%) - Multirace
Year householder moved into unit - Moved in 1995 to 1998 (%) - Other Race
Year householder moved into unit - Moved in 1990 to 1994 (%)
Year householder moved into unit - Moved in 1990 to 1994 (%) - White
Year householder moved into unit - Moved in 1990 to 1994 (%) - Black or African American
Year householder moved into unit - Moved in 1990 to 1994 (%) - Asian
Year householder moved into unit - Moved in 1990 to 1994 (%) - Hispanic or Latino
Year householder moved into unit - Moved in 1990 to 1994 (%) - American Indian and Alaska Native
Year householder moved into unit - Moved in 1990 to 1994 (%) - Multirace
Year householder moved into unit - Moved in 1990 to 1994 (%) - Other Race
Year householder moved into unit - Moved in 1980 to 1989 (%)
Year householder moved into unit - Moved in 1980 to 1989 (%) - White
Year householder moved into unit - Moved in 1980 to 1989 (%) - Black or African American
Year householder moved into unit - Moved in 1980 to 1989 (%) - Asian
Year householder moved into unit - Moved in 1980 to 1989 (%) - Hispanic or Latino
Year householder moved into unit - Moved in 1980 to 1989 (%) - American Indian and Alaska Native
Year householder moved into unit - Moved in 1980 to 1989 (%) - Multirace
Year householder moved into unit - Moved in 1980 to 1989 (%) - Other Race
Year householder moved into unit - Moved in 1970 to 1979 (%)
Year householder moved into unit - Moved in 1970 to 1979 (%) - White
Year householder moved into unit - Moved in 1970 to 1979 (%) - Black or African American
Year householder moved into unit - Moved in 1970 to 1979 (%) - Asian
Year householder moved into unit - Moved in 1970 to 1979 (%) - Hispanic or Latino
Year householder moved into unit - Moved in 1970 to 1979 (%) - American Indian and Alaska Native
Year householder moved into unit - Moved in 1970 to 1979 (%) - Multirace
Year householder moved into unit - Moved in 1970 to 1979 (%) - Other Race
Year householder moved into unit - Moved in 1969 or earlier (%)
Year householder moved into unit - Moved in 1969 or earlier (%) - White
Year householder moved into unit - Moved in 1969 or earlier (%) - Black or African American
Year householder moved into unit - Moved in 1969 or earlier (%) - Asian
Year householder moved into unit - Moved in 1969 or earlier (%) - Hispanic or Latino
Year householder moved into unit - Moved in 1969 or earlier (%) - American Indian and Alaska Native
Year householder moved into unit - Moved in 1969 or earlier (%) - Multirace
Year householder moved into unit - Moved in 1969 or earlier (%) - Other Race
Housing units lacking complete plumbing facilities (%)
Housing units lacking complete kitchen facilities (%)
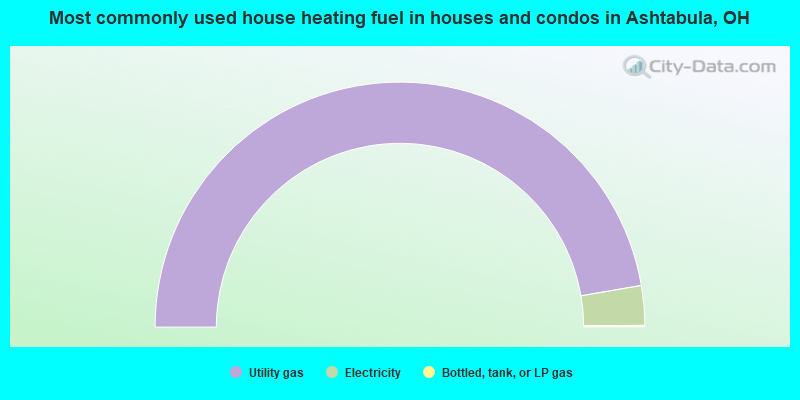
House heating fuel used in houses and condos - Utility gas (%)
House heating fuel used in houses and condos - Bottled, tank, or LP gas (%)
House heating fuel used in houses and condos - Electricity (%)
House heating fuel used in houses and condos - Fuel oil, kerosene, etc. (%)
House heating fuel used in houses and condos - Coal or coke (%)
House heating fuel used in houses and condos - Wood (%)
House heating fuel used in houses and condos - Solar energy (%)
House heating fuel used in houses and condos - Other fuel (%)
House heating fuel used in houses and condos - No fuel used (%)
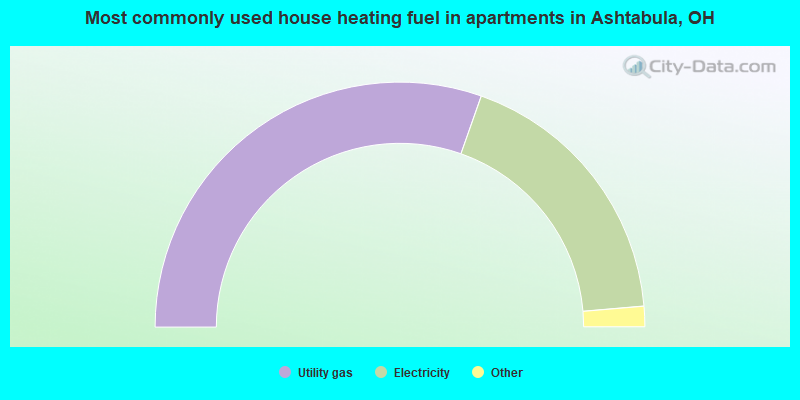
House heating fuel used in apartments - Utility gas (%)
House heating fuel used in apartments - Bottled, tank, or LP gas (%)
House heating fuel used in apartments - Electricity (%)
House heating fuel used in apartments - Fuel oil, kerosene, etc. (%)
House heating fuel used in apartments - Coal or coke (%)
House heating fuel used in apartments - Wood (%)
House heating fuel used in apartments - Solar energy (%)
House heating fuel used in apartments - Other fuel (%)
House heating fuel used in apartments - No fuel used (%)
Latest news about housing in Ashtabula, OH collected exclusively by city-data.com from local newspapers, TV, and radio stations
Median year house/condo built: 1938Median year apartment built: 1965Household type by relationship:
Households: 17,882
Male householders: 3,574 (1,488 living alone ), Female householders: 4,039 (1,448 living alone )2,409 spouses (2,409 opposite-sex spouses ), 794 unmarried partners , (718 opposite-sex unmarried partners ), 4,976 children (4,728 natural , 66 adopted , 181 stepchildren ), 467 grandchildren , 150 brothers or sisters , 219 parents , 0 foster children , 116 other relatives , 828 non-relatives In group quarters: 303
Size of family households: 1,805 2-persons , 1,229 3-persons , 709 4-persons , 239 5-persons , 123 6-persons , 11 7-or-more-persons .
Size of nonfamily households: 2,963 1-person , 576 2-persons , 21 3-persons , 31 4-persons , 35 5-persons .
1,380 married couples with children. single-parent households (314 men , 2,151 women ).
91.4% of residents of Ashtabula speak English at home. of residents speak Spanish at home (49% speak English very well , 35% speak English well , 15% speak English not well , 1% don't speak English at all ).of residents speak other Indo-European language at home (69% speak English very well , 15% speak English well , 16% speak English not well ).of residents speak Asian or Pacific Island language at home (24% speak English very well , 76% speak English well ).of residents speak other language at home (46% speak English very well , 54% speak English not well ).
Foreign born population: 320 (1.8%)of them are naturalized citizens )
Median number of rooms in houses and condos:
Median number of rooms in apartments
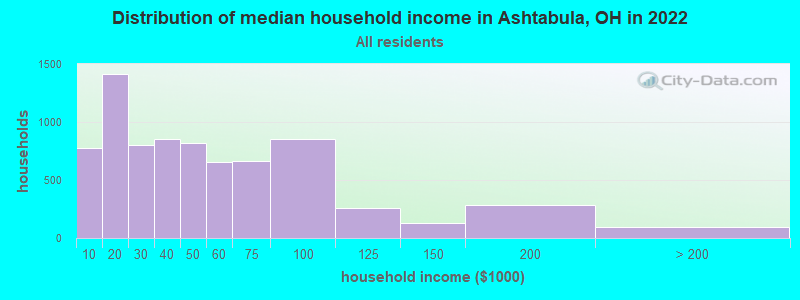
Ashtabula, OH household income distribution 773 Less than $10,0001,410 $10,000 to $19,999802 $20,000 to $29,999855 $30,000 to $39,999815 $40,000 to $49,999656 $50,000 to $59,999665 $60,000 to $74,999850 $75,000 to $99,999260 $100,000 to $124,999128 $125,000 to $149,999284 $150,000 to $199,99998 $200,000 or more
Home value of owner - occupied houses in 2022 in Ashtabula, OH 100 Less than $10,00014 $10,000 to $14,99912 $15,000 to $19,999114 $20,000 to $24,99949 $25,000 to $29,99964 $30,000 to $34,9998 $35,000 to $39,999331 $40,000 to $49,999239 $50,000 to $59,999354 $60,000 to $69,999254 $70,000 to $79,999301 $80,000 to $89,999453 $90,000 to $99,999619 $100,000 to $124,999318 $125,000 to $149,999285 $150,000 to $174,99996 $175,000 to $199,999125 $200,000 to $249,99927 $250,000 to $299,99986 $300,000 to $399,99912 $400,000 to $499,99924 $500,000 to $749,999Rent paid by renters in 2022 in Ashtabula, OH 44 Less than $10039 $100 to $14920 $150 to $199122 $200 to $249291 $250 to $299169 $300 to $349138 $350 to $399103 $400 to $449156 $450 to $499359 $500 to $549257 $550 to $599380 $600 to $649580 $650 to $699198 $700 to $749295 $750 to $799102 $800 to $899139 $900 to $99958 $1,000 to $1,2498 $1,500 to $1,999150 No cash rent
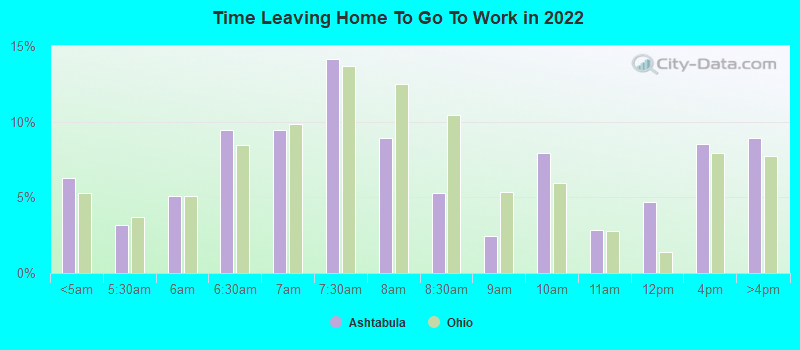
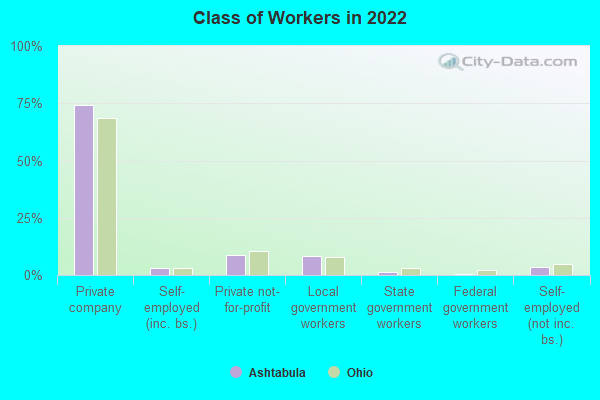
Percentage of workers working in this county: 86.6%Number of people working at home: 137 (2.0% of all workers )
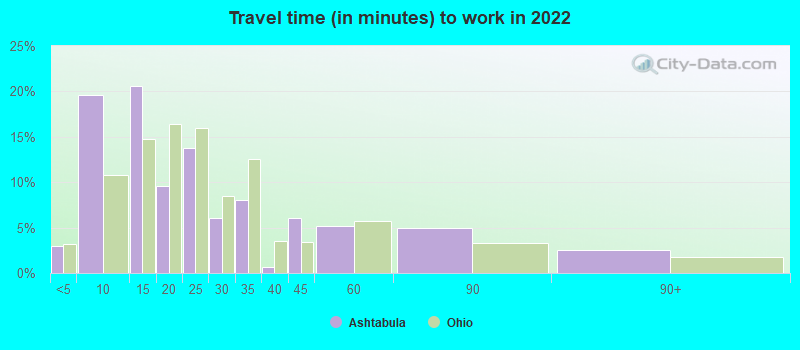
Travel time to work (commute)
Less than 5 minutes: 1925 to 9 minutes: 1,55710 to 14 minutes: 1,47915 to 19 minutes: 75020 to 24 minutes: 75925 to 29 minutes: 11830 to 34 minutes: 50335 to 39 minutes: 11240 to 44 minutes: 42645 to 59 minutes: 14260 to 89 minutes: 30890 or more minutes: 153
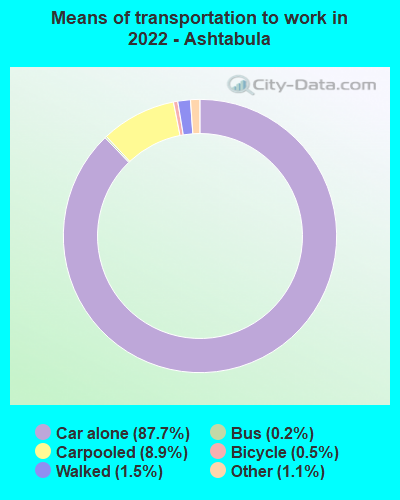
Means of transportation to work:
Drove a car alone: 5,825 (82.6%)Carpooled: 633 (9.0%)Bus : 12 (0.2%)Taxi: 90 (1.3%)Bicycle: 38 (0.5%)Walked: 103 (1.5%)Worked at home: 154 (2.2%)
Unemployment by race in 2022
Unemployment rate for White non-Hispanic residents 6.6% Males7.4% FemalesUnemployment rate for Black residents 16.7% Males27.1% FemalesUnemployment rate for other race residents 4.9% MalesUnemployment rate for two or more race residents 17.2% Males26.8% FemalesUnemployment rate for Hispanic or Latino residents 26.8% Males45.1% Females
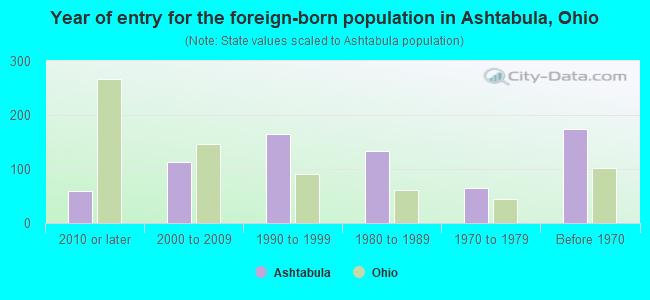
Year of entry for the foreign-born population in Ashtabula, Ohio
59 2010 or later 113 2000 to 2009 165 1990 to 1999 133 1980 to 1989 65 1970 to 1979 175 Before 1970
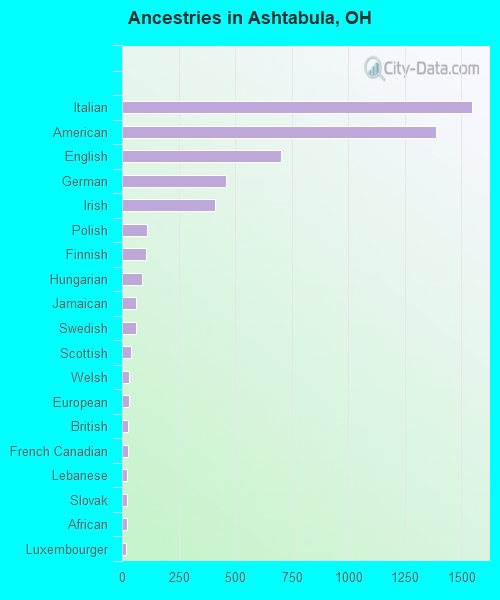
First ancestries reported:
Italian: 1,546 (19.5%)
American: 1,389 (17.5%)
English: 703 (8.9%)
German: 460 (5.8%)
Irish: 412 (5.2%)
Polish: 112 (1.4%)
Finnish: 106 (1.3%)
Hungarian: 89 (1.1%)
Jamaican: 63 (0.8%)
Swedish: 61 (0.8%)
Scottish: 38 (0.5%)
Welsh: 33 (0.4%)
European: 30 (0.4%)
British: 27 (0.3%)
French Canadian: 25 (0.3%)
Lebanese: 21 (0.3%)
Slovak: 20 (0.3%)
African: 20 (0.3%)
Luxembourger: 17 (0.2%)
Slovene: 14 (0.2%)
Russian: 9 (0.1%)
Scotch-Irish: 8 (0.1%)
Slavic: 7 (0.09%)
Czech: 5 (0.06%)
Icelander: 5 (0.06%)
Croatian: 4 (0.05%)
Portuguese: 4 (0.05%)
Scandinavian: 4 (0.05%) Most common places of birth for foreign-born residents (%): Mexico Ashtabula:
61.8% (328)Ohio:
7.8% (44,796)
Venezuela Ashtabula:
13.9% (74)Ohio:
0.7% (3,920)
Hungary Ashtabula:
7.0% (37)Ohio:
0.4% (2,140)
China, excluding Hong Kong and Taiwan Ashtabula:
5.1% (27)Ohio:
6.2% (35,703)
Peru Ashtabula:
3.6% (19)Ohio:
0.6% (3,210)
Canada Ashtabula:
2.6% (14)Ohio:
2.6% (14,988)
Ukraine Ashtabula:
1.7% (9)Ohio:
1.7% (9,564)
Scotland Ashtabula:
1.7% (9)Ohio:
0.2% (1,424)
Place of birth for U.S.-born residents:
This state: 13,638Other state: 3,288Northeast: 1,339Midwest: 326South: 1,047West: 566 86.7% of Ashtabula residents lived in the same house 1 years ago.
Out of people who lived in different houses, 42.9% lived in this county.
Out of people who lived in different counties, 33.0% lived in Ohio.
Ashtabula:
86.7%State average:
87.8%
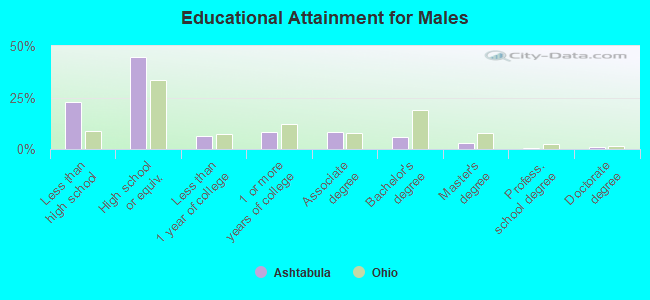
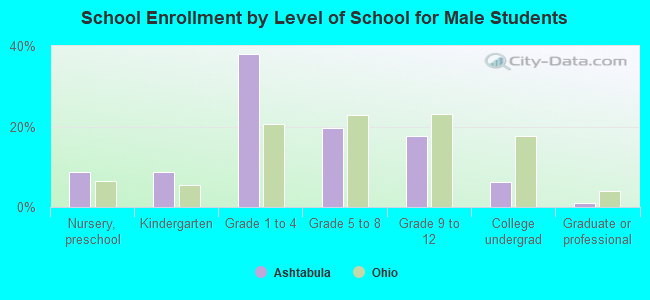
Education attainment for males 25 years and older:
No schooling: 247Nursery to 4th grade: 115th and 6th grade: 617th and 8th grade: 499th grade: 6210th grade: 24311th grade: 32112th grade, no diploma: 401High school graduate (or equivalency): 2,753Less than 1 year of college: 393Some college more than 1 year, no degree: 492Associate degree: 496Bachelor's degree: 370Master's degree: 165Professional school degree: 24Doctorate degree: 57
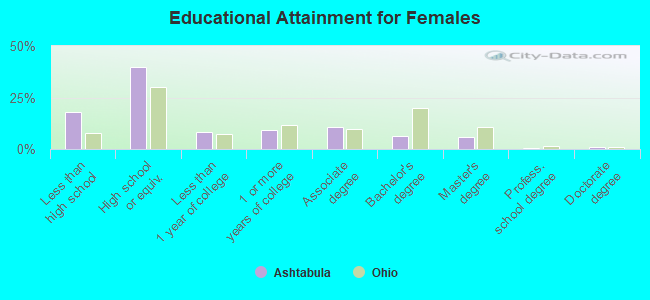
Education attainment for females 25 years and older:
No schooling: 246Nursery to 4th grade: 125th and 6th grade: 07th and 8th grade: 879th grade: 11910th grade: 7311th grade: 40312th grade, no diploma: 242High school graduate (or equivalency): 2,605Less than 1 year of college: 536Some college more than 1 year, no degree: 616Associate degree: 700Bachelor's degree: 396Master's degree: 390Professional school degree: 23Doctorate degree: 61
Housing units in structures:
One, detached: 6,029One, attached: 99Two: 6363 or 4: 4505 to 9: 27810 to 19: 25620 to 49: 18450 or more: 454Mobile homes: 230Median worth of mobile homes: $13,118
Housing units lacking complete plumbing facilities in 2022: 5.4%Housing units lacking complete kitchen facilities in 2022: 5.8%House/condo owner moved in on average 17 years ago
Renter moved in on average 2 years ago
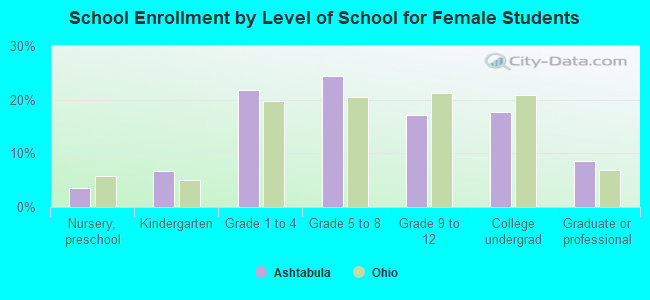
Private vs. public school enrollment:
Students in private schools in grades 1 to 8 (elementary and middle school): 180 Students in private schools in grades 9 to 12 (high school): 52 Students in private undergraduate colleges: 112