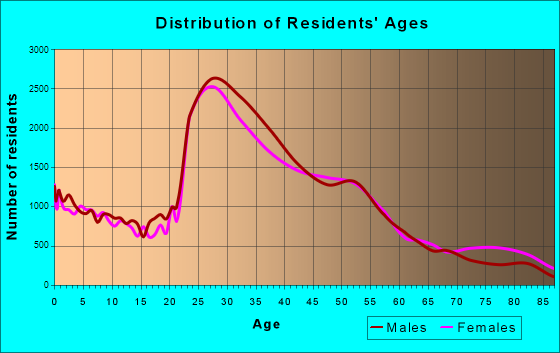
Arlington, VA (Virginia) Houses and Residents
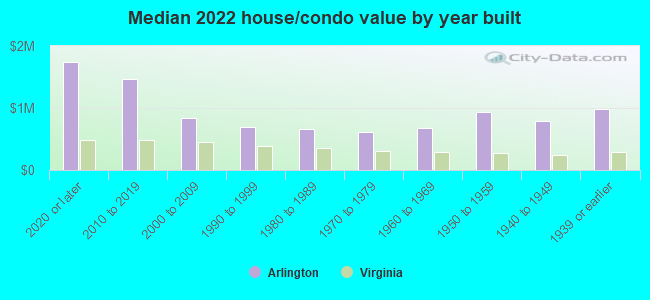
Estimated median house or condo value in 2022: $828,500 (it was $233,700 in 2000 )
Arlington:
$828,500Virginia:
$365,700
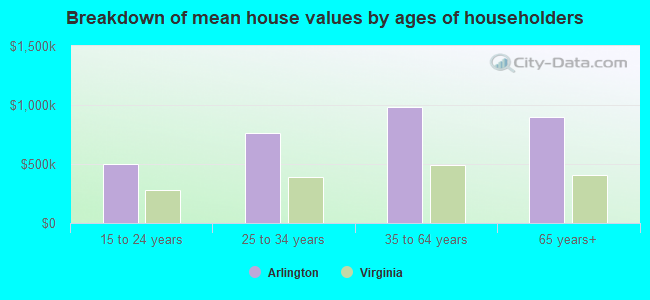
Lower value quartile - upper value quartile: $546,500 - $1,192,900Mean price in 2022: Detached houses: $1,246,693 Here:
$1,246,693State:
$472,865
Townhouses or other attached units: $826,328 Here:
$826,328State:
$457,437
In 2-unit structures: $752,157 Here:
$752,157State:
$396,289
In 3-to-4-unit structures: $492,806 Here:
$492,806State:
$252,346
In 5-or-more-unit structures: $651,798 Here:
$651,798State:
$382,551
Total population: 207,627 (Urban population: 189,453, Rural population: 0)
Houses: 122,458 (112,504 occupied: 46,000 owner occupied, 66,504 renter occupied )
% of renters here:
59%State:
33%
Housing density: 4,734 houses/condos per square mile
Median price asked for vacant for-sale houses and condos in 2022: $672,904.
Median contract rent in 2022: over $2,000 (lower quartile is $1,593, upper quartile is over $2,000)
Median rent asked for vacant for-rent units in 2022: $3,770
Median gross rent in Arlington, VA in 2022: over $2,000
Housing units in Arlington with a mortgage: 34,229 (2,928 second mortgage, 145 home equity loan, 2,264 both second mortgage and home equity loan )Houses without a mortgage: 706
Median household income for houses/condos with a mortgage: $211,760
Median household income for apartments without a mortgage: $155,832
Median monthly housing costs: $2,276
Data:
Median house or condo value ($)
Median house or condo value ($ change since 2000)
Median house or condo value ($) - White
Median house or condo value ($) - Black or African American
Median house or condo value ($) - Asian
Median house or condo value ($) - Hispanic or Latino
Median house or condo value ($) - American Indian and Alaska Native
Median house or condo value ($) - Multirace
Median house or condo value ($) - Other Race
Median price asked for mobile homes ($)
Household density (households per square mile)
Mean house or condo value by units in structure - 1, detached ($)
Mean house or condo value by units in structure - 1, attached ($)
Mean house or condo value by units in structure - 2 ($)
Mean house or condo value by units in structure by units in structure - 3 or 4 ($)
Mean house or condo value by units in structure - 5 or more ($)
Mean house or condo value by units in structure - Boat, RV, van, etc. ($)
Mean house or condo value by units in structure - Mobile home ($)
Median contract rent ($)
Median contract rent - Lower quartile ($)
Median contract rent - Upper quartile ($)
Median gross rent ($)
Urban houses (%)
Rural houses (%)
Houses occupied (%)
Houses occupied (% change since 2000)
Houses owner occupied (%)
Houses owner occupied (% change since 2000)
Houses renter occupied (%)
Houses renter occupied (% change since 2000)
Vacant housing units - For rent (%)
Vacant housing units - For rent (% change since 2000)
Vacant housing units - For sale only (%)
Vacant housing units - For sale only (% change since 2000)
Vacant housing units - Rented or sold, not occupied (%)
Vacant housing units - Rented or sold, not occupied (% change since 2000)
Vacant housing units - For seasonal, recreational, or occasional use (%)
Vacant housing units - For seasonal, recreational, or occasional use (% change since 2000)
Vacant housing units - For migrant workers (%)
Vacant housing units - For migrant workers (% change since 2000)
Vacant housing units - Other vacant (%)
Vacant housing units - Other vacant (% change since 2000)
Median monthly housing costs ($)
Median household income for houses/condos with a mortgage ($)
Median household income for houses/condos without a mortgage ($)
Median household income ($)
Median household income ($) - White
Median household income ($) - Black or African American
Median household income ($) - Asian
Median household income ($) - Hispanic or Latino
Median household income ($) - American Indian and Alaska Native
Median household income ($) - Multirace
Median household income ($) - Other Race
Mortgage status - with mortgage (%)
Mortgage status - with second mortgage (%)
Mortgage status - with home equity loan (%)
Mortgage status - with both second mortgage and home equity loan (%)
Mortgage status - without a mortgage (%)
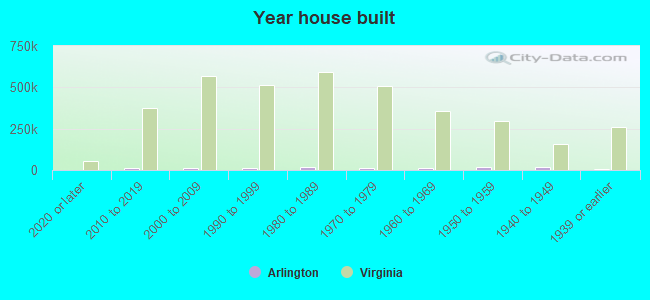
Median year house/condo built
Median year apartment built
Household type by relationship - Male householder living alone (%)
Household type by relationship - Male householder not living alone (%)
Household type by relationship - Female householder living alone (%)
Household type by relationship - Female householder not living alone (%)
Household type by relationship - Opposite-Sex spouse (%)
Household type by relationship - Same-Sex spouse (%)
Household type by relationship - Opposite-Sex unmarried partner (%)
Household type by relationship - Same-Sex unmarried partner (%)
Household type by relationship - In group quarters (%)
Size of family households - 2-person household (%)
Size of family households - 3-person household (%)
Size of family households - 4-person household (%)
Size of family households - 5-person household (%)
Size of family households - 6-person household (%)
Size of family households - 7-or-more-person household (%)
Size of nonfamily households - 1-person household (%)
Size of nonfamily households - 2-person household (%)
Size of nonfamily households - 3-person household (%)
Size of nonfamily households - 4-person household (%)
Size of nonfamily households - 5-person household (%)
Size of nonfamily households - 6-person household (%)
Size of nonfamily households - 7-or-moreperson household (%)
Year house built - Built 2010 or later (%)
Year house built - Built 2000 to 2009 (%)
Year house built - Built 1990 to 1999 (%)
Year house built - Built 1980 to 1989 (%)
Year house built - Built 1970 to 1979 (%)
Year house built - Built 1960 to 1969 (%)
Year house built - Built 1950 to 1959 (%)
Year house built - Built 1940 to 1949 (%)
Year house built - Built 1939 or earlier (%)
Median number of rooms in houses and condos
Median number of rooms in apartments
Median number of bedrooms in owner occupied houses
Mean number of bedrooms in owner occupied houses
Median number of bedrooms in renter occupied houses
Mean number of bedrooms in renter occupied houses
Median number of vehichles in owner occupied houses
Mean number of vehichles in owner occupied houses
Median number of vehichles in renter occupied houses
Mean number of vehichles in renter occupied houses
Rooms in owner-occupied houses - 1 room (%)
Rooms in owner-occupied houses - 2 rooms (%)
Rooms in owner-occupied houses - 3 rooms (%)
Rooms in owner-occupied houses - 4 rooms (%)
Rooms in owner-occupied houses - 5 rooms (%)
Rooms in owner-occupied houses - 6 rooms (%)
Rooms in owner-occupied houses - 7 rooms (%)
Rooms in owner-occupied houses - 8 rooms (%)
Rooms in owner-occupied houses - 9+ rooms (%)
Rooms in renter-occupied houses - 1 room (%)
Rooms in renter-occupied houses - 2 rooms (%)
Rooms in renter-occupied houses - 3 rooms (%)
Rooms in renter-occupied houses - 4 rooms (%)
Rooms in renter-occupied houses - 5 rooms (%)
Rooms in renter-occupied houses - 6 rooms (%)
Rooms in renter-occupied houses - 7 rooms (%)
Rooms in renter-occupied houses - 8 rooms (%)
Rooms in renter-occupied houses - 9+ rooms (%)
Bedrooms in owner-occupied houses - no bedrooms (%)
Bedrooms in owner-occupied houses - 1 bedroom (%)
Bedrooms in owner-occupied houses - 2 bedrooms (%)
Bedrooms in owner-occupied houses - 3 bedrooms (%)
Bedrooms in owner-occupied houses - 4 bedrooms (%)
Bedrooms in owner-occupied houses - 5+ bedrooms (%)
Bedrooms in renter-occupied houses - no bedrooms (%)
Bedrooms in renter-occupied houses - 1 bedroom (%)
Bedrooms in renter-occupied houses - 2 bedrooms (%)
Bedrooms in renter-occupied houses - 3 bedrooms (%)
Bedrooms in renter-occupied houses - 4 bedrooms (%)
Bedrooms in renter-occupied houses - 5+ bedrooms (%)
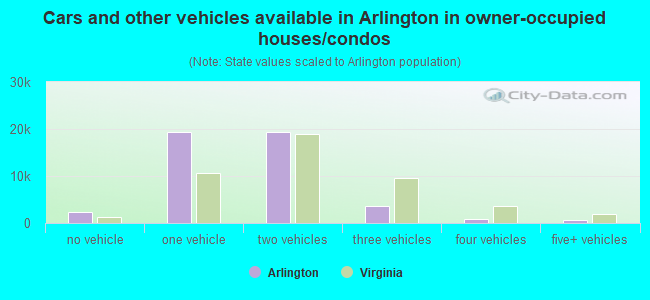
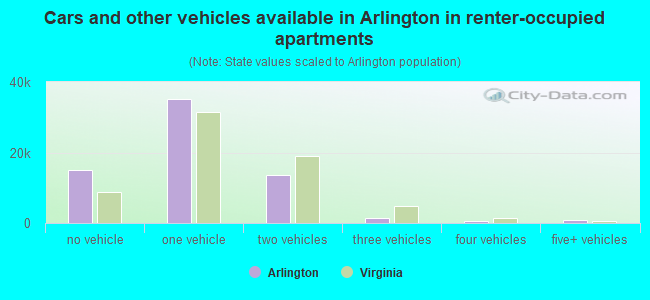
Vehicles available in owner-occupied houses - no vehicle available (%)
Vehicles available in owner-occupied houses - 1 vehicle available(%)
Vehicles available in owner-occupied houses - 2 Vehicles available (%)
Vehicles available in owner-occupied houses - 3 Vehicles available (%)
Vehicles available in owner-occupied houses - 4 Vehicles available (%)
Vehicles available in owner-occupied houses - 5+ Vehicles available (%)
Vehicles available in renter-occupied houses - no vehicle available (%)
Vehicles available in renter-occupied houses - 1 vehicle available (%)
Vehicles available in renter-occupied houses - 2 Vehicles available (%)
Vehicles available in renter-occupied houses - 3 Vehicles available (%)
Vehicles available in renter-occupied houses - 4 Vehicles available (%)
Vehicles available in renter-occupied houses - 5+ Vehicles available (%)
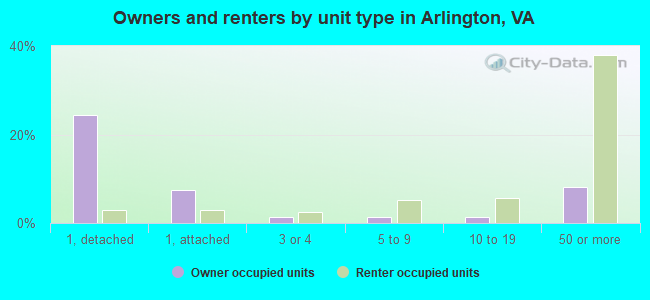
Housing units in structures - 1, detached (%)
Housing units in structures - 1, attached (%)
Housing units in structures - 2 (%)
Housing units in structures - 3 or 4 (%)
Housing units in structures - 5 to 9 (%)
Housing units in structures - 10 to 19 (%)
Housing units in structures - 20 to 49 (%)
Housing units in structures - 50 or more (%)
Housing units in structures - Mobile home (%)
Housing units in structures - Boat, RV, van, etc. (%)
Housing units in structures - Owners - 1, detached (%)
Housing units in structures - Owners - 1, attached (%)
Housing units in structures - Owners - 2 (%)
Housing units in structures - Owners - 3 or 4 (%)
Housing units in structures - Owners - 5 to 9 (%)
Housing units in structures - Owners - 10 to 19 (%)
Housing units in structures - Owners - 20 to 49 (%)
Housing units in structures - Owners - 50 or more (%)
Housing units in structures - Owners - Mobile home (%)
Housing units in structures - Owners - Boat, RV, van, etc. (%)
Housing units in structures - Renters - 1, detached (%)
Housing units in structures - Renters - 1, attached (%)
Housing units in structures - Renters - 2 (%)
Housing units in structures - Renters - 3 or 4 (%)
Housing units in structures - Renters - 5 to 9 (%)
Housing units in structures - Renters - 10 to 19 (%)
Housing units in structures - Renters - 20 to 49 (%)
Housing units in structures - Renters - 50 or more (%)
Housing units in structures - Renters - Mobile home (%)
Housing units in structures - Renters - Boat, RV, van, etc. (%)
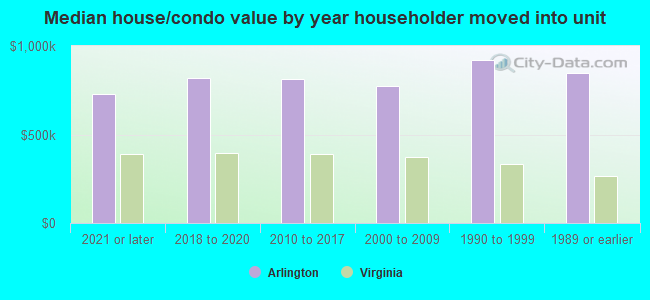
House/condo owner moved in on average (years ago)
Renter moved in on average (years ago)
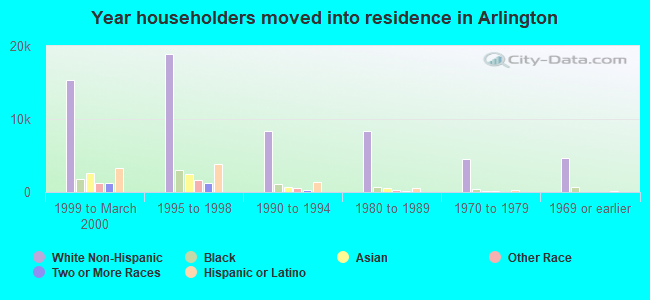
Year householder moved into unit - Moved in 1999 to March 2000 (%)
Year householder moved into unit - Moved in 1999 to March 2000 (%) - White
Year householder moved into unit - Moved in 1999 to March 2000 (%) - Black or African American
Year householder moved into unit - Moved in 1999 to March 2000 (%) - Asian
Year householder moved into unit - Moved in 1999 to March 2000 (%) - Hispanic or Latino
Year householder moved into unit - Moved in 1999 to March 2000 (%) - American Indian and Alaska Native
Year householder moved into unit - Moved in 1999 to March 2000 (%) - Multirace
Year householder moved into unit - Moved in 1999 to March 2000 (%) - Other Race
Year householder moved into unit - Moved in 1995 to 1998 (%)
Year householder moved into unit - Moved in 1995 to 1998 (%) - White
Year householder moved into unit - Moved in 1995 to 1998 (%) - Black or African American
Year householder moved into unit - Moved in 1995 to 1998 (%) - Asian
Year householder moved into unit - Moved in 1995 to 1998 (%) - Hispanic or Latino
Year householder moved into unit - Moved in 1995 to 1998 (%) - American Indian and Alaska Native
Year householder moved into unit - Moved in 1995 to 1998 (%) - Multirace
Year householder moved into unit - Moved in 1995 to 1998 (%) - Other Race
Year householder moved into unit - Moved in 1990 to 1994 (%)
Year householder moved into unit - Moved in 1990 to 1994 (%) - White
Year householder moved into unit - Moved in 1990 to 1994 (%) - Black or African American
Year householder moved into unit - Moved in 1990 to 1994 (%) - Asian
Year householder moved into unit - Moved in 1990 to 1994 (%) - Hispanic or Latino
Year householder moved into unit - Moved in 1990 to 1994 (%) - American Indian and Alaska Native
Year householder moved into unit - Moved in 1990 to 1994 (%) - Multirace
Year householder moved into unit - Moved in 1990 to 1994 (%) - Other Race
Year householder moved into unit - Moved in 1980 to 1989 (%)
Year householder moved into unit - Moved in 1980 to 1989 (%) - White
Year householder moved into unit - Moved in 1980 to 1989 (%) - Black or African American
Year householder moved into unit - Moved in 1980 to 1989 (%) - Asian
Year householder moved into unit - Moved in 1980 to 1989 (%) - Hispanic or Latino
Year householder moved into unit - Moved in 1980 to 1989 (%) - American Indian and Alaska Native
Year householder moved into unit - Moved in 1980 to 1989 (%) - Multirace
Year householder moved into unit - Moved in 1980 to 1989 (%) - Other Race
Year householder moved into unit - Moved in 1970 to 1979 (%)
Year householder moved into unit - Moved in 1970 to 1979 (%) - White
Year householder moved into unit - Moved in 1970 to 1979 (%) - Black or African American
Year householder moved into unit - Moved in 1970 to 1979 (%) - Asian
Year householder moved into unit - Moved in 1970 to 1979 (%) - Hispanic or Latino
Year householder moved into unit - Moved in 1970 to 1979 (%) - American Indian and Alaska Native
Year householder moved into unit - Moved in 1970 to 1979 (%) - Multirace
Year householder moved into unit - Moved in 1970 to 1979 (%) - Other Race
Year householder moved into unit - Moved in 1969 or earlier (%)
Year householder moved into unit - Moved in 1969 or earlier (%) - White
Year householder moved into unit - Moved in 1969 or earlier (%) - Black or African American
Year householder moved into unit - Moved in 1969 or earlier (%) - Asian
Year householder moved into unit - Moved in 1969 or earlier (%) - Hispanic or Latino
Year householder moved into unit - Moved in 1969 or earlier (%) - American Indian and Alaska Native
Year householder moved into unit - Moved in 1969 or earlier (%) - Multirace
Year householder moved into unit - Moved in 1969 or earlier (%) - Other Race
Housing units lacking complete plumbing facilities (%)
Housing units lacking complete kitchen facilities (%)
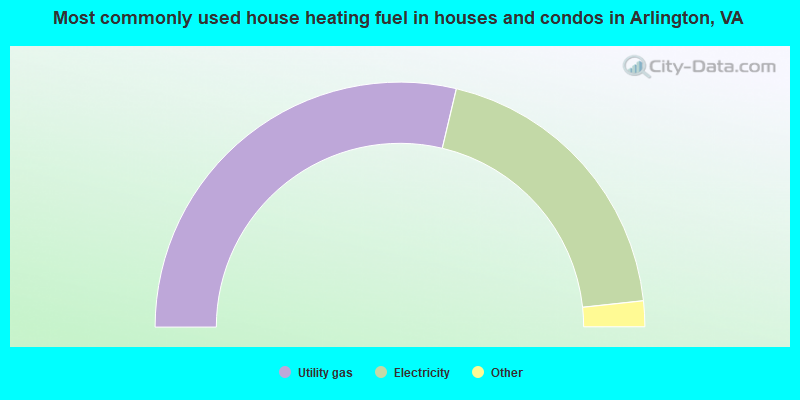
House heating fuel used in houses and condos - Utility gas (%)
House heating fuel used in houses and condos - Bottled, tank, or LP gas (%)
House heating fuel used in houses and condos - Electricity (%)
House heating fuel used in houses and condos - Fuel oil, kerosene, etc. (%)
House heating fuel used in houses and condos - Coal or coke (%)
House heating fuel used in houses and condos - Wood (%)
House heating fuel used in houses and condos - Solar energy (%)
House heating fuel used in houses and condos - Other fuel (%)
House heating fuel used in houses and condos - No fuel used (%)
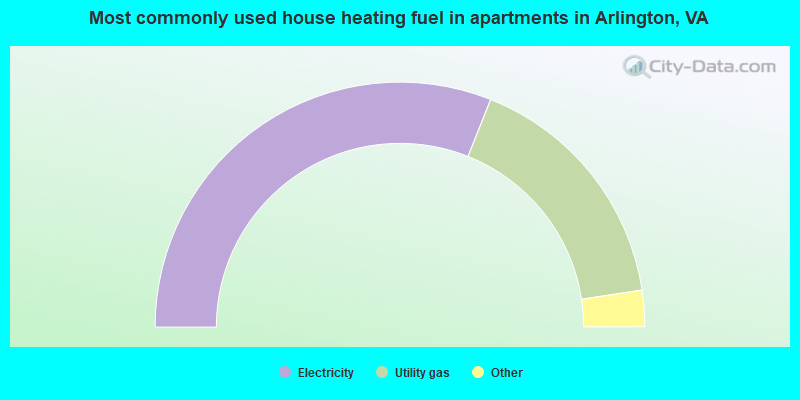
House heating fuel used in apartments - Utility gas (%)
House heating fuel used in apartments - Bottled, tank, or LP gas (%)
House heating fuel used in apartments - Electricity (%)
House heating fuel used in apartments - Fuel oil, kerosene, etc. (%)
House heating fuel used in apartments - Coal or coke (%)
House heating fuel used in apartments - Wood (%)
House heating fuel used in apartments - Solar energy (%)
House heating fuel used in apartments - Other fuel (%)
House heating fuel used in apartments - No fuel used (%)
Latest news about housing in Arlington, VA collected exclusively by city-data.com from local newspapers, TV, and radio stations
Median year house/condo built: 1961Median year apartment built: 1984Household type by relationship:
Households: 234,000
Male householders: 57,504 (22,349 living alone ), Female householders: 55,000 (26,613 living alone )39,433 spouses (38,307 opposite-sex spouses ), 8,426 unmarried partners , (7,885 opposite-sex unmarried partners ), 50,171 children (48,311 natural , 921 adopted , 939 stepchildren ), 581 grandchildren , 2,734 brothers or sisters , 1,945 parents , 0 foster children , 1,071 other relatives , 14,154 non-relatives In group quarters: 2,981
Size of family households: 22,375 2-persons , 11,212 3-persons , 10,641 4-persons , 3,060 5-persons , 498 6-persons .
Size of nonfamily households: 48,962 1-person , 13,127 2-persons , 1,393 3-persons , 825 4-persons , 236 5-persons , 38 6-persons , 137 7-or-more-persons .
33,307 married couples with children. single-parent households (2,481 men , 5,330 women ).
72.1% of residents of Arlington speak English at home. of residents speak Spanish at home (69% speak English very well , 14% speak English well , 14% speak English not well , 2% don't speak English at all ).of residents speak other Indo-European language at home (76% speak English very well , 12% speak English well , 9% speak English not well , 4% don't speak English at all ).of residents speak Asian or Pacific Island language at home (56% speak English very well , 20% speak English well , 18% speak English not well , 6% don't speak English at all ).of residents speak other language at home (64% speak English very well , 21% speak English well , 13% speak English not well , 1% don't speak English at all ).
Foreign born population: 49,949 (21.3%)of them are naturalized citizens )
Median number of rooms in houses and condos:
Median number of rooms in apartments
Owner-occupied Renter-occupied
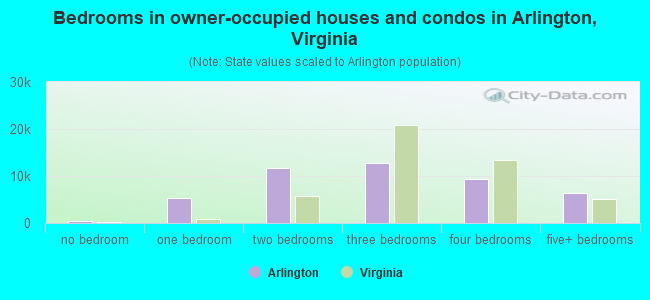
Bedrooms in owner-occupied houses and condos in Arlington, Virginia
338 no bedroom 5,338 1 bedroom 11,705 2 bedrooms 12,818 3 bedrooms 9,329 4 bedrooms 6,472 5+ bedrooms
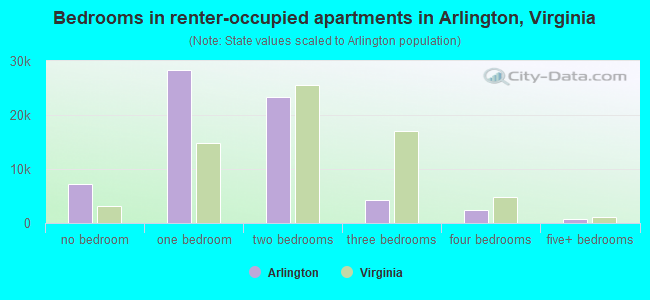
Bedrooms in renter-occupied apartments in Arlington, Virginia
7,272 no bedroom 28,411 1 bedroom 23,407 2 bedrooms 4,235 3 bedrooms 2,487 4 bedrooms 692 5+ bedrooms
Owner-occupied Renter-occupied
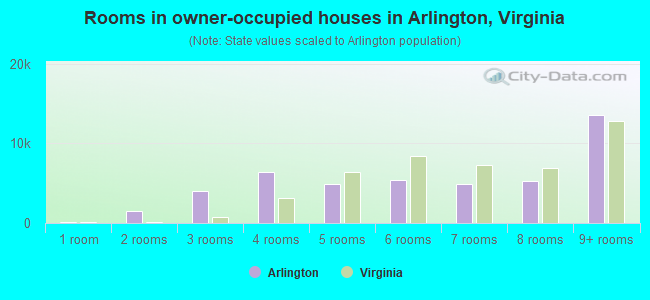
Rooms in owner-occupied houses in Arlington, Virginia
158 1 room 1,495 2 rooms 4,012 3 rooms 6,410 4 rooms 4,921 5 rooms 5,390 6 rooms 4,841 7 rooms 5,224 8 rooms 13,549 9+ rooms
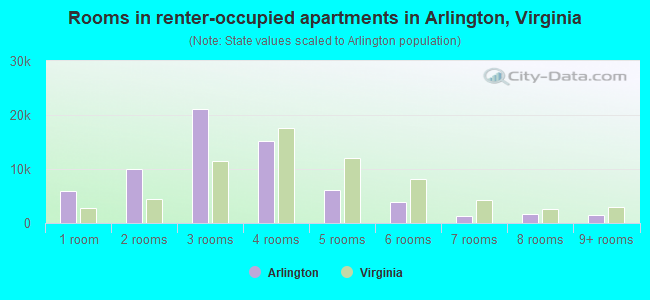
Rooms in renter-occupied apartments in Arlington, Virginia
5,955 1 room 9,996 2 rooms 21,120 3 rooms 15,136 4 rooms 6,082 5 rooms 3,839 6 rooms 1,346 7 rooms 1,587 8 rooms 1,443 9+ rooms
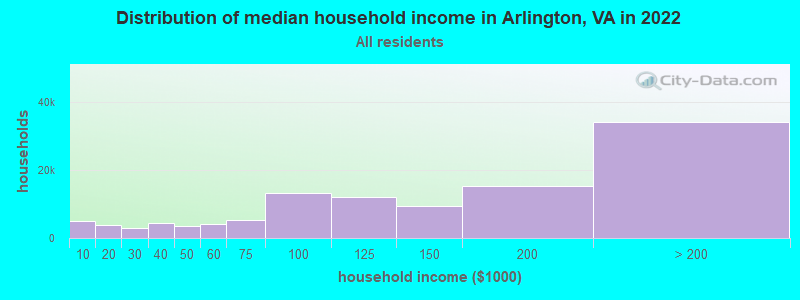
Arlington, VA household income distribution 4,895 Less than $10,0003,686 $10,000 to $19,9992,885 $20,000 to $29,9994,327 $30,000 to $39,9993,487 $40,000 to $49,9994,179 $50,000 to $59,9995,165 $60,000 to $74,99913,199 $75,000 to $99,99912,062 $100,000 to $124,9999,283 $125,000 to $149,99915,318 $150,000 to $199,99934,018 $200,000 or more
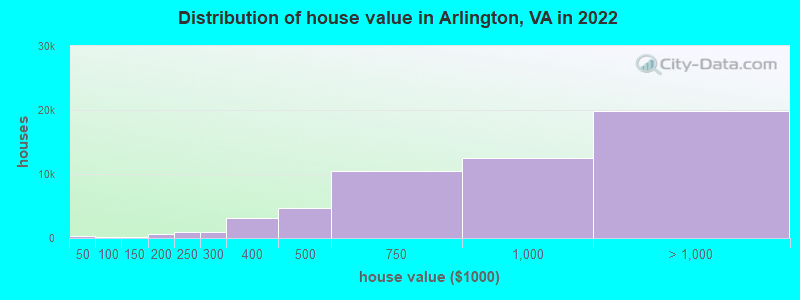
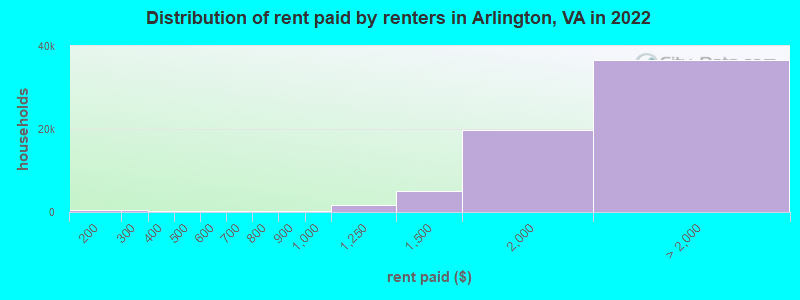
Home value of owner - occupied houses in 2022 in Arlington, VA 207 Less than $10,00033 $10,000 to $14,99916 $15,000 to $19,99919 $25,000 to $29,99922 $35,000 to $39,99910 $40,000 to $49,9998 $50,000 to $59,99953 $60,000 to $69,99932 $70,000 to $79,99939 $80,000 to $89,99917 $90,000 to $99,99952 $100,000 to $124,999158 $125,000 to $149,999277 $150,000 to $174,999320 $175,000 to $199,999926 $200,000 to $249,999917 $250,000 to $299,9993,129 $300,000 to $399,9994,648 $400,000 to $499,99910,532 $500,000 to $749,99912,461 $750,000 to $999,99913,925 $1,000,000 to $1,499,9993,967 $1,500,000 to $1,999,9992,002 $2,000,000 or moreRent paid by renters in 2022 in Arlington, VA 113 Less than $100118 $100 to $149328 $150 to $199266 $200 to $249112 $250 to $299101 $300 to $349118 $350 to $399226 $400 to $44933 $450 to $49961 $500 to $549127 $550 to $59960 $600 to $649120 $650 to $69963 $700 to $749121 $750 to $799238 $800 to $899292 $900 to $9991,583 $1,000 to $1,2495,161 $1,250 to $1,49919,843 $1,500 to $1,99915,738 $2,000 to $2,4999,566 $2,500 to $2,9994,762 $3,000 to $3,4995,582 $3,500 or more1,087 No cash rent
Percentage of workers working in this county: 57.5%Number of people working at home: 53,843 (35.8% of all workers )
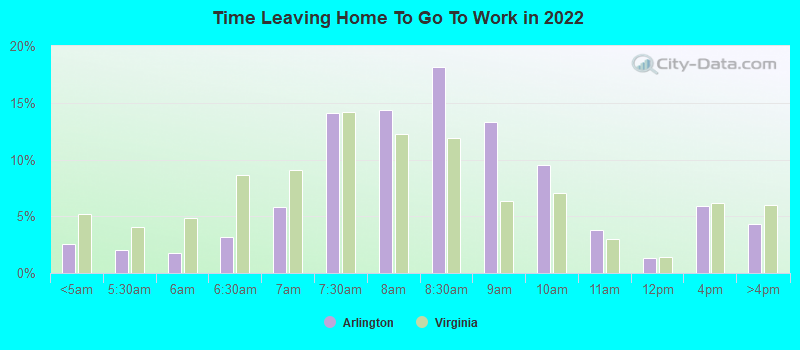
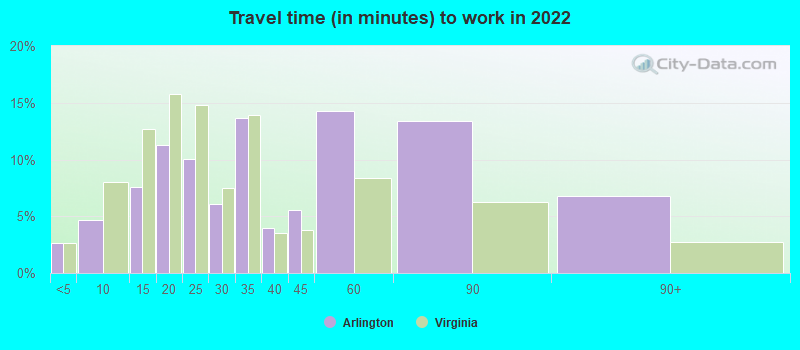
Travel time to work (commute)
Less than 5 minutes: 3,0195 to 9 minutes: 5,50510 to 14 minutes: 10,25415 to 19 minutes: 13,81520 to 24 minutes: 15,00225 to 29 minutes: 9,20630 to 34 minutes: 20,32435 to 39 minutes: 2,50840 to 44 minutes: 4,01345 to 59 minutes: 7,35860 to 89 minutes: 3,31390 or more minutes: 2,306
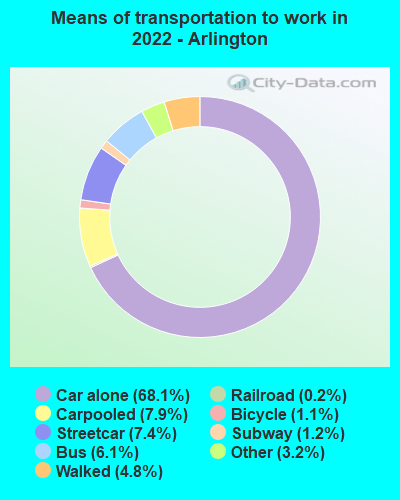
Means of transportation to work:
Drove a car alone: 85,159 (47.6%)Carpooled: 9,873 (5.5%)Bus : 7,684 (4.3%)Subway or elevated rail : 9,246 (5.2%)Long-distance train or commuter rail : 1,446 (0.8%)Light rail, streetcar or trolley : 231 (0.1%)Taxi: 3,958 (2.2%)Bicycle: 1,411 (0.8%)Walked: 5,982 (3.3%)Worked at home: 53,843 (30.1%)
Unemployment by race in 2022
Unemployment rate for White non-Hispanic residents 1.6% Males1.0% FemalesUnemployment rate for Black residents 7.3% MalesUnemployment rate for American Indian and Alaska Native residents 9.2% FemalesUnemployment rate for Asian residents 1.2% MalesUnemployment rate for other race residents 8.1% Males3.5% FemalesUnemployment rate for two or more race residents 2.9% Males1.8% FemalesUnemployment rate for Hispanic or Latino residents 8.3% Males0.8% Females
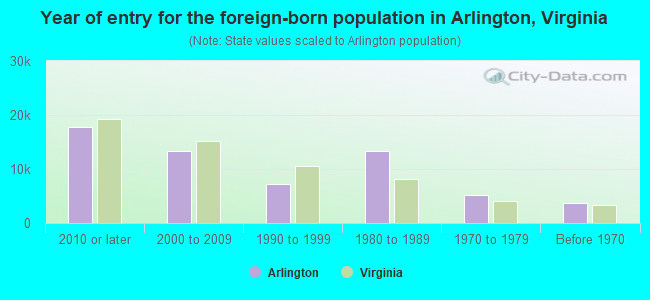
Year of entry for the foreign-born population in Arlington, Virginia
17,864 2010 or later 13,407 2000 to 2009 7,300 1990 to 1999 13,324 1980 to 1989 5,095 1970 to 1979 3,731 Before 1970
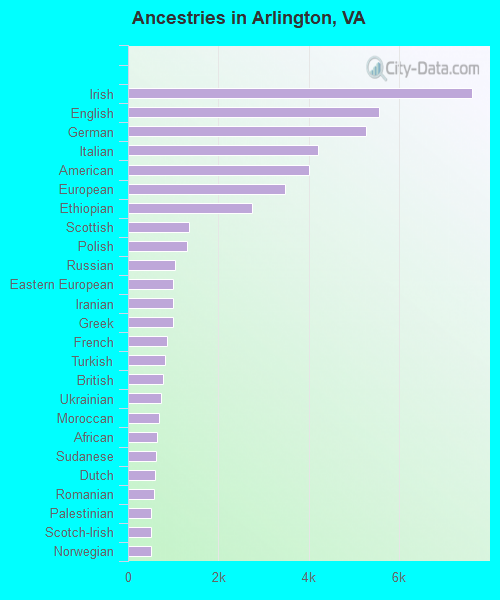
First ancestries reported:
Irish: 7,617 (6.5%)
English: 5,550 (4.7%)
German: 5,270 (4.5%)
Italian: 4,212 (3.6%)
American: 4,000 (3.4%)
European: 3,470 (3.0%)
Ethiopian: 2,743 (2.3%)
Scottish: 1,355 (1.2%)
Polish: 1,305 (1.1%)
Russian: 1,051 (0.9%)
Eastern European: 1,008 (0.9%)
Iranian: 993 (0.8%)
Greek: 989 (0.8%)
French: 863 (0.7%)
Turkish: 820 (0.7%)
British: 781 (0.7%)
Ukrainian: 739 (0.6%)
Moroccan: 682 (0.6%)
African: 648 (0.6%)
Sudanese: 614 (0.5%)
Dutch: 599 (0.5%)
Romanian: 577 (0.5%)
Palestinian: 511 (0.4%)
Scotch-Irish: 508 (0.4%)
Norwegian: 506 (0.4%)
Lebanese: 438 (0.4%)
Swedish: 424 (0.4%)
Jamaican: 393 (0.3%)
Egyptian: 386 (0.3%)
French Canadian: 359 (0.3%)
Brazilian: 358 (0.3%)
Nigerian: 332 (0.3%)
Northern European: 307 (0.3%)
Afghan: 301 (0.3%)
Serbian: 280 (0.2%)
Scandinavian: 265 (0.2%)
Portuguese: 244 (0.2%)
Armenian: 236 (0.2%)
Hungarian: 222 (0.2%)
Bulgarian: 197 (0.2%)
Iraqi: 193 (0.2%)
Somali: 176 (0.2%)
Arab: 175 (0.1%)
Welsh: 174 (0.1%)
Finnish: 173 (0.1%)
Jordanian: 164 (0.1%)
Albanian: 164 (0.1%)
Czech: 162 (0.1%)
Israeli: 156 (0.1%)
Yugoslavian: 154 (0.1%)
South African: 152 (0.1%)
Slovene: 149 (0.1%)
Syrian: 148 (0.1%)
Danish: 135 (0.1%)
Ghanaian: 131 (0.1%)
Austrian: 120 (0.1%)
Swiss: 109 (0.09%)
Lithuanian: 104 (0.09%)
Australian: 89 (0.08%)
Belgian: 72 (0.06%)
Belizean: 65 (0.06%)
Haitian: 58 (0.05%)
Trinidadian and Tobagonian: 54 (0.05%)
Croatian: 50 (0.04%)
Sierra Leonean: 47 (0.04%)
Canadian: 47 (0.04%)
Kenyan: 46 (0.04%)
Assyrian: 43 (0.04%)
Slovak: 42 (0.04%)
Bahamian: 38 (0.03%)
West Indian: 33 (0.03%)
New Zealander: 31 (0.03%)
Senegalese: 31 (0.03%)
Latvian: 30 (0.03%)
Cajun: 25 (0.02%)
Slavic: 17 (0.01%)
Estonian: 16 (0.01%)
Guyanese: 16 (0.01%)
Celtic: 15 (0.01%)
Pennsylvania German: 14 (0.01%)
Carpatho Rusyn: 12 (0.01%)
Czechoslovakian: 11 (0.01%)
Macedonian: 9 (0.01%)
Most common places of birth for foreign-born residents (%): El Salvador Arlington:
9.2% (4,880)Virginia:
9.9% (107,534)
China, excluding Hong Kong and Taiwan Arlington:
6.5% (3,471)Virginia:
3.9% (42,989)
India Arlington:
5.1% (2,735)Virginia:
9.0% (97,830)
Bolivia Arlington:
4.9% (2,609)Virginia:
2.4% (25,722)
Ethiopia Arlington:
4.6% (2,464)Virginia:
2.9% (32,082)
Colombia Arlington:
3.3% (1,737)Virginia:
1.3% (14,435)
Korea Arlington:
3.1% (1,655)Virginia:
4.9% (52,857)
Guatemala Arlington:
2.8% (1,483)Virginia:
3.3% (35,938)
Philippines Arlington:
2.4% (1,261)Virginia:
4.8% (52,629)
Other Eastern Asia Arlington:
2.3% (1,235)Virginia:
0.2% (1,956)
Mexico Arlington:
2.2% (1,149)Virginia:
5.3% (57,498)
Vietnam Arlington:
2.0% (1,074)Virginia:
4.2% (45,750)
Nepal Arlington:
1.9% (1,002)Virginia:
0.9% (9,695)
Peru Arlington:
1.8% (973)Virginia:
2.4% (26,366)
Turkey Arlington:
1.7% (920)Virginia:
0.7% (7,148)
Bangladesh Arlington:
1.7% (913)Virginia:
1.1% (12,049)
Iran Arlington:
1.7% (912)Virginia:
1.3% (14,417)
Japan Arlington:
1.6% (871)Virginia:
0.8% (8,805)
Place of birth for U.S.-born residents:
This state: 47,983Other state: 127,515Northeast: 40,572Midwest: 18,762South: 50,661West: 17,520 78.4% of Arlington residents lived in the same house 1 years ago.
Out of people who lived in different houses, 24.4% lived in this county.
Out of people who lived in different counties, 27.0% lived in Virginia.
Arlington:
78.4%State average:
86.6%
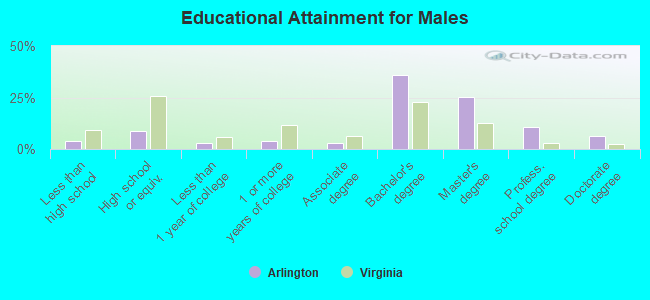
Education attainment for males 25 years and older:
No schooling: 703Nursery to 4th grade: 4175th and 6th grade: 3067th and 8th grade: 1229th grade: 16110th grade: 22511th grade: 22912th grade, no diploma: 1,040High school graduate (or equivalency): 7,479Less than 1 year of college: 2,628Some college more than 1 year, no degree: 3,413Associate degree: 2,402Bachelor's degree: 31,250Master's degree: 22,029Professional school degree: 9,159Doctorate degree: 5,298
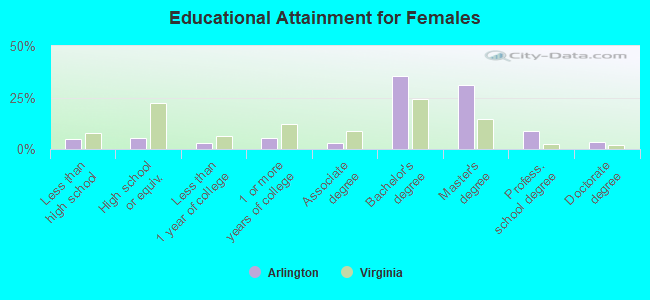
Education attainment for females 25 years and older:
No schooling: 1,372Nursery to 4th grade: 1875th and 6th grade: 5657th and 8th grade: 4539th grade: 12510th grade: 45811th grade: 17712th grade, no diploma: 852High school graduate (or equivalency): 4,666Less than 1 year of college: 2,331Some college more than 1 year, no degree: 4,557Associate degree: 2,688Bachelor's degree: 30,224Master's degree: 26,615Professional school degree: 7,371Doctorate degree: 2,897
Housing units in structures:
One, detached: 31,293One, attached: 11,329Two: 1,6893 or 4: 4,1795 to 9: 8,36910 to 19: 7,17820 to 49: 4,22550 or more: 54,160Mobile homes: 36Housing units lacking complete plumbing facilities in 2022: 0.6%Housing units lacking complete kitchen facilities in 2022: 0.6%House/condo owner moved in on average 10 years ago
Renter moved in on average 0 years ago
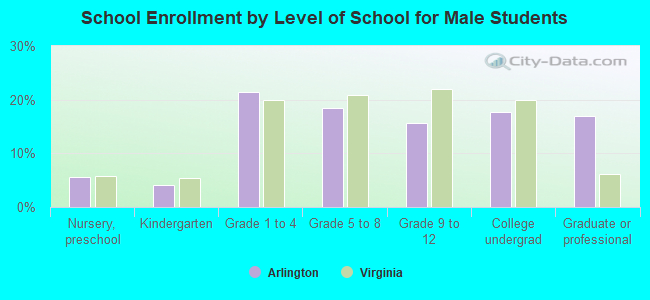
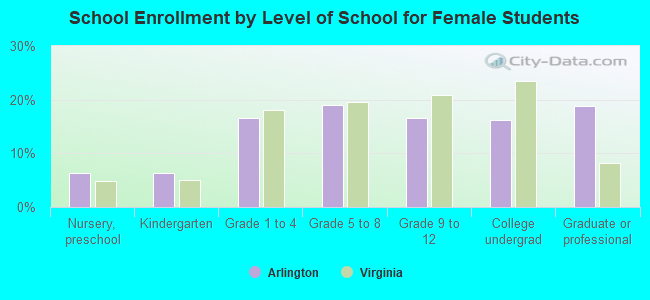
Private vs. public school enrollment:
Students in private schools in grades 1 to 8 (elementary and middle school): 1,650 Students in private schools in grades 9 to 12 (high school): 1,019 Students in private undergraduate colleges: 1,727