Arlington, TX (Texas) Houses and Residents
Estimated median house or condo value in 2022: $285,500 (it was $94,800 in 2000 )
Arlington:
$285,500Texas:
$275,400
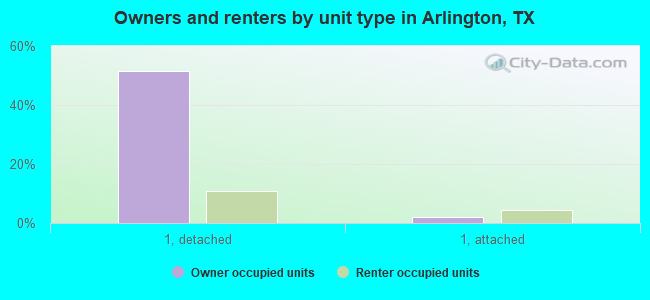
Lower value quartile - upper value quartile: $208,500 - $376,000Mean price in 2022: Detached houses: $318,320 Here:
$318,320State:
$369,058
Townhouses or other attached units: $233,633 Here:
$233,633State:
$327,631
In 2-unit structures: $418,053 Here:
$418,053State:
$374,947
In 3-to-4-unit structures: $55,975 Here:
$55,975State:
$209,652
In 5-or-more-unit structures: $129,776 Here:
$129,776State:
$413,944
Mobile homes: $105,528 Here:
$105,528State:
$124,413
Occupied boats, RVs, vans, etc.: $25,769 Here:
$25,769State:
$73,921
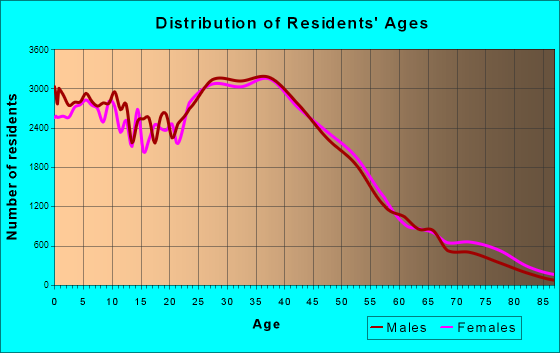
Total population: 383,204 (Urban population: 332,597, Rural population: 98 (15 farm, 83 nonfarm ))
Houses: 150,576 (140,525 occupied: 75,741 owner occupied, 64,784 renter occupied )
% of renters here:
46%State:
38%
Housing density: 1,571 houses/condos per square mile
Median price asked for vacant for-sale houses and condos in 2022: $469,033.
Median contract rent in 2022: $1,162 (lower quartile is $963, upper quartile is $1,453)
Median rent asked for vacant for-rent units in 2022: $1,071
Median gross rent in Arlington, TX in 2022: $1,333
Housing units in Arlington with a mortgage: 46,111 (1,974 second mortgage, 100 home equity loan, 1,510 both second mortgage and home equity loan )Houses without a mortgage: 553
Median household income for houses/condos with a mortgage: $104,699
Median household income for apartments without a mortgage: $83,465
Median monthly housing costs: $1,347
Data:
Median house or condo value ($)
Median house or condo value ($ change since 2000)
Median house or condo value ($) - White
Median house or condo value ($) - Black or African American
Median house or condo value ($) - Asian
Median house or condo value ($) - Hispanic or Latino
Median house or condo value ($) - American Indian and Alaska Native
Median house or condo value ($) - Multirace
Median house or condo value ($) - Other Race
Median price asked for mobile homes ($)
Household density (households per square mile)
Mean house or condo value by units in structure - 1, detached ($)
Mean house or condo value by units in structure - 1, attached ($)
Mean house or condo value by units in structure - 2 ($)
Mean house or condo value by units in structure by units in structure - 3 or 4 ($)
Mean house or condo value by units in structure - 5 or more ($)
Mean house or condo value by units in structure - Boat, RV, van, etc. ($)
Mean house or condo value by units in structure - Mobile home ($)
Median contract rent ($)
Median contract rent - Lower quartile ($)
Median contract rent - Upper quartile ($)
Median gross rent ($)
Urban houses (%)
Rural houses (%)
Houses occupied (%)
Houses occupied (% change since 2000)
Houses owner occupied (%)
Houses owner occupied (% change since 2000)
Houses renter occupied (%)
Houses renter occupied (% change since 2000)
Vacant housing units - For rent (%)
Vacant housing units - For rent (% change since 2000)
Vacant housing units - For sale only (%)
Vacant housing units - For sale only (% change since 2000)
Vacant housing units - Rented or sold, not occupied (%)
Vacant housing units - Rented or sold, not occupied (% change since 2000)
Vacant housing units - For seasonal, recreational, or occasional use (%)
Vacant housing units - For seasonal, recreational, or occasional use (% change since 2000)
Vacant housing units - For migrant workers (%)
Vacant housing units - For migrant workers (% change since 2000)
Vacant housing units - Other vacant (%)
Vacant housing units - Other vacant (% change since 2000)
Median monthly housing costs ($)
Median household income for houses/condos with a mortgage ($)
Median household income for houses/condos without a mortgage ($)
Median household income ($)
Median household income ($) - White
Median household income ($) - Black or African American
Median household income ($) - Asian
Median household income ($) - Hispanic or Latino
Median household income ($) - American Indian and Alaska Native
Median household income ($) - Multirace
Median household income ($) - Other Race
Mortgage status - with mortgage (%)
Mortgage status - with second mortgage (%)
Mortgage status - with home equity loan (%)
Mortgage status - with both second mortgage and home equity loan (%)
Mortgage status - without a mortgage (%)
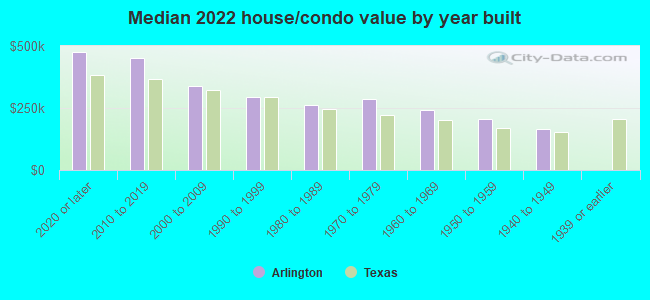
Median year house/condo built
Median year apartment built
Household type by relationship - Male householder living alone (%)
Household type by relationship - Male householder not living alone (%)
Household type by relationship - Female householder living alone (%)
Household type by relationship - Female householder not living alone (%)
Household type by relationship - Opposite-Sex spouse (%)
Household type by relationship - Same-Sex spouse (%)
Household type by relationship - Opposite-Sex unmarried partner (%)
Household type by relationship - Same-Sex unmarried partner (%)
Household type by relationship - In group quarters (%)
Size of family households - 2-person household (%)
Size of family households - 3-person household (%)
Size of family households - 4-person household (%)
Size of family households - 5-person household (%)
Size of family households - 6-person household (%)
Size of family households - 7-or-more-person household (%)
Size of nonfamily households - 1-person household (%)
Size of nonfamily households - 2-person household (%)
Size of nonfamily households - 3-person household (%)
Size of nonfamily households - 4-person household (%)
Size of nonfamily households - 5-person household (%)
Size of nonfamily households - 6-person household (%)
Size of nonfamily households - 7-or-moreperson household (%)
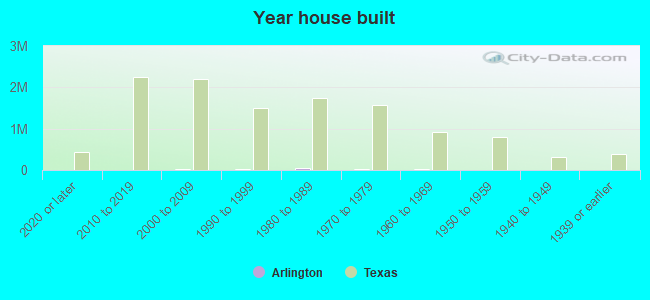
Year house built - Built 2010 or later (%)
Year house built - Built 2000 to 2009 (%)
Year house built - Built 1990 to 1999 (%)
Year house built - Built 1980 to 1989 (%)
Year house built - Built 1970 to 1979 (%)
Year house built - Built 1960 to 1969 (%)
Year house built - Built 1950 to 1959 (%)
Year house built - Built 1940 to 1949 (%)
Year house built - Built 1939 or earlier (%)
Median number of rooms in houses and condos
Median number of rooms in apartments
Median number of bedrooms in owner occupied houses
Mean number of bedrooms in owner occupied houses
Median number of bedrooms in renter occupied houses
Mean number of bedrooms in renter occupied houses
Median number of vehichles in owner occupied houses
Mean number of vehichles in owner occupied houses
Median number of vehichles in renter occupied houses
Mean number of vehichles in renter occupied houses
Rooms in owner-occupied houses - 1 room (%)
Rooms in owner-occupied houses - 2 rooms (%)
Rooms in owner-occupied houses - 3 rooms (%)
Rooms in owner-occupied houses - 4 rooms (%)
Rooms in owner-occupied houses - 5 rooms (%)
Rooms in owner-occupied houses - 6 rooms (%)
Rooms in owner-occupied houses - 7 rooms (%)
Rooms in owner-occupied houses - 8 rooms (%)
Rooms in owner-occupied houses - 9+ rooms (%)
Rooms in renter-occupied houses - 1 room (%)
Rooms in renter-occupied houses - 2 rooms (%)
Rooms in renter-occupied houses - 3 rooms (%)
Rooms in renter-occupied houses - 4 rooms (%)
Rooms in renter-occupied houses - 5 rooms (%)
Rooms in renter-occupied houses - 6 rooms (%)
Rooms in renter-occupied houses - 7 rooms (%)
Rooms in renter-occupied houses - 8 rooms (%)
Rooms in renter-occupied houses - 9+ rooms (%)
Bedrooms in owner-occupied houses - no bedrooms (%)
Bedrooms in owner-occupied houses - 1 bedroom (%)
Bedrooms in owner-occupied houses - 2 bedrooms (%)
Bedrooms in owner-occupied houses - 3 bedrooms (%)
Bedrooms in owner-occupied houses - 4 bedrooms (%)
Bedrooms in owner-occupied houses - 5+ bedrooms (%)
Bedrooms in renter-occupied houses - no bedrooms (%)
Bedrooms in renter-occupied houses - 1 bedroom (%)
Bedrooms in renter-occupied houses - 2 bedrooms (%)
Bedrooms in renter-occupied houses - 3 bedrooms (%)
Bedrooms in renter-occupied houses - 4 bedrooms (%)
Bedrooms in renter-occupied houses - 5+ bedrooms (%)
Vehicles available in owner-occupied houses - no vehicle available (%)
Vehicles available in owner-occupied houses - 1 vehicle available(%)
Vehicles available in owner-occupied houses - 2 Vehicles available (%)
Vehicles available in owner-occupied houses - 3 Vehicles available (%)
Vehicles available in owner-occupied houses - 4 Vehicles available (%)
Vehicles available in owner-occupied houses - 5+ Vehicles available (%)
Vehicles available in renter-occupied houses - no vehicle available (%)
Vehicles available in renter-occupied houses - 1 vehicle available (%)
Vehicles available in renter-occupied houses - 2 Vehicles available (%)
Vehicles available in renter-occupied houses - 3 Vehicles available (%)
Vehicles available in renter-occupied houses - 4 Vehicles available (%)
Vehicles available in renter-occupied houses - 5+ Vehicles available (%)
Housing units in structures - 1, detached (%)
Housing units in structures - 1, attached (%)
Housing units in structures - 2 (%)
Housing units in structures - 3 or 4 (%)
Housing units in structures - 5 to 9 (%)
Housing units in structures - 10 to 19 (%)
Housing units in structures - 20 to 49 (%)
Housing units in structures - 50 or more (%)
Housing units in structures - Mobile home (%)
Housing units in structures - Boat, RV, van, etc. (%)
Housing units in structures - Owners - 1, detached (%)
Housing units in structures - Owners - 1, attached (%)
Housing units in structures - Owners - 2 (%)
Housing units in structures - Owners - 3 or 4 (%)
Housing units in structures - Owners - 5 to 9 (%)
Housing units in structures - Owners - 10 to 19 (%)
Housing units in structures - Owners - 20 to 49 (%)
Housing units in structures - Owners - 50 or more (%)
Housing units in structures - Owners - Mobile home (%)
Housing units in structures - Owners - Boat, RV, van, etc. (%)
Housing units in structures - Renters - 1, detached (%)
Housing units in structures - Renters - 1, attached (%)
Housing units in structures - Renters - 2 (%)
Housing units in structures - Renters - 3 or 4 (%)
Housing units in structures - Renters - 5 to 9 (%)
Housing units in structures - Renters - 10 to 19 (%)
Housing units in structures - Renters - 20 to 49 (%)
Housing units in structures - Renters - 50 or more (%)
Housing units in structures - Renters - Mobile home (%)
Housing units in structures - Renters - Boat, RV, van, etc. (%)
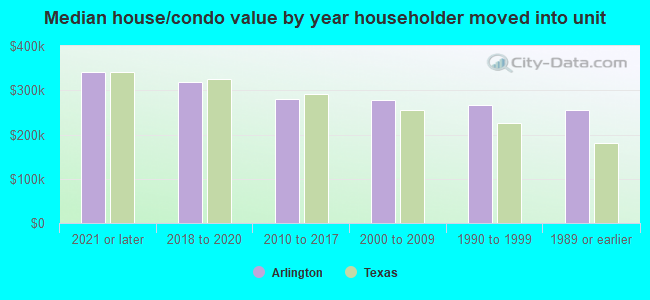
House/condo owner moved in on average (years ago)
Renter moved in on average (years ago)
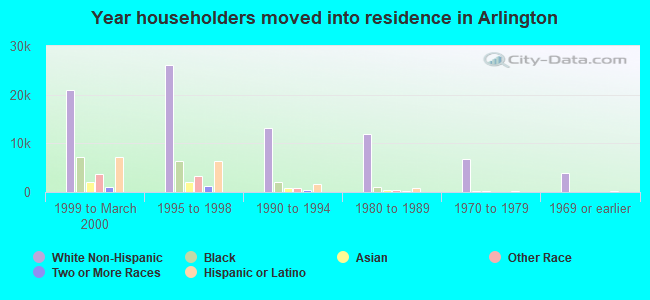
Year householder moved into unit - Moved in 1999 to March 2000 (%)
Year householder moved into unit - Moved in 1999 to March 2000 (%) - White
Year householder moved into unit - Moved in 1999 to March 2000 (%) - Black or African American
Year householder moved into unit - Moved in 1999 to March 2000 (%) - Asian
Year householder moved into unit - Moved in 1999 to March 2000 (%) - Hispanic or Latino
Year householder moved into unit - Moved in 1999 to March 2000 (%) - American Indian and Alaska Native
Year householder moved into unit - Moved in 1999 to March 2000 (%) - Multirace
Year householder moved into unit - Moved in 1999 to March 2000 (%) - Other Race
Year householder moved into unit - Moved in 1995 to 1998 (%)
Year householder moved into unit - Moved in 1995 to 1998 (%) - White
Year householder moved into unit - Moved in 1995 to 1998 (%) - Black or African American
Year householder moved into unit - Moved in 1995 to 1998 (%) - Asian
Year householder moved into unit - Moved in 1995 to 1998 (%) - Hispanic or Latino
Year householder moved into unit - Moved in 1995 to 1998 (%) - American Indian and Alaska Native
Year householder moved into unit - Moved in 1995 to 1998 (%) - Multirace
Year householder moved into unit - Moved in 1995 to 1998 (%) - Other Race
Year householder moved into unit - Moved in 1990 to 1994 (%)
Year householder moved into unit - Moved in 1990 to 1994 (%) - White
Year householder moved into unit - Moved in 1990 to 1994 (%) - Black or African American
Year householder moved into unit - Moved in 1990 to 1994 (%) - Asian
Year householder moved into unit - Moved in 1990 to 1994 (%) - Hispanic or Latino
Year householder moved into unit - Moved in 1990 to 1994 (%) - American Indian and Alaska Native
Year householder moved into unit - Moved in 1990 to 1994 (%) - Multirace
Year householder moved into unit - Moved in 1990 to 1994 (%) - Other Race
Year householder moved into unit - Moved in 1980 to 1989 (%)
Year householder moved into unit - Moved in 1980 to 1989 (%) - White
Year householder moved into unit - Moved in 1980 to 1989 (%) - Black or African American
Year householder moved into unit - Moved in 1980 to 1989 (%) - Asian
Year householder moved into unit - Moved in 1980 to 1989 (%) - Hispanic or Latino
Year householder moved into unit - Moved in 1980 to 1989 (%) - American Indian and Alaska Native
Year householder moved into unit - Moved in 1980 to 1989 (%) - Multirace
Year householder moved into unit - Moved in 1980 to 1989 (%) - Other Race
Year householder moved into unit - Moved in 1970 to 1979 (%)
Year householder moved into unit - Moved in 1970 to 1979 (%) - White
Year householder moved into unit - Moved in 1970 to 1979 (%) - Black or African American
Year householder moved into unit - Moved in 1970 to 1979 (%) - Asian
Year householder moved into unit - Moved in 1970 to 1979 (%) - Hispanic or Latino
Year householder moved into unit - Moved in 1970 to 1979 (%) - American Indian and Alaska Native
Year householder moved into unit - Moved in 1970 to 1979 (%) - Multirace
Year householder moved into unit - Moved in 1970 to 1979 (%) - Other Race
Year householder moved into unit - Moved in 1969 or earlier (%)
Year householder moved into unit - Moved in 1969 or earlier (%) - White
Year householder moved into unit - Moved in 1969 or earlier (%) - Black or African American
Year householder moved into unit - Moved in 1969 or earlier (%) - Asian
Year householder moved into unit - Moved in 1969 or earlier (%) - Hispanic or Latino
Year householder moved into unit - Moved in 1969 or earlier (%) - American Indian and Alaska Native
Year householder moved into unit - Moved in 1969 or earlier (%) - Multirace
Year householder moved into unit - Moved in 1969 or earlier (%) - Other Race
Housing units lacking complete plumbing facilities (%)
Housing units lacking complete kitchen facilities (%)
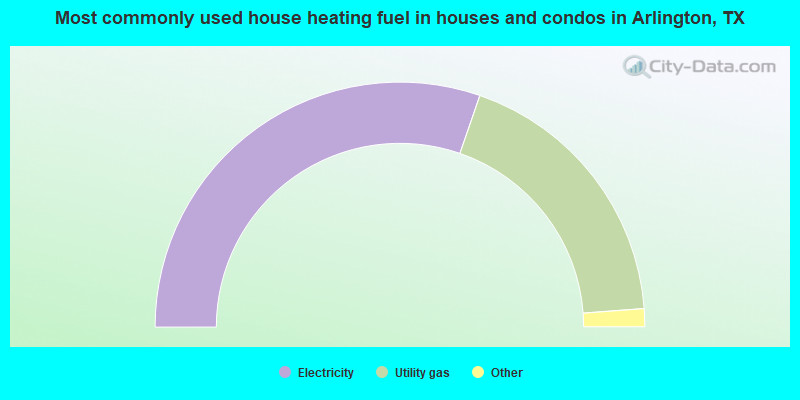
House heating fuel used in houses and condos - Utility gas (%)
House heating fuel used in houses and condos - Bottled, tank, or LP gas (%)
House heating fuel used in houses and condos - Electricity (%)
House heating fuel used in houses and condos - Fuel oil, kerosene, etc. (%)
House heating fuel used in houses and condos - Coal or coke (%)
House heating fuel used in houses and condos - Wood (%)
House heating fuel used in houses and condos - Solar energy (%)
House heating fuel used in houses and condos - Other fuel (%)
House heating fuel used in houses and condos - No fuel used (%)
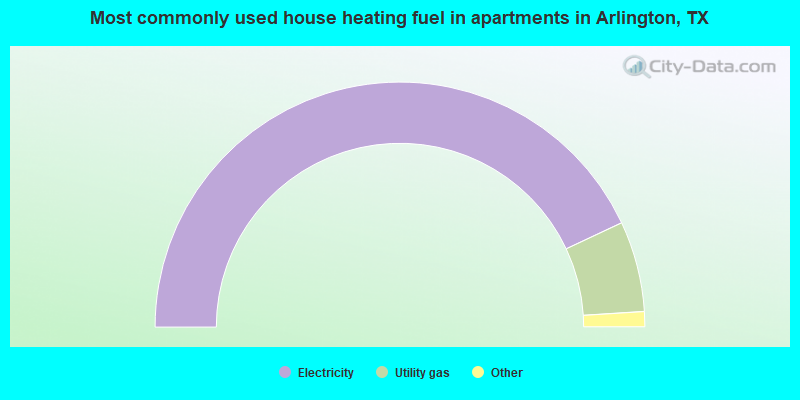
House heating fuel used in apartments - Utility gas (%)
House heating fuel used in apartments - Bottled, tank, or LP gas (%)
House heating fuel used in apartments - Electricity (%)
House heating fuel used in apartments - Fuel oil, kerosene, etc. (%)
House heating fuel used in apartments - Coal or coke (%)
House heating fuel used in apartments - Wood (%)
House heating fuel used in apartments - Solar energy (%)
House heating fuel used in apartments - Other fuel (%)
House heating fuel used in apartments - No fuel used (%)
Latest news about housing in Arlington, TX collected exclusively by city-data.com from local newspapers, TV, and radio stations
Median year house/condo built: 1985Median year apartment built: 1986Household type by relationship:
Households: 394,573
Male householders: 72,077 (18,139 living alone ), Female householders: 68,448 (21,541 living alone )61,795 spouses (61,418 opposite-sex spouses ), 11,460 unmarried partners , (11,211 opposite-sex unmarried partners ), 129,161 children (123,184 natural , 1,546 adopted , 4,431 stepchildren ), 12,264 grandchildren , 4,566 brothers or sisters , 5,806 parents , 133 foster children , 9,369 other relatives , 11,493 non-relatives In group quarters: 8,001
Size of family households: 31,576 2-persons , 23,644 3-persons , 17,245 4-persons , 10,083 5-persons , 4,662 6-persons , 3,054 7-or-more-persons .
Size of nonfamily households: 39,680 1-person , 8,796 2-persons , 884 3-persons , 749 4-persons , 152 5-persons .
54,613 married couples with children. single-parent households (9,398 men , 20,045 women ).
63.3% of residents of Arlington speak English at home. of residents speak Spanish at home (60% speak English very well , 20% speak English well , 15% speak English not well , 5% don't speak English at all ).of residents speak other Indo-European language at home (75% speak English very well , 21% speak English well , 4% speak English not well , 1% don't speak English at all ).of residents speak Asian or Pacific Island language at home (45% speak English very well , 27% speak English well , 21% speak English not well , 7% don't speak English at all ).of residents speak other language at home (89% speak English very well , 9% speak English well , 1% speak English not well ).
Foreign born population: 84,151 (21.3%)of them are naturalized citizens )
Median number of rooms in houses and condos:
Median number of rooms in apartments
Owner-occupied Renter-occupied
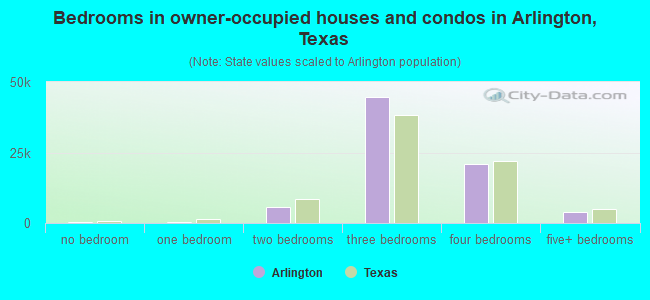
Bedrooms in owner-occupied houses and condos in Arlington, Texas
231 no bedroom 451 1 bedroom 5,629 2 bedrooms 44,769 3 bedrooms 20,932 4 bedrooms 3,729 5+ bedrooms
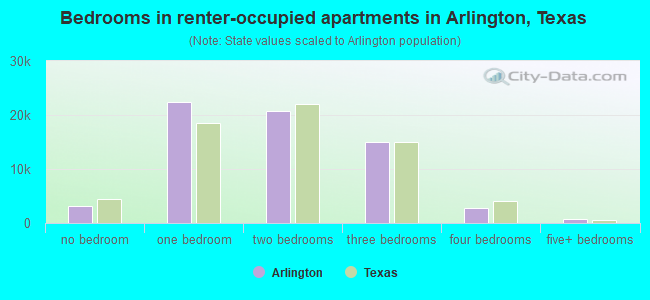
Bedrooms in renter-occupied apartments in Arlington, Texas
3,109 no bedroom 22,355 1 bedroom 20,774 2 bedrooms 15,046 3 bedrooms 2,708 4 bedrooms 792 5+ bedrooms
Owner-occupied Renter-occupied
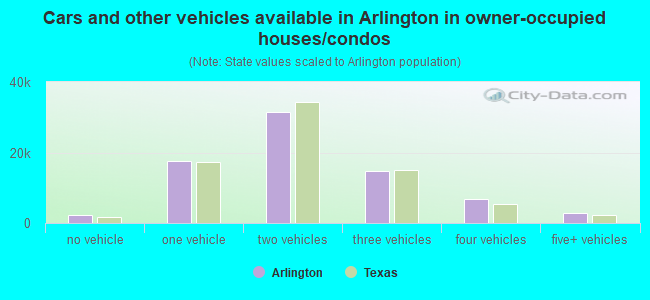
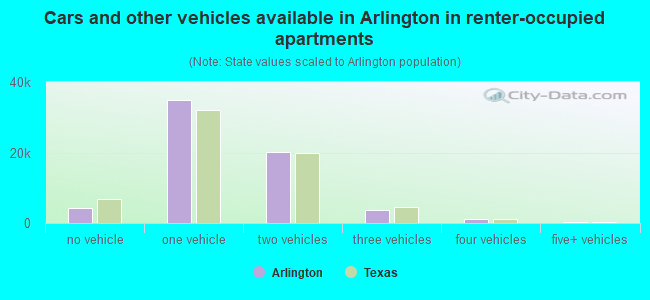
Cars and other vehicles available in Arlington in owner-occupied houses/condos
2,201 no vehicle 17,707 1 vehicle 31,377 2 vehicles 14,799 3 vehicles 6,694 4 vehicles 2,963 5+ vehicles
Cars and other vehicles available in Arlington in renter-occupied apartments
4,368 no vehicle 34,951 1 vehicle 20,198 2 vehicles 3,705 3 vehicles 1,178 4 vehicles 384 5+ vehicles
Owner-occupied Renter-occupied
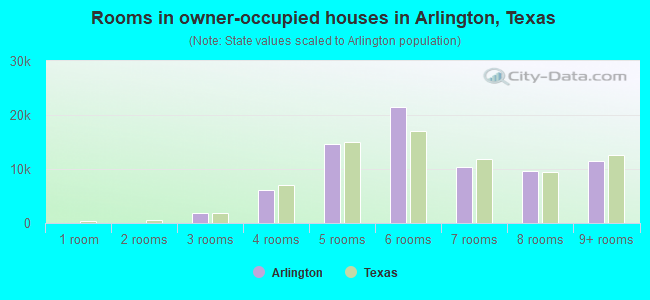
Rooms in owner-occupied houses in Arlington, Texas
70 1 room 58 2 rooms 1,773 3 rooms 6,196 4 rooms 14,558 5 rooms 21,560 6 rooms 10,357 7 rooms 9,680 8 rooms 11,489 9+ rooms
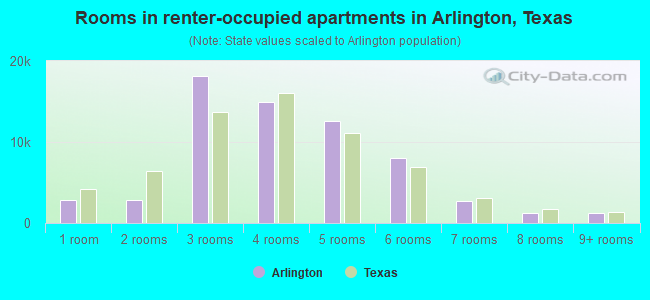
Rooms in renter-occupied apartments in Arlington, Texas
2,873 1 room 2,879 2 rooms 18,203 3 rooms 14,966 4 rooms 12,601 5 rooms 8,012 6 rooms 2,713 7 rooms 1,272 8 rooms 1,265 9+ rooms
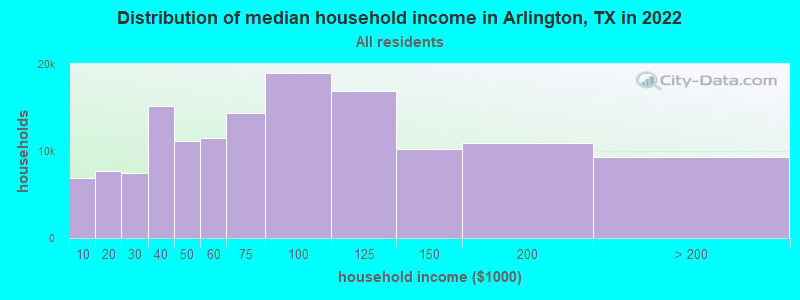
Arlington, TX household income distribution 6,926 Less than $10,0007,708 $10,000 to $19,9997,476 $20,000 to $29,99915,153 $30,000 to $39,99911,102 $40,000 to $49,99911,542 $50,000 to $59,99914,315 $60,000 to $74,99918,969 $75,000 to $99,99916,886 $100,000 to $124,99910,225 $125,000 to $149,99910,940 $150,000 to $199,9999,283 $200,000 or more
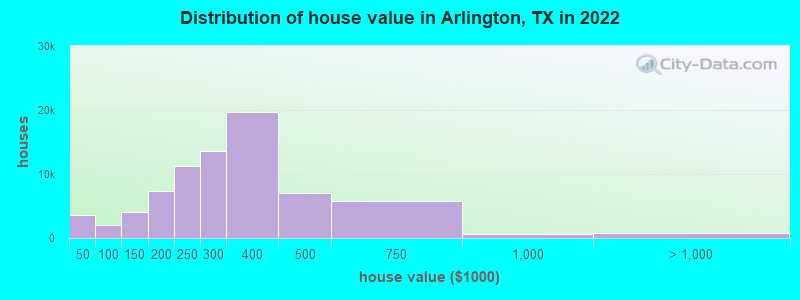
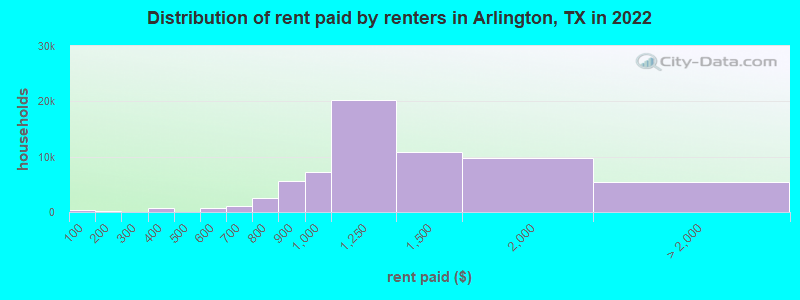
Home value of owner - occupied houses in 2022 in Arlington, TX 1,564 Less than $10,000117 $10,000 to $14,999179 $15,000 to $19,999382 $20,000 to $24,999700 $25,000 to $29,999232 $30,000 to $34,999337 $35,000 to $39,99948 $40,000 to $49,999405 $50,000 to $59,999388 $60,000 to $69,99998 $70,000 to $79,999378 $80,000 to $89,999739 $90,000 to $99,9991,850 $100,000 to $124,9992,173 $125,000 to $149,9992,011 $150,000 to $174,9995,409 $175,000 to $199,99911,260 $200,000 to $249,99913,532 $250,000 to $299,99919,741 $300,000 to $399,9997,019 $400,000 to $499,9995,783 $500,000 to $749,999669 $750,000 to $999,999192 $1,000,000 to $1,499,999217 $1,500,000 to $1,999,999318 $2,000,000 or moreRent paid by renters in 2022 in Arlington, TX 273 Less than $100238 $150 to $19945 $200 to $249369 $300 to $349271 $350 to $39985 $400 to $449309 $500 to $549419 $550 to $599545 $600 to $649460 $650 to $6991,551 $700 to $7491,016 $750 to $7995,650 $800 to $8997,296 $900 to $99920,239 $1,000 to $1,24910,762 $1,250 to $1,4999,788 $1,500 to $1,9993,517 $2,000 to $2,499310 $2,500 to $2,999219 $3,000 to $3,4991,422 No cash rent
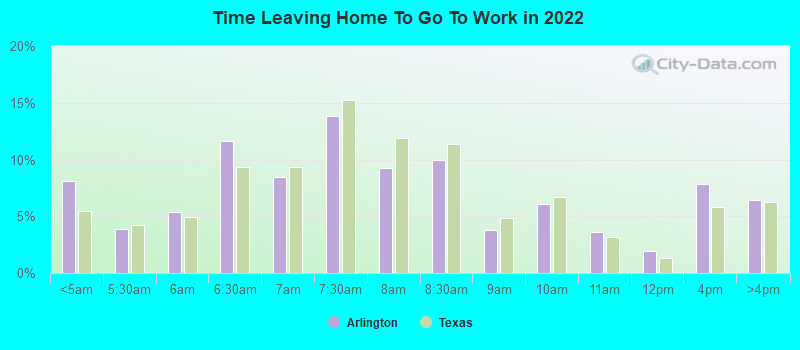
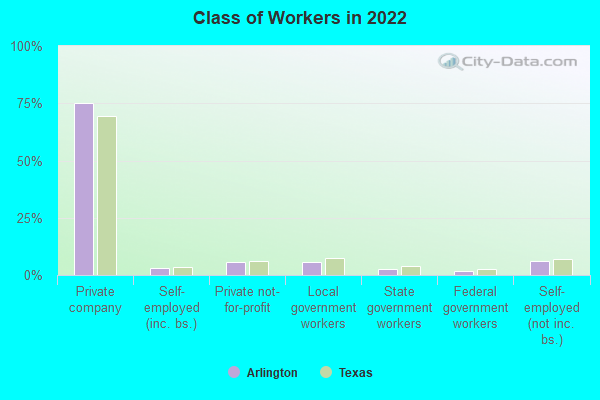
Percentage of workers working in this county: 75.1%Number of people working at home: 31,948 (15.5% of all workers )
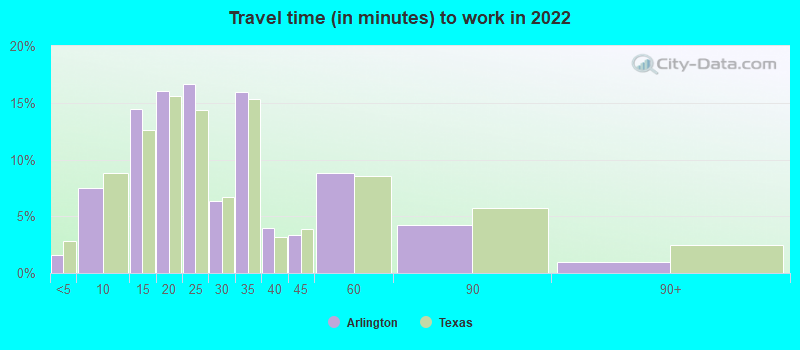
Travel time to work (commute)
Less than 5 minutes: 2,6785 to 9 minutes: 11,99910 to 14 minutes: 20,96215 to 19 minutes: 26,28520 to 24 minutes: 26,46525 to 29 minutes: 13,94530 to 34 minutes: 30,07135 to 39 minutes: 7,23840 to 44 minutes: 6,63145 to 59 minutes: 15,16360 to 89 minutes: 10,66090 or more minutes: 2,166
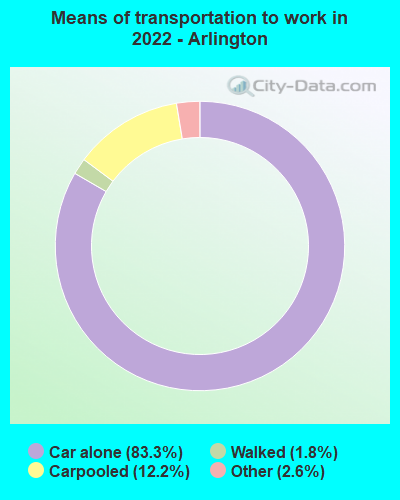
Means of transportation to work:
Drove a car alone: 120,716 (68.2%)Carpooled: 17,757 (10.0%)Taxi: 3,748 (2.1%)Bicycle: 90 (0.1%)Walked: 2,661 (1.5%)Worked at home: 31,948 (18.1%)
Unemployment by race in 2022
Unemployment rate for White non-Hispanic residents 4.4% Males3.7% FemalesUnemployment rate for Black residents 11.0% Males4.8% FemalesUnemployment rate for American Indian and Alaska Native residents 5.9% Males0.8% FemalesUnemployment rate for Asian residents 4.2% Males1.7% FemalesUnemployment rate for other race residents 6.7% Males2.8% FemalesUnemployment rate for two or more race residents 0.9% Males3.3% FemalesUnemployment rate for Hispanic or Latino residents 0.8% Males4.1% Females
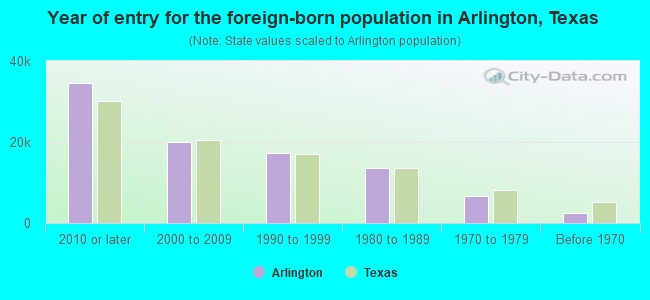
Year of entry for the foreign-born population in Arlington, Texas
34,445 2010 or later 20,059 2000 to 2009 17,259 1990 to 1999 13,502 1980 to 1989 6,638 1970 to 1979 2,567 Before 1970
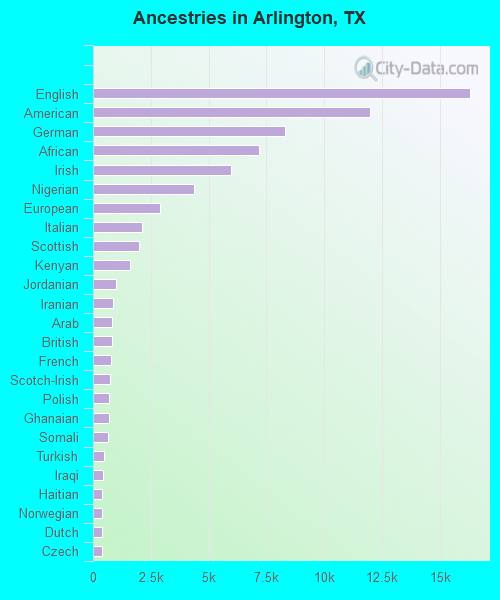
First ancestries reported:
English: 16,313 (6.6%)
American: 11,975 (4.8%)
German: 8,298 (3.3%)
African: 7,167 (2.9%)
Irish: 5,986 (2.4%)
Nigerian: 4,380 (1.8%)
European: 2,905 (1.2%)
Italian: 2,117 (0.9%)
Scottish: 1,996 (0.8%)
Kenyan: 1,592 (0.6%)
Jordanian: 1,010 (0.4%)
Iranian: 879 (0.4%)
Arab: 830 (0.3%)
British: 819 (0.3%)
French: 776 (0.3%)
Scotch-Irish: 729 (0.3%)
Polish: 695 (0.3%)
Ghanaian: 679 (0.3%)
Somali: 642 (0.3%)
Turkish: 477 (0.2%)
Iraqi: 440 (0.2%)
Haitian: 404 (0.2%)
Norwegian: 380 (0.2%)
Dutch: 375 (0.2%)
Czech: 373 (0.2%)
Jamaican: 367 (0.1%)
Liberian: 354 (0.1%)
Cajun: 328 (0.1%)
Sudanese: 312 (0.1%)
Northern European: 310 (0.1%)
Swedish: 308 (0.1%)
Portuguese: 282 (0.1%)
Ukrainian: 271 (0.1%)
Eastern European: 251 (0.1%)
Lebanese: 236 (0.10%)
Ugandan: 229 (0.09%)
Russian: 224 (0.09%)
Moroccan: 208 (0.08%)
West Indian: 206 (0.08%)
Palestinian: 205 (0.08%)
French Canadian: 194 (0.08%)
Welsh: 155 (0.06%)
Brazilian: 149 (0.06%)
Greek: 140 (0.06%)
Afghan: 133 (0.05%)
Trinidadian and Tobagonian: 129 (0.05%)
Ethiopian: 125 (0.05%)
Syrian: 121 (0.05%)
Scandinavian: 108 (0.04%)
Belizean: 84 (0.03%)
Canadian: 82 (0.03%)
Basque: 78 (0.03%)
Hungarian: 65 (0.03%)
Slavic: 64 (0.03%)
Austrian: 62 (0.03%)
British West Indian: 60 (0.02%)
Macedonian: 60 (0.02%)
Estonian: 59 (0.02%)
Egyptian: 54 (0.02%)
Danish: 52 (0.02%)
Slovak: 49 (0.02%)
Senegalese: 43 (0.02%)
Bulgarian: 35 (0.01%)
Romanian: 33 (0.01%)
Swiss: 33 (0.01%)
Czechoslovakian: 31 (0.01%)
Belgian: 30 (0.01%)
Cypriot: 29 (0.01%)
Lithuanian: 27 (0.01%)
Albanian: 23 (0.01%)
Serbian: 22 (0.01%)
Slovene: 15 (0.01%)
Zimbabwean: 14 (0.01%)
Finnish: 13 (0.01%)
Most common places of birth for foreign-born residents (%): Mexico Arlington:
34.0% (28,851)Texas:
48.4% (2,411,723)
Vietnam Arlington:
12.1% (10,304)Texas:
3.7% (184,770)
El Salvador Arlington:
5.2% (4,404)Texas:
4.5% (224,455)
Nigeria Arlington:
4.4% (3,749)Texas:
1.9% (96,110)
India Arlington:
3.0% (2,514)Texas:
6.1% (306,347)
Honduras Arlington:
2.9% (2,455)Texas:
3.0% (147,182)
Kenya Arlington:
2.4% (2,043)Texas:
0.4% (20,458)
Ghana Arlington:
2.3% (1,932)Texas:
0.3% (12,580)
Philippines Arlington:
1.7% (1,449)Texas:
2.1% (103,148)
Cuba Arlington:
1.6% (1,380)Texas:
1.3% (62,978)
Guatemala Arlington:
1.6% (1,365)Texas:
1.8% (87,382)
Place of birth for U.S.-born residents:
This state: 200,658Other state: 102,099Northeast: 12,180Midwest: 26,417South: 39,504West: 23,998 85.8% of Arlington residents lived in the same house 1 years ago.
Out of people who lived in different houses, 38.6% lived in this county.
Out of people who lived in different counties, 55.8% lived in Texas.
Arlington:
85.8%State average:
85.7%
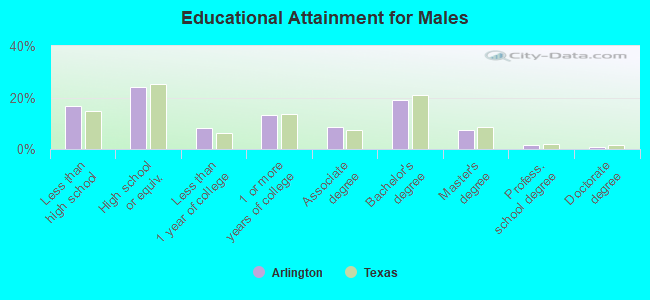
Education attainment for males 25 years and older:
No schooling: 3,219Nursery to 4th grade: 1,4885th and 6th grade: 2,4107th and 8th grade: 2,9819th grade: 3,27110th grade: 89411th grade: 1,82912th grade, no diploma: 3,825High school graduate (or equivalency): 28,865Less than 1 year of college: 9,733Some college more than 1 year, no degree: 15,910Associate degree: 10,302Bachelor's degree: 22,988Master's degree: 9,003Professional school degree: 1,880Doctorate degree: 1,035
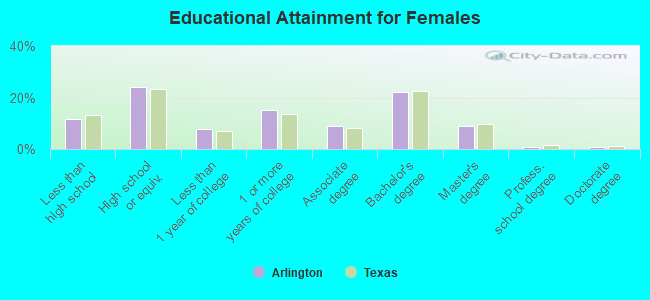
Education attainment for females 25 years and older:
No schooling: 2,952Nursery to 4th grade: 6415th and 6th grade: 2,5967th and 8th grade: 1,0689th grade: 2,30510th grade: 1,26311th grade: 79212th grade, no diploma: 2,805High school graduate (or equivalency): 29,948Less than 1 year of college: 9,787Some college more than 1 year, no degree: 18,949Associate degree: 10,947Bachelor's degree: 27,727Master's degree: 11,367Professional school degree: 748Doctorate degree: 1,139
Housing units in structures:
One, detached: 90,225One, attached: 11,544Two: 2,5893 or 4: 7,1145 to 9: 9,12410 to 19: 13,49320 to 49: 6,69250 or more: 7,292Mobile homes: 2,291Boats, RVs, vans, etc.: 212Median worth of mobile homes: $61,100
Housing units lacking complete plumbing facilities in 2022: 0.2%Housing units lacking complete kitchen facilities in 2022: 1.4%House/condo owner moved in on average 12 years ago
Renter moved in on average 2 years ago
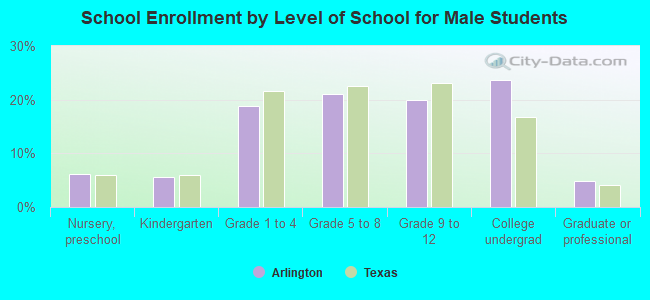
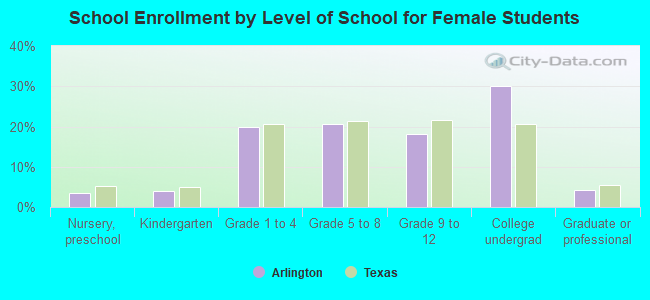
Private vs. public school enrollment:
Students in private schools in grades 1 to 8 (elementary and middle school): 3,931 Students in private schools in grades 9 to 12 (high school): 577 Students in private undergraduate colleges: 4,166