Arlington, TN (Tennessee) Houses and Residents
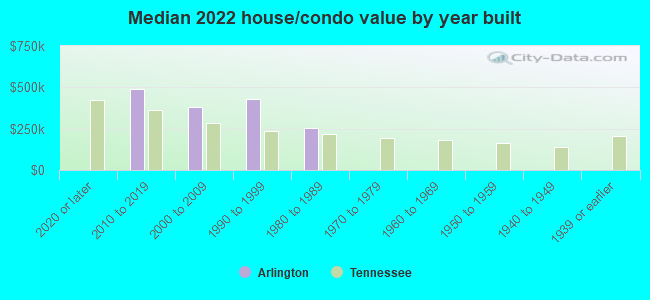
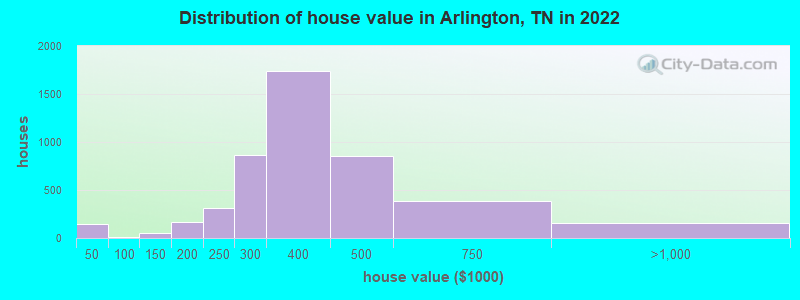
| Arlington: | $412,567 |
| Tennessee: | $284,800 |
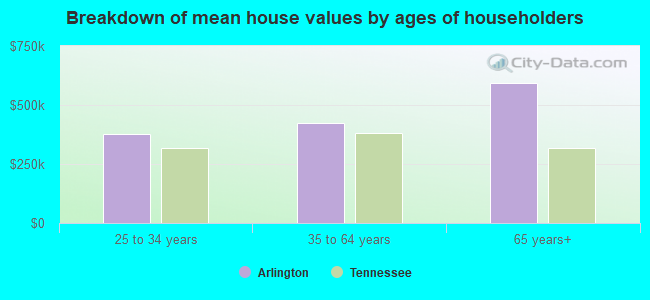
Mean price in 2022:
Detached houses: $393,857
Here: $393,857 State: $374,382
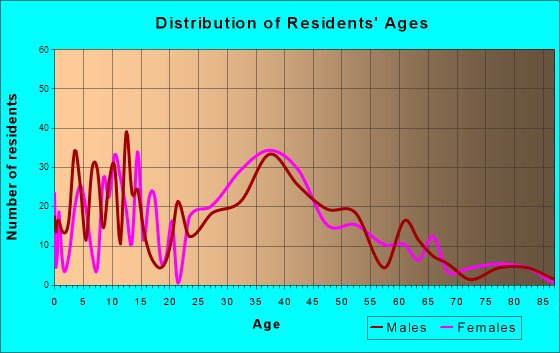
Total population: 11,634 (Urban population: 0, Rural population: 2,657 (all nonfarm))
Houses: 4,659 (4,532 occupied: 3,938 owner occupied, 636 renter occupied)
| % of renters here: | 14% |
| State: | 33% |
Housing density: 228 houses/condos per square mile
Median price asked for vacant for-sale houses and condos in 2022: $247,846.
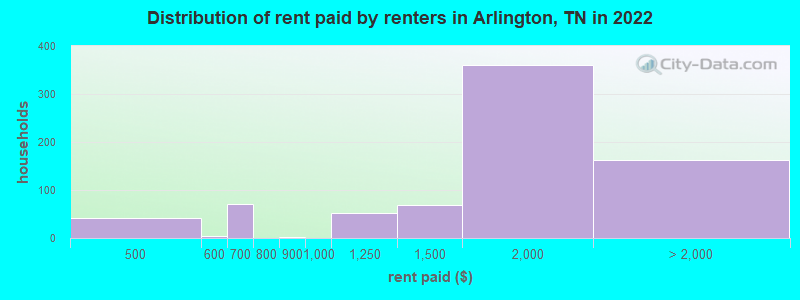
Median contract rent in 2022: $1,637 (lower quartile is $1,154, upper quartile is $1,924)
Median rent asked for vacant for-rent units in 2022: $469
Median gross rent in Arlington, TN in 2022: $1,784
Housing units in Arlington with a mortgage: 3,150 (127 second mortgage, 6 home equity loan, 72 both second mortgage and home equity loan)
Houses without a mortgage: 0
Median household income for houses/condos with a mortgage: $133,706
Median household income for apartments without a mortgage: $113,451
Median monthly housing costs: $1,901
Compare current foreclosures in Arlington, TN:
| Photo | Address | Area | Beds / Baths | Price | Details |
|---|---|---|---|---|---|

|
#1
Shadowlawn Rd
Arlington, TN 38002
|
2,785 sq. feet
|
2 baths 4 beds |
show details | |

|
#2
Old Brownsville Rd
Arlington, TN 38002
|
2,236 sq. feet
|
2 baths 4 beds |
show details | |

|
#3
Craven Rd
Arlington, TN 38002
|
2,650 sq. feet
|
2 baths 3 beds |
show details | |

|
#4
Harrell Dr
Arlington, TN 38002
|
1,425 sq. feet
|
1 baths 3 beds |
show details | |

|
#5
Chi Chi Cv
Arlington, TN 38002
|
1,195 sq. feet
|
2 baths 3 beds |
show details | |

|
#6
Shadowlawn Rd
Arlington, TN 38002
|
1,572 sq. feet
|
1 baths 5 beds |
show details | |

|
#7
Valley Green Ln
Arlington, TN 38002
|
1,901 sq. feet
|
2 baths 3 beds |
show details | |

|
#8
Old Brownsville Rd
Arlington, TN 38002
|
1,522 sq. feet
|
2 baths 3 beds |
show details | |

|
#9
Clubview Cv N
Arlington, TN 38002
|
1,386 sq. feet
|
2 baths 3 beds |
show details | |

|
#10
Orville Cv
Arlington, TN 38002
|
1,392 sq. feet
|
2 baths 3 beds |
show details |
| Photo | Address | Area | Beds / Baths | Price | Details |
|---|---|---|---|---|---|

|
#11
Stansbury Ln
Arlington, TN 38002
|
3,628 sq. feet
|
3 baths 5 beds |
show details | |

|
#12
Shira Dr
Arlington, TN 38002
|
2,982 sq. feet
|
4 baths 4 beds |
show details | |

|
#13
Memphis Arlington Rd
Arlington, TN 38002
|
1,984 sq. feet
|
2 baths 3 beds |
show details | |

|
#14
Seed Tick Rd
Arlington, TN 38002
|
1,388 sq. feet
|
1 baths 3 beds |
show details | |

|
#15
Footbridge Cv
Arlington, TN 38002
|
2,326 sq. feet
|
2 baths 3 beds |
show details | |

|
#16
Chi Chi Ln
Arlington, TN 38002
|
1,279 sq. feet
|
2 baths 3 beds |
show details | |

|
#17
Sawyer Lake Dr
Arlington, TN 38002
|
2,284 sq. feet
|
3 baths 4 beds |
show details | |

|
#18
Stewart Rd
Arlington, TN 38002
|
2,857 sq. feet
|
2 baths 3 beds |
show details | |

|
#19
Lillian Bend Dr
Arlington, TN 38002
|
1,336 sq. feet
|
2 baths 3 beds |
show details | |

|
#20
Will Fall Rd
Arlington, TN 38002
|
2,127 sq. feet
|
2 baths 3 beds |
show details |
| Photo | Address | Area | Beds / Baths | Price | Details |
|---|---|---|---|---|---|

|
#21
Alabaster Cv
Arlington, TN 38002
|
3,447 sq. feet
|
3 baths 4 beds |
show details | |

|
#22
Snickers Dr
Arlington, TN 38002
|
2,366 sq. feet
|
3 baths 4 beds |
show details | |

|
#23
Beagle Run Ln
Arlington, TN 38002
|
2,819 sq. feet
|
2 baths 4 beds |
show details | |

|
#24
White Spruce Dr
Arlington, TN 38002
|
2,871 sq. feet
|
3 baths 4 beds |
show details | |

|
#25
Chester St
Arlington, TN 38002
|
1,901 sq. feet
|
2 baths 3 beds |
show details | |

|
#26
Shetland Trl # Trial
Arlington, TN 38002
|
2,382 sq. feet
|
2 baths 4 beds |
show details | |

|
#27
Bluebridge Ln
Arlington, TN 38002
|
2,465 sq. feet
|
2 baths 3 beds |
show details | |

|
#28
Bernadette Cv
Arlington, TN 38002
|
2,872 sq. feet
|
4 baths 4 beds |
show details | |

|
#29
Brandon Way Ln
Arlington, TN 38002
|
1,367 sq. feet
|
2 baths 3 beds |
show details | |

|
#30
Cashmere Wood Dr
Arlington, TN 38002
|
1,643 sq. feet
|
2 baths 3 beds |
show details |
| Photo | Address | Area | Beds / Baths | Price | Details |
|---|---|---|---|---|---|

|
#31
Woodmeade Ln
Arlington, TN 38002
|
2,583 sq. feet
|
3 baths 4 beds |
show details | |

|
#32
Independent Rd
Arlington, TN 38002
|
904 sq. feet
|
1 baths 3 beds |
show details | |

|
#33
Woodson St
Arlington, TN 38002
|
1,574 sq. feet
|
2 baths 3 beds |
show details | |

|
#34
Misty Valley Dr
Arlington, TN 38002
|
1,375 sq. feet
|
2 baths 3 beds |
show details | |

|
#35
Logwood Cv
Arlington, TN 38002
|
2,640 sq. feet
|
3 baths 4 beds |
show details | |

|
#36
Chapel Meadow Ln
Arlington, TN 38002
|
2,536 sq. feet
|
2 baths 3 beds |
show details | |

|
#37
Stonecrest Cir
Arlington, TN 38002
|
2,644 sq. feet
|
2 baths 4 beds |
show details | |

|
#38
Club Walk Ct
Arlington, TN 38002
|
1,730 sq. feet
|
2 baths 3 beds |
show details | |

|
#39
Zellner St
Arlington, TN 38002
|
2,077 sq. feet
|
2 baths 3 beds |
show details | |

|
#40
Sail Boat Ln
Arlington, TN 38002
|
3,344 sq. feet
|
3 baths 4 beds |
show details |
| Photo | Address | Area | Beds / Baths | Price | Details |
|---|---|---|---|---|---|

|
#41
Ricks Rd
Arlington, TN 38002
|
2,966 sq. feet
|
3 baths 4 beds |
show details | |

|
#42
Springtree Dr
Arlington, TN 38002
|
2,760 sq. feet
|
2 baths 4 beds |
show details | |

|
#43
Anderson Bend Cv
Arlington, TN 38002
|
1,505 sq. feet
|
2 baths 3 beds |
show details | |

|
#44
Evening Ridge Dr
Arlington, TN 38002
|
2,147 sq. feet
|
2 baths 3 beds |
show details | |

|
#45
Day Lily Dr
Arlington, TN 38002
|
2,303 sq. feet
|
3 baths 4 beds |
show details | |

|
#46
Lake Bridge Dr
Arlington, TN 38002
|
3,250 sq. feet
|
2 baths 4 beds |
show details | |

|
#47
Shadowlawn Rd
Arlington, TN 38002
|
2,785 sq. feet
|
2 baths 4 beds |
show details | |

|
#48
Cashmere Wood Dr
Arlington, TN 38002
|
2,065 sq. feet
|
2 baths 3 beds |
show details | |

|
#49
Shadow Hills Dr
Arlington, TN 38002
|
2,389 sq. feet
|
2 baths 3 beds |
show details | |

|
Check over 1 million property listings on Foreclosure.com!
|
browse all offers | |||

Latest news about housing in Arlington, TN collected exclusively by city-data.com from local newspapers, TV, and radio stations

 | Where are all the old, Southern homes?!? (14 replies) |
| Best apartments in Memphis,TN area (8 replies) |
| APartments and car dealers near Collierville - Advise needed from locals (8 replies) |
| Where can I find a listing of homes for rent in Millington? (14 replies) |
| Arlington Vs Lakeland (5 replies) |
| Need a rental Home in 38125 area code (7 replies) |
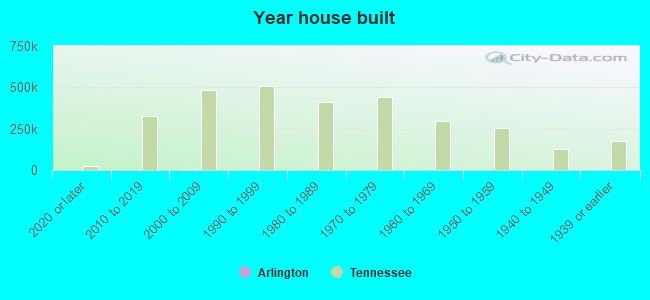
Median year apartment built: 2002
Household type by relationship:
Households: 14,186- Male householders: 2,429 (349 living alone), Female householders: 2,035 (234 living alone)
3,188 spouses (3,178 opposite-sex spouses), 247 unmarried partners, (247 opposite-sex unmarried partners), 5,767 children (5,396 natural, 104 adopted, 266 stepchildren), 213 grandchildren, 22 brothers or sisters, 65 parents, 0 foster children, 155 other relatives, 49 non-relatives
- In group quarters: 10
Size of family households: 1,158 2-persons, 799 3-persons, 1,298 4-persons, 496 5-persons, 83 6-persons, 41 7-or-more-persons.
Size of nonfamily households: 579 1-person, 55 2-persons, 17 3-persons.
3,399 married couples with children.
946 single-parent households (409 men, 537 women).
97.3% of residents of Arlington speak English at home.
0.8% of residents speak Spanish at home (54% speak English very well, 23% speak English well, 22% speak English not well).
0.6% of residents speak other Indo-European language at home (81% speak English very well, 19% speak English well).
0.4% of residents speak other language at home (100% speak English very well).
Foreign born population: 329 (2.3%)
(70.5% of them are naturalized citizens)
| Here: | 8.2 |
| State: | 6.5 |
| Here: | 6.8 |
| State: | 4.4 |
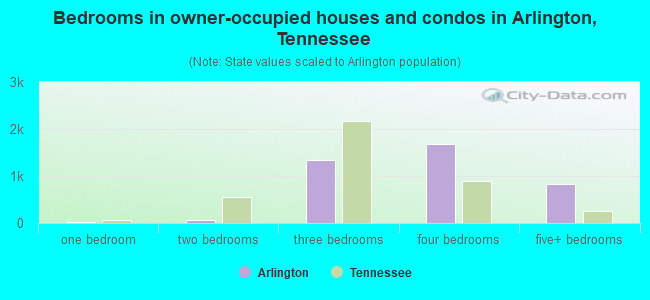
- Bedrooms in owner-occupied houses and condos in Arlington, Tennessee
- 0no bedroom
- 141 bedroom
- 652 bedrooms
- 1,3503 bedrooms
- 1,6724 bedrooms
- 8375+ bedrooms
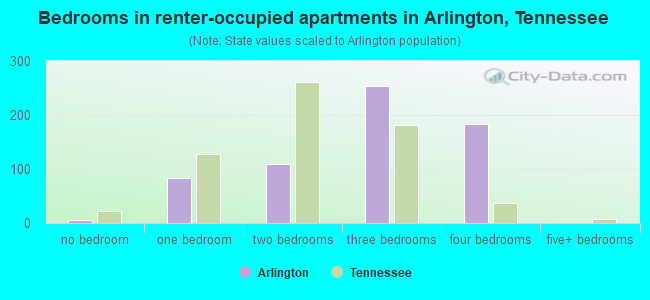
- Bedrooms in renter-occupied apartments in Arlington, Tennessee
- 5no bedroom
- 831 bedroom
- 1102 bedrooms
- 2543 bedrooms
- 1834 bedrooms
- 05+ bedrooms
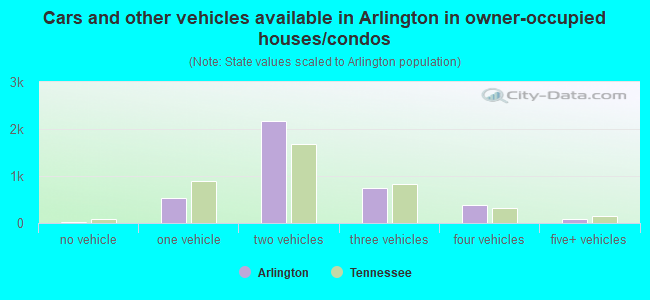
- Cars and other vehicles available in Arlington in owner-occupied houses/condos
- 12no vehicle
- 5401 vehicle
- 2,1742 vehicles
- 7453 vehicles
- 3914 vehicles
- 765+ vehicles
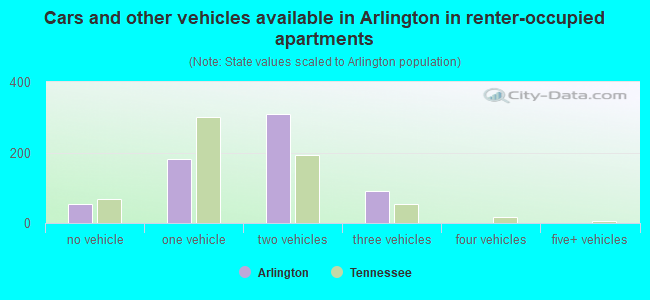
- Cars and other vehicles available in Arlington in renter-occupied apartments
- 54no vehicle
- 1821 vehicle
- 3082 vehicles
- 923 vehicles
- 04 vehicles
- 05+ vehicles
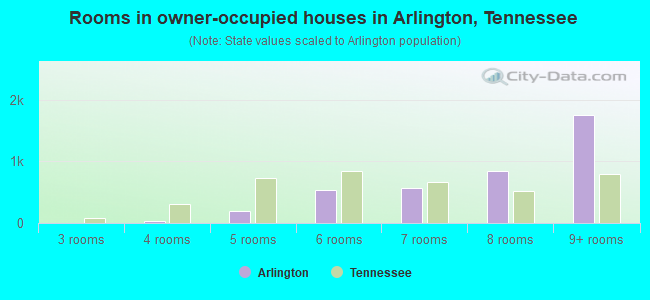
- Rooms in owner-occupied houses in Arlington, Tennessee
- 01 room
- 02 rooms
- 03 rooms
- 394 rooms
- 1915 rooms
- 5396 rooms
- 5727 rooms
- 8478 rooms
- 1,7519+ rooms
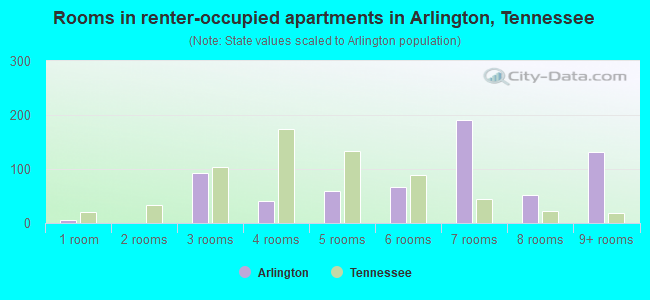
- Rooms in renter-occupied apartments in Arlington, Tennessee
- 51 room
- 02 rooms
- 933 rooms
- 414 rooms
- 595 rooms
- 676 rooms
- 1917 rooms
- 518 rooms
- 1319+ rooms
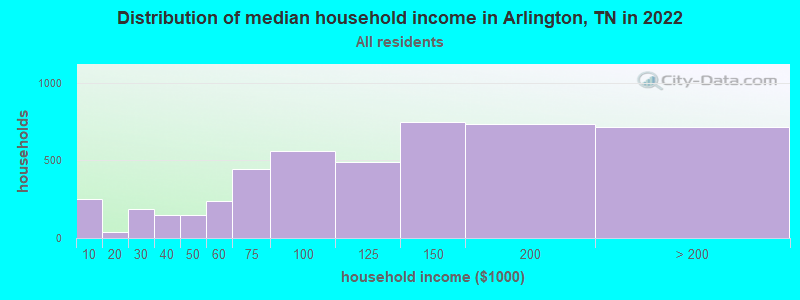
Arlington, TN household income distribution

- 249Less than $10,000
- 38$10,000 to $19,999
- 185$20,000 to $29,999
- 146$30,000 to $39,999
- 147$40,000 to $49,999
- 238$50,000 to $59,999
- 447$60,000 to $74,999
- 564$75,000 to $99,999
- 491$100,000 to $124,999
- 748$125,000 to $149,999
- 738$150,000 to $199,999
- 717$200,000 or more
Home value of owner - occupied houses in 2022 in Arlington, TN
-
- 143Less than $10,000
- 7$50,000 to $59,999
- 43$100,000 to $124,999
- 10$125,000 to $149,999
- 62$150,000 to $174,999
- 106$175,000 to $199,999
- 309$200,000 to $249,999
- 861$250,000 to $299,999
- 1,735$300,000 to $399,999
- 854$400,000 to $499,999
- 384$500,000 to $749,999
- 124$750,000 to $999,999
- 28$2,000,000 or more
Rent paid by renters in 2022 in Arlington, TN
-
- 25$400 to $449
- 16$450 to $499
- 3$550 to $599
- 69$600 to $649
- 1$800 to $899
- 53$1,000 to $1,249
- 67$1,250 to $1,499
- 361$1,500 to $1,999
- 41$2,000 to $2,499
- 107$2,500 to $2,999
- 13No cash rent
Percentage of workers working in this county: 97.2%
Number of people working at home: 1,470 (20.4% of all workers)
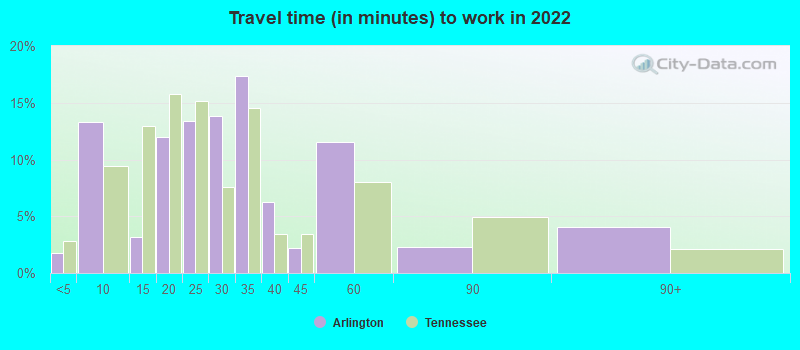
Travel time to work (commute)
- Less than 5 minutes: 42
- 5 to 9 minutes: 518
- 10 to 14 minutes: 33
- 15 to 19 minutes: 517
- 20 to 24 minutes: 1,153
- 25 to 29 minutes: 597
- 30 to 34 minutes: 1,385
- 35 to 39 minutes: 147
- 40 to 44 minutes: 559
- 45 to 59 minutes: 615
- 60 to 89 minutes: 80
- 90 or more minutes: 96
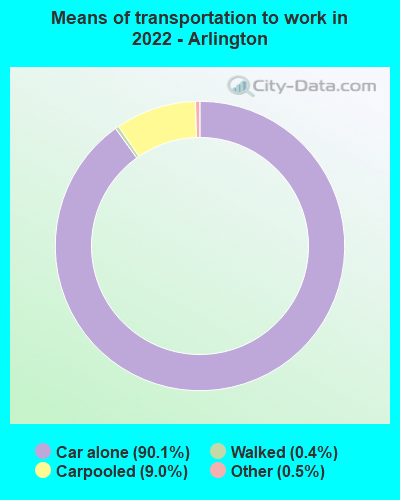
Means of transportation to work:
- Drove a car alone: 3,349 (68.8%)
- Carpooled: 366 (7.5%)
- Taxi: 24 (0.5%)
- Walked: 20 (0.4%)
- Worked at home: 1,470 (30.2%)
- Unemployment by race in 2022
- Unemployment rate for White non-Hispanic residents
- 1.8%Males
- 1.8%Females
- Unemployment rate for Black residents
- 1.9%Males
- 8.5%Females
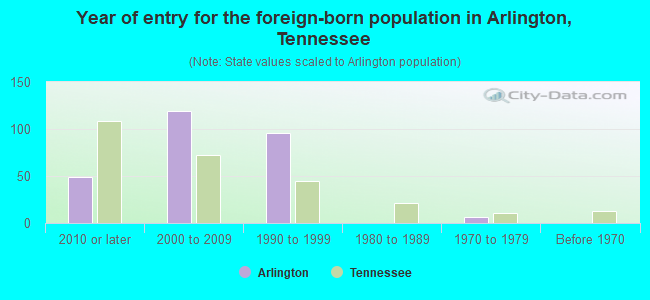
- Year of entry for the foreign-born population in Arlington, Tennessee
- 492010 or later
- 1192000 to 2009
- 961990 to 1999
- 01980 to 1989
- 61970 to 1979
- 0Before 1970
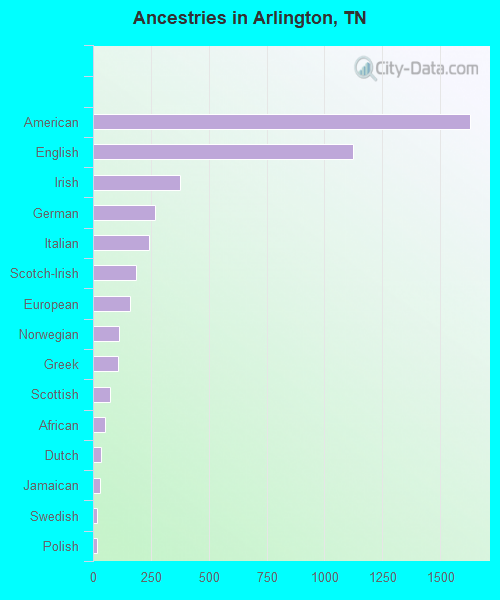
First ancestries reported:
- American: 1,630 (25.3%)
- English: 1,123 (17.4%)
- Irish: 376 (5.8%)
- German: 270 (4.2%)
- Italian: 241 (3.7%)
- Scotch-Irish: 186 (2.9%)
- European: 161 (2.5%)
- Norwegian: 111 (1.7%)
- Greek: 109 (1.7%)
- Scottish: 75 (1.2%)
- African: 50 (0.8%)
- Dutch: 33 (0.5%)
- Jamaican: 32 (0.5%)
- Swedish: 19 (0.3%)
- Polish: 18 (0.3%)
- Romanian: 13 (0.2%)
- Lebanese: 11 (0.2%)
- Serbian: 10 (0.2%)
- Afghan: 6 (0.09%)
Most common places of birth for foreign-born residents (%):
| Arlington: | 34.8% (115) |
| Tennessee: | 1.2% (4,587) |
| Arlington: | 14.8% (49) |
| Tennessee: | 1.2% (4,662) |
| Arlington: | 11.5% (38) |
| Tennessee: | 23.0% (86,435) |
| Arlington: | 10.0% (33) |
| Tennessee: | 0.0% (122) |
| Arlington: | 9.1% (30) |
| Tennessee: | 0.6% (2,405) |
| Arlington: | 8.5% (28) |
| Tennessee: | 0.2% (618) |
| Arlington: | 7.9% (26) |
| Tennessee: | 5.7% (21,286) |
| Arlington: | 5.8% (19) |
| Tennessee: | 1.0% (3,809) |
| Arlington: | 4.5% (15) |
| Tennessee: | 2.7% (10,295) |
| Arlington: | 2.1% (7) |
| Tennessee: | 0.3% (1,254) |
Place of birth for U.S.-born residents:
- This state: 8,397
- Other state: 5,114
- Northeast: 277
- Midwest: 1,277
- South: 2,465
- West: 1,086
92.6% of Arlington residents lived in the same house 1 years ago.
Out of people who lived in different houses, 42.4% lived in this county.
Out of people who lived in different counties, 38.1% lived in Tennessee.
| Arlington: | 92.6% |
| State average: | 87.0% |
Education attainment for males 25 years and older:
- No schooling: 34
- Nursery to 4th grade: 0
- 5th and 6th grade: 12
- 7th and 8th grade: 0
- 9th grade: 11
- 10th grade: 21
- 11th grade: 0
- 12th grade, no diploma: 58
- High school graduate (or equivalency): 814
- Less than 1 year of college: 260
- Some college more than 1 year, no degree: 386
- Associate degree: 610
- Bachelor's degree: 1,528
- Master's degree: 509
- Professional school degree: 173
- Doctorate degree: 96

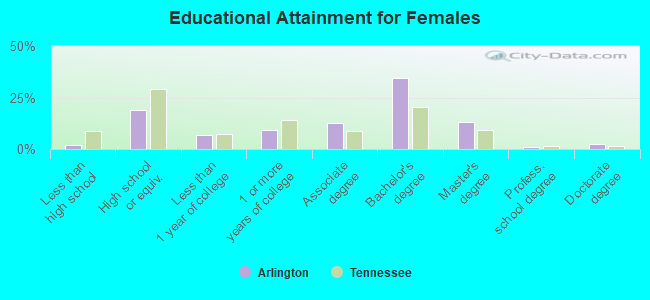
Education attainment for females 25 years and older:
- No schooling: 0
- Nursery to 4th grade: 0
- 5th and 6th grade: 28
- 7th and 8th grade: 0
- 9th grade: 25
- 10th grade: 0
- 11th grade: 0
- 12th grade, no diploma: 24
- High school graduate (or equivalency): 792
- Less than 1 year of college: 281
- Some college more than 1 year, no degree: 382
- Associate degree: 526
- Bachelor's degree: 1,448
- Master's degree: 561
- Professional school degree: 47
- Doctorate degree: 111
Housing units in structures:
- One, detached: 4,323
- Two: 19
- 3 or 4: 20
- 5 to 9: 141
- 10 to 19: 54
- 20 to 49: 63
- 50 or more: 5
- Mobile homes: 32
Housing units lacking complete kitchen facilities in 2022: 1.8%
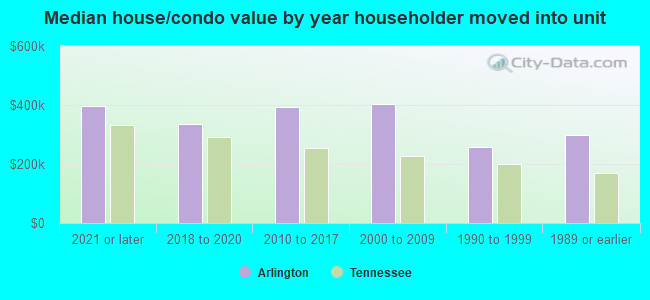
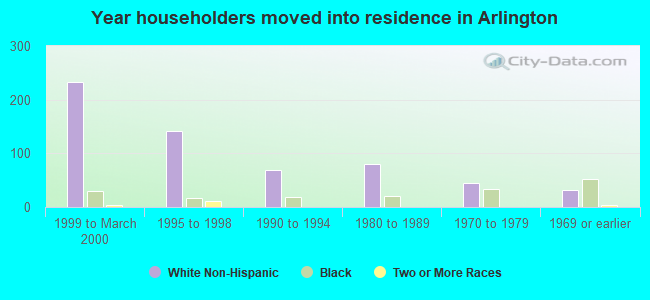
House/condo owner moved in on average 7 years ago
Renter moved in on average 1 years ago
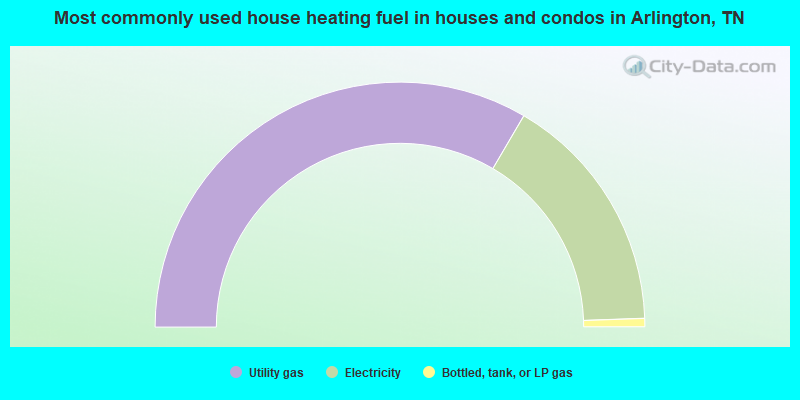
- 66.9%Utility gas
- 32.0%Electricity
- 1.1%Bottled, tank, or LP gas
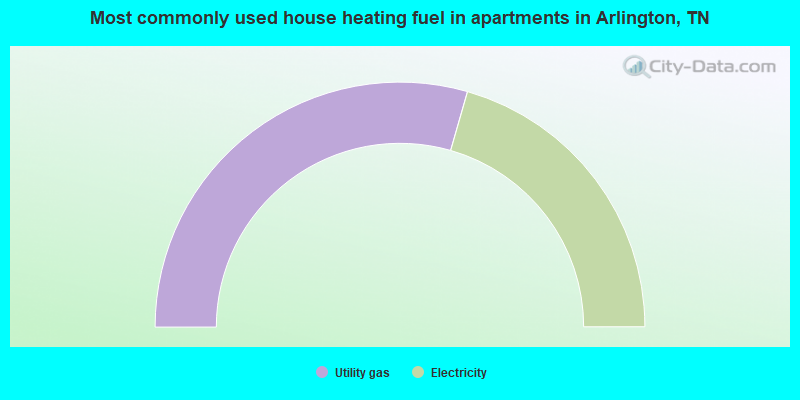
- 58.9%Utility gas
- 41.1%Electricity
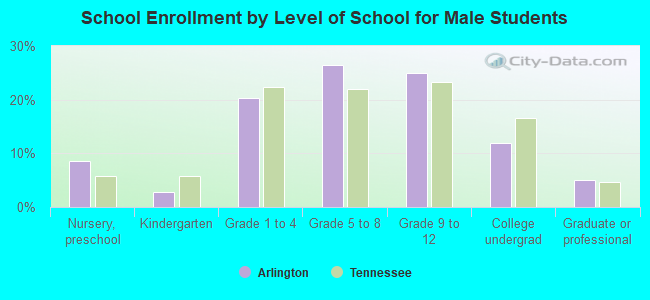
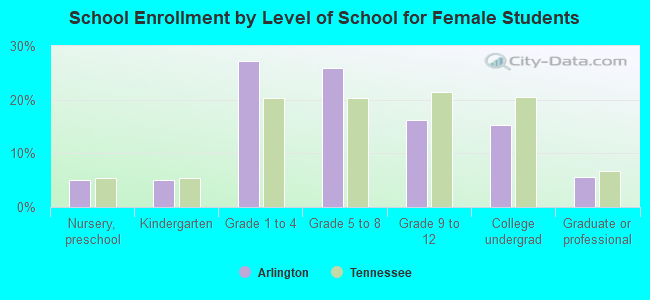
Private vs. public school enrollment:
| Here: | 2.2% |
| Tennessee: | 15.0% |
| Here: | 13.5% |
| Tennessee: | 16.2% |
| Here: | 40.9% |
| Tennessee: | 23.5% |