Housing density: 3,989 houses/condos per square mile
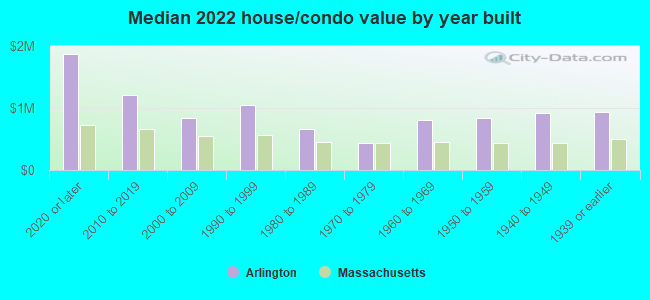
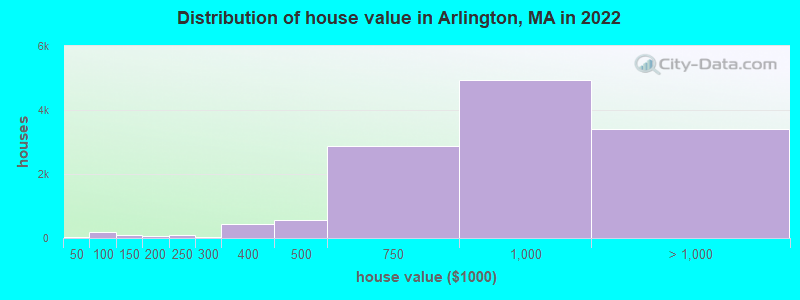
Median price asked for vacant for-sale houses and condos in 2022: $322,505.
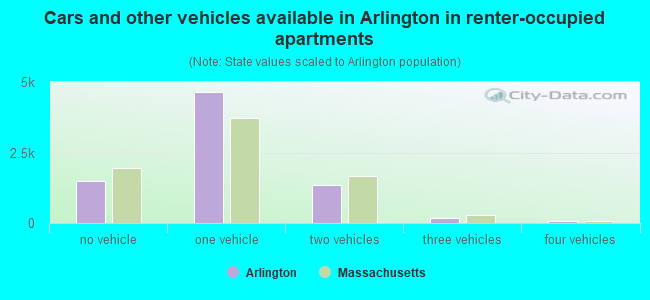
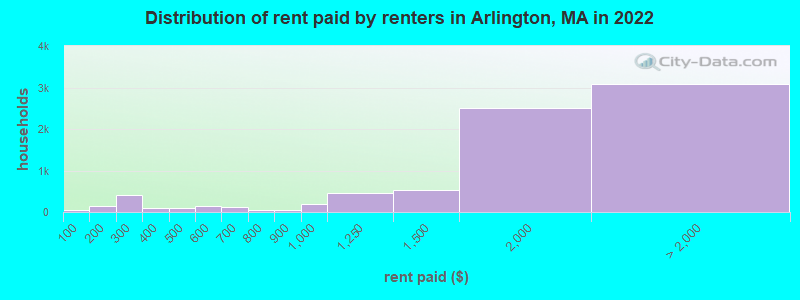
Median contract rent in 2022: $1,816 (lower quartile is $1,343, upper quartile is over $2,000)
Median rent asked for vacant for-rent units in 2022: $3,059
Median gross rent in Arlington, MA in 2022: $1,895
Housing units in Arlington with a mortgage: 7,446 (1,113 second mortgage, 39 home equity loan, 951 both second mortgage and home equity loan) Houses without a mortgage: 188
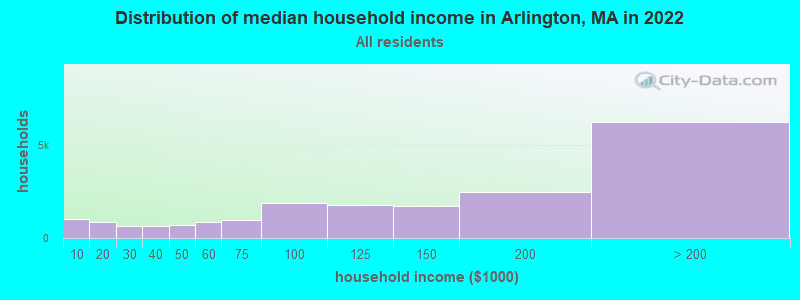
Median household income for houses/condos with a mortgage: $214,560
Median household income for apartments without a mortgage: $122,821
Median monthly housing costs: $2,111
Compare current foreclosures near Arlington, MA:
#1
Plymouth St
Arlington, MA 02476
2,719
sq. feet
2
baths
4
beds
#2
Brattle St
Arlington, MA 02474
1,641
sq. feet
1
baths
3
beds
#3
Gray St
Arlington, MA 02476
3,114
sq. feet
3
baths
9
beds
#4
Clyde Ter
Arlington, MA 02474
2,395
sq. feet
2
baths
3
beds
#5
Valentine Rd
Arlington, MA 02476
1,265
sq. feet
1
baths
3
beds
#6
Medford St
Arlington, MA 02474
2,562
sq. feet
2
baths
4
beds
#7
Park Cir
Arlington, MA 02476
3,388
sq. feet
2
baths
4
beds
#8
Burton St
Arlington, MA 02476
2,994
sq. feet
2
baths
4
beds
#9
Fremont St # A
Arlington, MA 02474
-
sq. feet
-
baths
-
beds
#10
Mystic St Apt 35
Arlington, MA 02474
-
sq. feet
-
baths
-
beds
#11
Fremont St
Arlington, MA 02474
-
sq. feet
-
baths
-
beds
#12
$418,000
Stillman St
Framingham, MA 01702
1,122
sq. feet
1
baths
2
beds
#13
$365,000
Johnson Rd
North Weymouth, MA 02191
748
sq. feet
1
baths
2
beds
#14
$650,000
Boyd St
Boston, MA 02124
3,970
sq. feet
3
baths
9
beds
#15
Kendrick Ave Apt 307
Quincy, MA 02169
1,234
sq. feet
2
baths
2
beds
#16
Church St
Boston, MA 02122
3,663
sq. feet
3
baths
6
beds
#17
Vernal St
Everett, MA 02149
2,601
sq. feet
2
baths
5
beds
#18
Tobey Ln
Wakefield, MA 01880
3,240
sq. feet
2
baths
4
beds
#19
Ridgehill Rd
Canton, MA 02021
1,196
sq. feet
1
baths
3
beds
#20
Savin Hill Avenue, Unit 2 190 Savin Hill Avenue Condominium
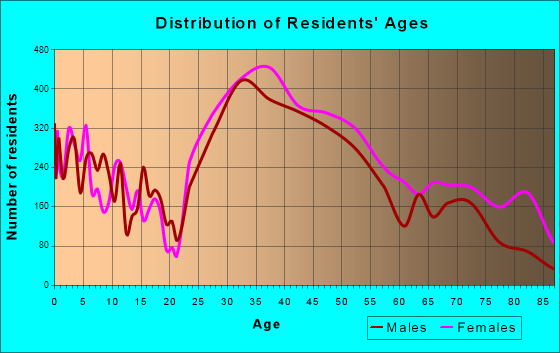
7,618 married couples with children.
1,343 single-parent households (354 men, 989 women).
76.6% of residents of Arlington speak English at home.
2.9% of residents speak Spanish at home (80% speak English very well, 16% speak English well, 3% speak English not well, 1% don't speak English at all).
11.0% of residents speak other Indo-European language at home (74% speak English very well, 22% speak English well, 3% speak English not well).
7.9% of residents speak Asian or Pacific Island language at home (68% speak English very well, 19% speak English well, 9% speak English not well, 4% don't speak English at all).
1.1% of residents speak other language at home (81% speak English very well, 16% speak English well, 3% speak English not well).
Foreign born population: 8,775 (19.2%)
(52.5% of them are naturalized citizens)
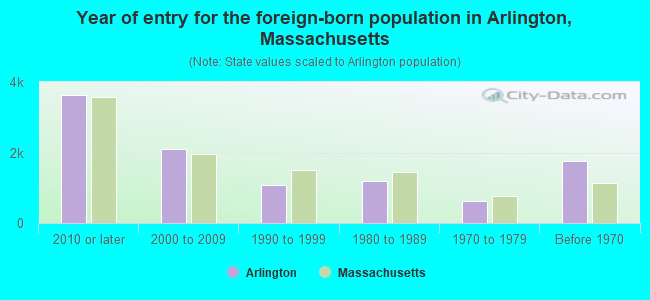
Year of entry for the foreign-born population in Arlington, Massachusetts
3,6272010 or later
2,1022000 to 2009
1,0741990 to 1999
1,1811980 to 1989
6351970 to 1979
1,770Before 1970
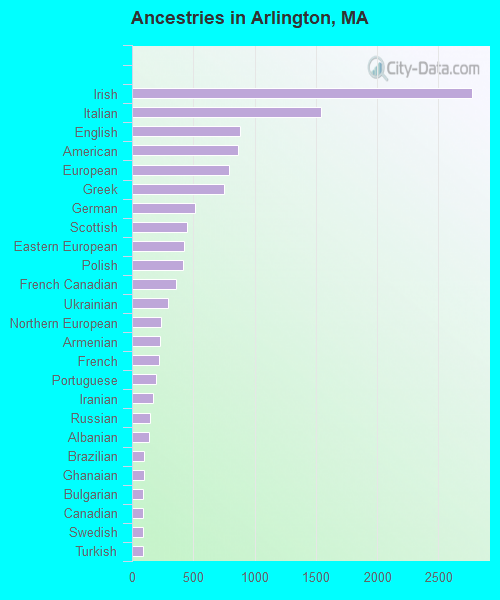
First ancestries reported:
Irish: 2,774 (12.8%)
Italian: 1,545 (7.1%)
English: 883 (4.1%)
American: 862 (4.0%)
European: 789 (3.6%)
Greek: 753 (3.5%)
German: 516 (2.4%)
Scottish: 446 (2.1%)
Eastern European: 426 (2.0%)
Polish: 414 (1.9%)
French Canadian: 355 (1.6%)
Ukrainian: 295 (1.4%)
Northern European: 236 (1.1%)
Armenian: 225 (1.0%)
French: 217 (1.0%)
Portuguese: 193 (0.9%)
Iranian: 173 (0.8%)
Russian: 147 (0.7%)
Albanian: 140 (0.6%)
Brazilian: 101 (0.5%)
Ghanaian: 94 (0.4%)
Bulgarian: 92 (0.4%)
Canadian: 91 (0.4%)
Swedish: 88 (0.4%)
Turkish: 86 (0.4%)
Dutch: 77 (0.4%)
Haitian: 77 (0.4%)
British: 69 (0.3%)
Jamaican: 69 (0.3%)
Finnish: 65 (0.3%)
Scotch-Irish: 65 (0.3%)
Lithuanian: 59 (0.3%)
African: 57 (0.3%)
Norwegian: 52 (0.2%)
Welsh: 51 (0.2%)
Syrian: 43 (0.2%)
Lebanese: 41 (0.2%)
Czechoslovakian: 30 (0.1%)
Jordanian: 27 (0.1%)
Egyptian: 24 (0.1%)
Danish: 23 (0.1%)
Celtic: 23 (0.1%)
Ethiopian: 21 (0.10%)
Czech: 21 (0.10%)
Slovene: 20 (0.09%)
West Indian: 19 (0.09%)
Yugoslavian: 19 (0.09%)
Assyrian: 18 (0.08%)
Icelander: 17 (0.08%)
Swiss: 17 (0.08%)
British West Indian: 15 (0.07%)
Israeli: 14 (0.06%)
Cape Verdean: 13 (0.06%)
Romanian: 13 (0.06%)
New Zealander: 9 (0.04%)
Slovak: 8 (0.04%)
Hungarian: 2 (0.01%)
Most common places of birth for foreign-born residents (%):
India
Arlington:
15.9% (1,398)
Massachusetts:
6.8% (82,934)
China, excluding Hong Kong and Taiwan
Arlington:
11.9% (1,040)
Massachusetts:
8.4% (103,233)
Japan
Arlington:
4.8% (418)
Massachusetts:
0.6% (7,301)
Canada
Arlington:
4.3% (373)
Massachusetts:
2.3% (28,158)
Korea
Arlington:
3.9% (340)
Massachusetts:
1.4% (17,613)
Ukraine
Arlington:
3.5% (306)
Massachusetts:
0.9% (10,808)
Thailand
Arlington:
3.0% (262)
Massachusetts:
0.5% (5,553)
Greece
Arlington:
2.8% (245)
Massachusetts:
0.8% (10,043)
France
Arlington:
2.8% (245)
Massachusetts:
0.6% (7,364)
Israel
Arlington:
2.4% (213)
Massachusetts:
0.5% (6,073)
Nepal
Arlington:
2.2% (192)
Massachusetts:
0.6% (6,789)
Albania
Arlington:
1.9% (169)
Massachusetts:
1.1% (13,076)
Germany
Arlington:
1.9% (164)
Massachusetts:
1.0% (12,529)
Italy
Arlington:
1.7% (148)
Massachusetts:
1.4% (16,886)
Iran
Arlington:
1.7% (145)
Massachusetts:
0.6% (7,213)
Sri Lanka
Arlington:
1.5% (135)
Massachusetts:
0.2% (1,990)
Place of birth for U.S.-born residents:
This state: 22,500
Other state: 13,598
Northeast: 7,183
Midwest: 2,067
South: 2,479
West: 1,842
87.0% of Arlington residents lived in the same house 1 years ago. Out of people who lived in different houses, 36.4% lived in this county. Out of people who lived in different counties, 68.6% lived in Massachusetts.
Arlington:
87.0%
State average:
87.7%
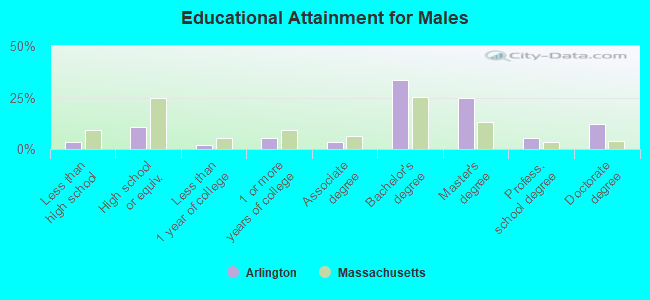
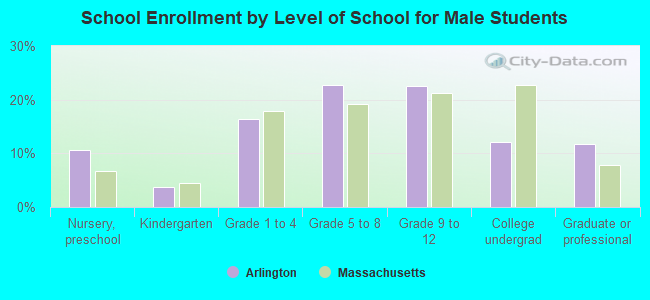
Education attainment for males 25 years and older:
No schooling: 98
Nursery to 4th grade: 18
5th and 6th grade: 26
7th and 8th grade: 43
9th grade: 36
10th grade: 32
11th grade: 30
12th grade, no diploma: 236
High school graduate (or equivalency): 1,660
Less than 1 year of college: 303
Some college more than 1 year, no degree: 842
Associate degree: 501
Bachelor's degree: 5,277
Master's degree: 3,909
Professional school degree: 840
Doctorate degree: 1,934
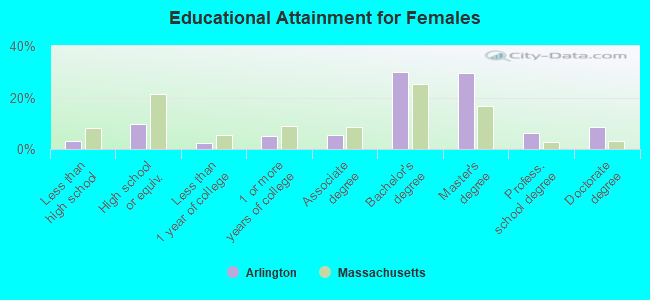
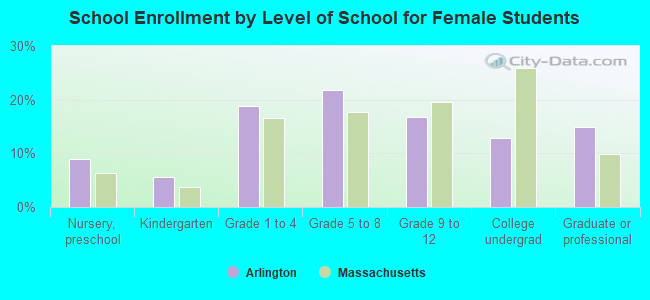
Education attainment for females 25 years and older:
No schooling: 221
Nursery to 4th grade: 16
5th and 6th grade: 27
7th and 8th grade: 48
9th grade: 32
10th grade: 79
11th grade: 18
12th grade, no diploma: 118
High school graduate (or equivalency): 1,753
Less than 1 year of college: 426
Some college more than 1 year, no degree: 931
Associate degree: 1,016
Bachelor's degree: 5,396
Master's degree: 5,365
Professional school degree: 1,122
Doctorate degree: 1,578
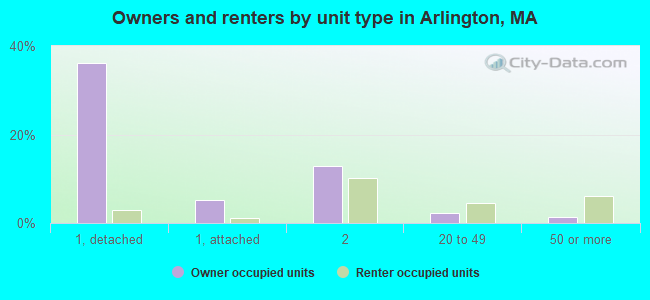
Housing units in structures:
One, detached: 8,053
One, attached: 1,209
Two: 5,096
3 or 4: 1,253
5 to 9: 608
10 to 19: 1,480
20 to 49: 1,374
50 or more: 1,532
Mobile homes: 53
Boats, RVs, vans, etc.: 9
Housing units lacking complete kitchen facilities in 2022: 0.5%
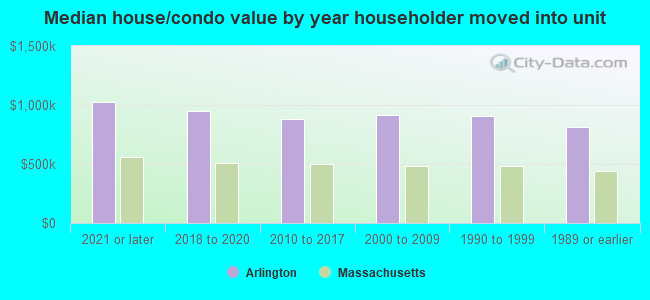
House/condo owner moved in on average 16 years ago