Archbald, PA (Pennsylvania) Houses and Residents
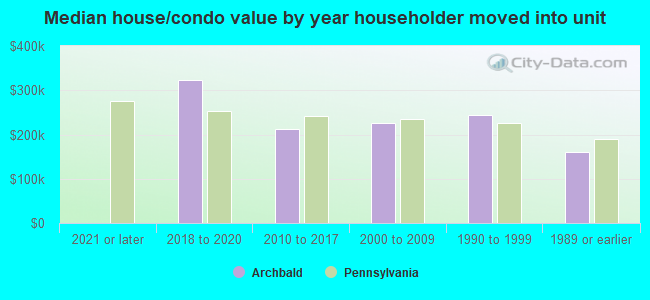
| Archbald: | $215,210 |
| Pennsylvania: | $245,500 |
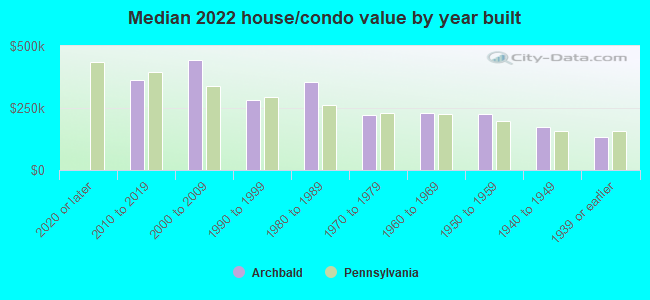
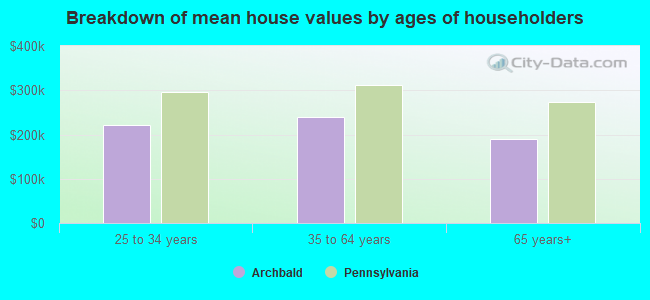
Mean price in 2022:
Detached houses: $222,135
Here: $222,135 State: $317,202 Townhouses or other attached units: $265,142
Here: $265,142 State: $254,369
Total population: 7,075 (Urban population: 5,495, Rural population: 725 (all nonfarm))
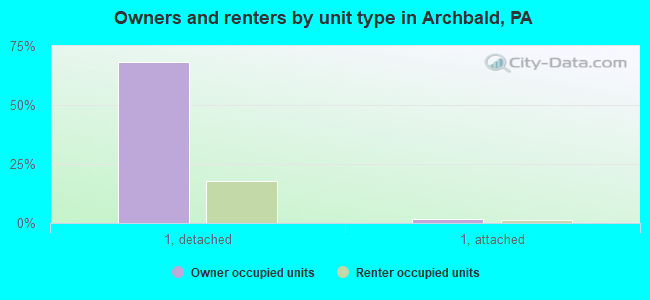
Houses: 3,094 (2,919 occupied: 2,165 owner occupied, 791 renter occupied)
| % of renters here: | 27% |
| State: | 31% |
Housing density: 184 houses/condos per square mile
Median price asked for vacant for-sale houses and condos in 2022 in this county: $63,568.
Median contract rent in 2022: $688 (lower quartile is $553, upper quartile is $858)
Median rent asked for vacant for-rent units in 2022: $487
Median gross rent in Archbald, PA in 2022: $919
Housing units in Archbald with a mortgage: 1,209 (133 second mortgage, 0 home equity loan, 138 both second mortgage and home equity loan)
Houses without a mortgage: 0
Median household income for houses/condos with a mortgage: $100,420
Median household income for apartments without a mortgage: $74,129
Median monthly housing costs: $892
Compare current foreclosures near Archbald, PA:
| Photo | Address | Area | Beds / Baths | Price | Details |
|---|---|---|---|---|---|

|
#1
Rachel Dr
Archbald, PA 18403
|
2,050 sq. feet
|
2 baths 3 beds |
show details | |

|
#2
S Main St
Archbald, PA 18403
|
1,529 sq. feet
|
2 baths 3 beds |
show details | |

|
#3
Main St
Archbald, PA 18403
|
- sq. feet
|
- baths - beds |
$24,900
|
show details |

|
#4
Thomas St
Archbald, PA 18403
|
- sq. feet
|
2 baths 2 beds |
show details | |

|
#5
Altier Dr
Archbald, PA 18403
|
- sq. feet
|
- baths - beds |
show details | |

|
#6
Skyline Dr
Archbald, PA 18403
|
- sq. feet
|
- baths - beds |
show details | |

|
#7
Riverside Dr
Archbald, PA 18403
|
- sq. feet
|
- baths - beds |
show details | |

|
#8
East St
Archbald, PA 18403
|
- sq. feet
|
- baths - beds |
show details | |

|
#9
Being 8b Rachel Drive Aka 8 Rache Drive
Archbald, PA 18403
|
- sq. feet
|
- baths - beds |
show details | |

|
#10
Maple St
Scranton, PA 18505
|
1,500 sq. feet
|
1 baths 3 beds |
$195,500
|
show details |
| Photo | Address | Area | Beds / Baths | Price | Details |
|---|---|---|---|---|---|

|
#11
Burcher Ave
Clarks Summit, PA 18411
|
1,800 sq. feet
|
2 baths 3 beds |
$445,500
|
show details |

|
#12
Liberty St
Pittston, PA 18641
|
960 sq. feet
|
1 baths 2 beds |
$152,500
|
show details |

|
#13
Searle St
Pittston, PA 18640
|
1,176 sq. feet
|
1 baths 2 beds |
$169,900
|
show details |

|
#14
Cedar Ave
Scranton, PA 18505
|
1,500 sq. feet
|
1 baths 3 beds |
$26,900
|
show details |

|
#15
S Main St
Archbald, PA 18403
|
- sq. feet
|
- baths - beds |
show details | |

|
#16
Railroad St
Archbald, PA 18403
|
- sq. feet
|
- baths - beds |
show details | |

|
#17
Beech St
Archbald, PA 18403
|
- sq. feet
|
- baths - beds |
show details | |

|
#18
Cemetery St
Archbald, PA 18403
|
- sq. feet
|
- baths - beds |
show details | |

|
#19
Main St
Archbald, PA 18403
|
- sq. feet
|
- baths - beds |
show details | |

|
#20
N Main St
Archbald, PA 18403
|
- sq. feet
|
- baths - beds |
show details |
| Photo | Address | Area | Beds / Baths | Price | Details |
|---|---|---|---|---|---|

|
#21
Monroe St
Archbald, PA 18403
|
- sq. feet
|
- baths - beds |
show details | |

|
#22
N Main St
Archbald, PA 18403
|
- sq. feet
|
- baths - beds |
show details | |

|
#23
Old Mill Rd
Dalton, PA 18414
|
- sq. feet
|
1 baths 2 beds |
$114,400
|
show details |

|
#24
Spring St
Carbondale, PA 18407
|
1,276 sq. feet
|
1 baths 3 beds |
show details | |

|
#25
Main St
Peckville, PA 18452
|
1,768 sq. feet
|
1 baths 4 beds |
show details | |

|
#26
Evergreen Dr
Clarks Summit, PA 18411
|
1,100 sq. feet
|
1 baths 3 beds |
show details | |

|
#27
S Church St
Carbondale, PA 18407
|
3,100 sq. feet
|
3 baths 4 beds |
show details | |

|
#28
Sanderson Ave
Olyphant, PA 18447
|
- sq. feet
|
1 baths 3 beds |
show details | |

|
#29
Maple Cir
Greentown, PA 18426
|
1,248 sq. feet
|
2 baths 3 beds |
show details | |

|
#30
N Garfield Ave
Scranton, PA 18504
|
1,776 sq. feet
|
1 baths 4 beds |
show details |
| Photo | Address | Area | Beds / Baths | Price | Details |
|---|---|---|---|---|---|

|
#31
Petrilak Rd
Carbondale, PA 18407
|
1,400 sq. feet
|
1 baths 3 beds |
show details | |

|
#32
Elkview Dr
Forest City, PA 18421
|
1,080 sq. feet
|
1 baths 3 beds |
show details | |

|
#33
Hamlin Hwy
Hamlin, PA 18427
|
1,180 sq. feet
|
1 baths 3 beds |
show details | |

|
#34
Lower Powderly St
Carbondale, PA 18407
|
- sq. feet
|
2 baths 3 beds |
show details | |

|
#35
S Hyde Park Ave
Scranton, PA 18504
|
1,760 sq. feet
|
2 baths 4 beds |
show details | |

|
#36
Oak Dr
Hawley, PA 18428
|
1,066 sq. feet
|
1 baths 3 beds |
show details | |

|
#37
Laurel Creek Dr
Dickson City, PA 18519
|
2,099 sq. feet
|
2 baths 4 beds |
show details | |

|
#38
Poplar St
Dickson City, PA 18519
|
1,160 sq. feet
|
1 baths 3 beds |
show details | |

|
#39
Opeil Rd
Jermyn, PA 18433
|
- sq. feet
|
2 baths 4 beds |
show details | |

|
#40
E Scott St
Olyphant, PA 18447
|
1,648 sq. feet
|
2 baths 2 beds |
show details |
| Photo | Address | Area | Beds / Baths | Price | Details |
|---|---|---|---|---|---|

|
#41
Circle Dr
Pittston, PA 18643
|
- sq. feet
|
1 baths 3 beds |
show details | |

|
#42
Shady Lane Rd
Clarks Summit, PA 18411
|
2,648 sq. feet
|
2 baths 5 beds |
show details | |

|
#43
Linden St
Pittston, PA 18643
|
2,428 sq. feet
|
3 baths 3 beds |
show details | |

|
#44
Norman St
Pittston, PA 18640
|
1,452 sq. feet
|
2 baths 2 beds |
show details | |

|
#45
River St
Jessup, PA 18434
|
1,510 sq. feet
|
1 baths 3 beds |
show details | |

|
#46
N Sumner Ave
Scranton, PA 18508
|
1,025 sq. feet
|
1 baths 2 beds |
show details | |

|
#47
Carbondale Rd
Waymart, PA 18472
|
2,187 sq. feet
|
2 baths 4 beds |
show details | |

|
#48
Van Leuven Rd
Lake Ariel, PA 18436
|
- sq. feet
|
2 baths 3 beds |
show details | |

|
#49
Grace St
Scranton, PA 18509
|
1,220 sq. feet
|
2 baths 4 beds |
show details | |

|
Check over 1 million property listings on Foreclosure.com!
|
browse all offers | |||

Latest news about housing in Archbald, PA collected exclusively by city-data.com from local newspapers, TV, and radio stations


Median year apartment built: 1951
Household type by relationship:
Households: 7,314- Male householders: 1,610 (309 living alone), Female householders: 1,299 (267 living alone)
1,579 spouses (1,579 opposite-sex spouses), 208 unmarried partners, (208 opposite-sex unmarried partners), 2,242 children (2,164 natural, 17 adopted, 59 stepchildren), 68 grandchildren, 58 brothers or sisters, 55 parents, 0 foster children, 95 other relatives, 87 non-relatives
- In group quarters: 4
Size of family households: 1,026 2-persons, 359 3-persons, 435 4-persons, 252 5-persons, 16 6-persons.
Size of nonfamily households: 611 1-person, 181 2-persons, 47 3-persons.
1,275 married couples with children.
360 single-parent households (151 men, 209 women).
98.1% of residents of Archbald speak English at home.
0.9% of residents speak other Indo-European language at home (100% speak English very well).
0.2% of residents speak Asian or Pacific Island language at home (100% speak English not well).
Foreign born population: 56 (0.8%)
(23.2% of them are naturalized citizens)
| Here: | 6.5 |
| State: | 6.8 |
| Here: | 4.5 |
| State: | 4.3 |
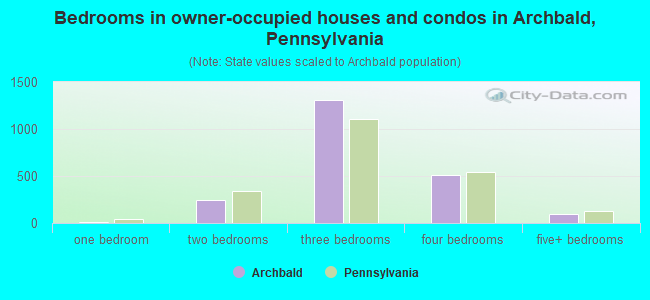
- Bedrooms in owner-occupied houses and condos in Archbald, Pennsylvania
- 0no bedroom
- 151 bedroom
- 2432 bedrooms
- 1,3093 bedrooms
- 5074 bedrooms
- 915+ bedrooms
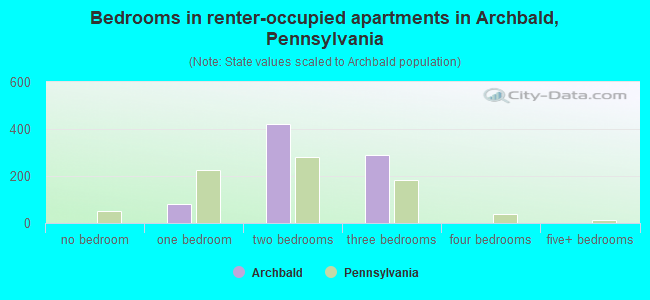
- Bedrooms in renter-occupied apartments in Archbald, Pennsylvania
- 0no bedroom
- 821 bedroom
- 4202 bedrooms
- 2883 bedrooms
- 04 bedrooms
- 05+ bedrooms
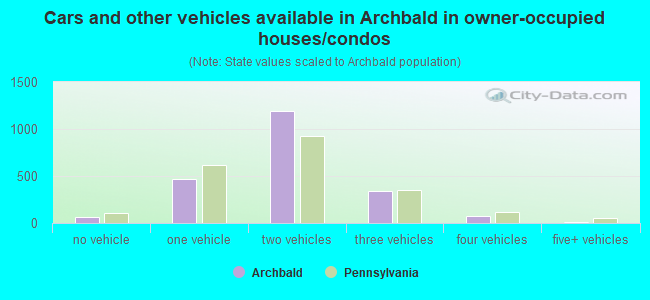
- Cars and other vehicles available in Archbald in owner-occupied houses/condos
- 66no vehicle
- 4681 vehicle
- 1,1942 vehicles
- 3433 vehicles
- 784 vehicles
- 155+ vehicles
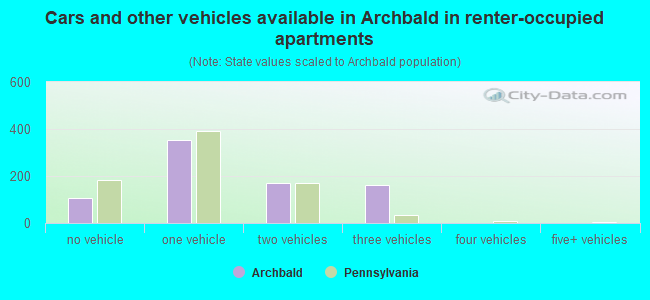
- Cars and other vehicles available in Archbald in renter-occupied apartments
- 105no vehicle
- 3551 vehicle
- 1712 vehicles
- 1603 vehicles
- 04 vehicles
- 05+ vehicles
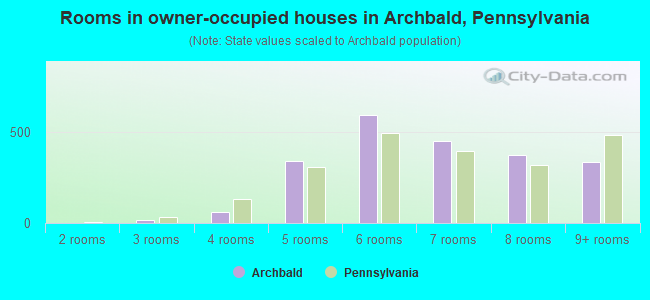
- Rooms in owner-occupied houses in Archbald, Pennsylvania
- 01 room
- 02 rooms
- 153 rooms
- 594 rooms
- 3385 rooms
- 5926 rooms
- 4527 rooms
- 3748 rooms
- 3359+ rooms
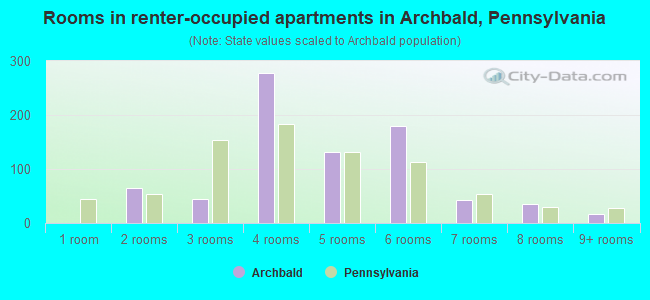
- Rooms in renter-occupied apartments in Archbald, Pennsylvania
- 01 room
- 642 rooms
- 443 rooms
- 2774 rooms
- 1315 rooms
- 1806 rooms
- 437 rooms
- 368 rooms
- 179+ rooms
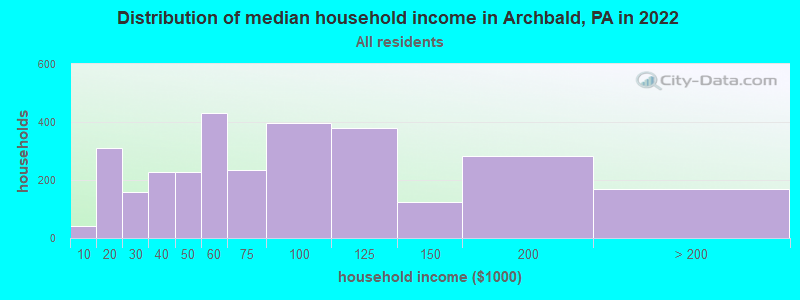
Archbald, PA household income distribution

- 41Less than $10,000
- 310$10,000 to $19,999
- 159$20,000 to $29,999
- 228$30,000 to $39,999
- 228$40,000 to $49,999
- 432$50,000 to $59,999
- 236$60,000 to $74,999
- 398$75,000 to $99,999
- 378$100,000 to $124,999
- 123$125,000 to $149,999
- 284$150,000 to $199,999
- 169$200,000 or more
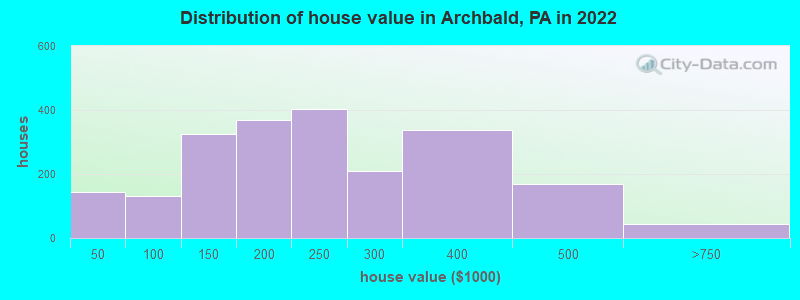
Home value of owner - occupied houses in 2022 in Archbald, PA
-
- 27Less than $10,000
- 52$30,000 to $34,999
- 64$40,000 to $49,999
- 7$50,000 to $59,999
- 58$80,000 to $89,999
- 154$100,000 to $124,999
- 170$125,000 to $149,999
- 161$150,000 to $174,999
- 207$175,000 to $199,999
- 402$200,000 to $249,999
- 209$250,000 to $299,999
- 335$300,000 to $399,999
- 170$400,000 to $499,999
- 43$500,000 to $749,999
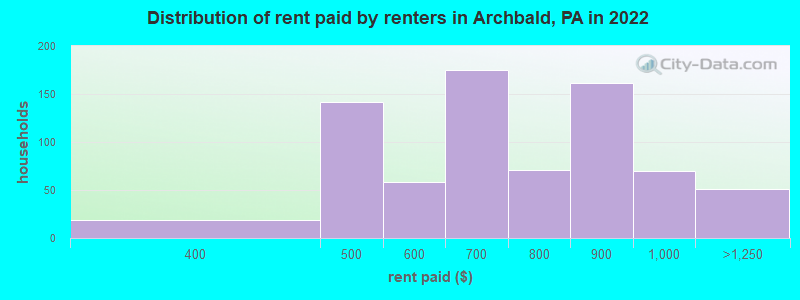
Rent paid by renters in 2022 in Archbald, PA
-
- 18$350 to $399
- 95$400 to $449
- 46$450 to $499
- 24$500 to $549
- 33$550 to $599
- 31$600 to $649
- 143$650 to $699
- 25$700 to $749
- 44$750 to $799
- 161$800 to $899
- 70$900 to $999
- 50$1,000 to $1,249
Percentage of workers working in this county: 78.5%
Number of people working at home: 249 (6.4% of all workers)
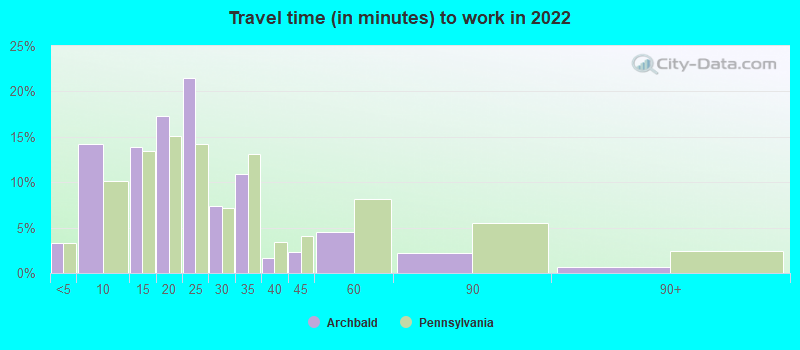
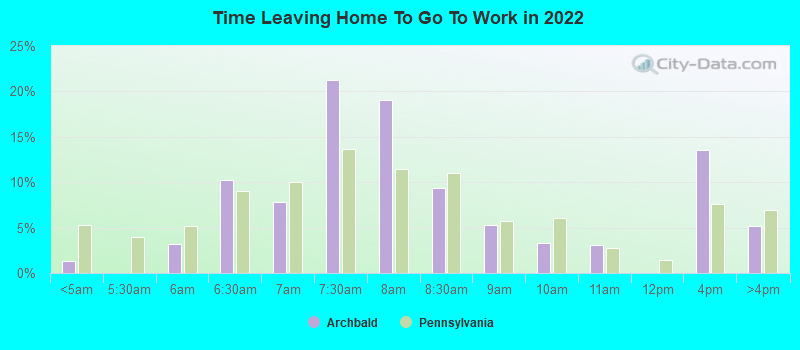
Travel time to work (commute)
- Less than 5 minutes: 118
- 5 to 9 minutes: 454
- 10 to 14 minutes: 540
- 15 to 19 minutes: 574
- 20 to 24 minutes: 798
- 25 to 29 minutes: 245
- 30 to 34 minutes: 522
- 35 to 39 minutes: 99
- 40 to 44 minutes: 146
- 45 to 59 minutes: 72
- 60 to 89 minutes: 34
- 90 or more minutes: 73
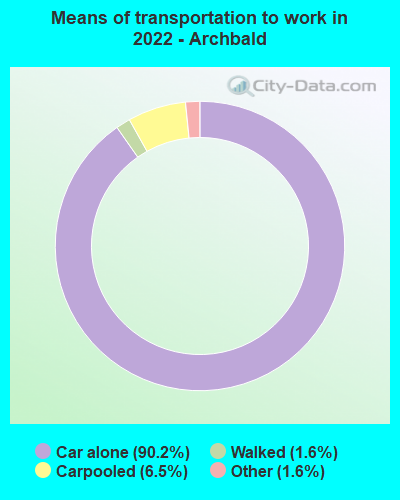
Means of transportation to work:
- Drove a car alone: 3,434 (82.9%)
- Carpooled: 247 (6.0%)
- Taxi: 73 (1.8%)
- Walked: 62 (1.5%)
- Worked at home: 264 (6.4%)
- Unemployment by race in 2022
- Unemployment rate for White non-Hispanic residents
- 2.9%Males
- 1.0%Females
- Unemployment rate for Black residents
- 100.0%Males
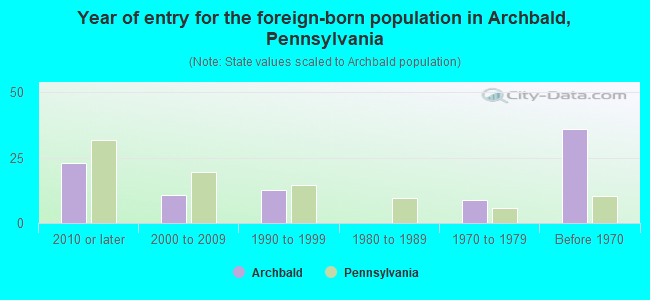
- Year of entry for the foreign-born population in Archbald, Pennsylvania
- 232010 or later
- 112000 to 2009
- 131990 to 1999
- 01980 to 1989
- 91970 to 1979
- 36Before 1970
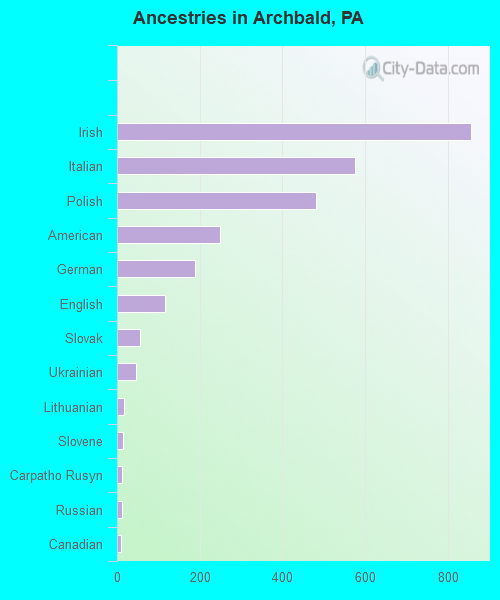
First ancestries reported:
- Irish: 857 (29.6%)
- Italian: 576 (19.9%)
- Polish: 482 (16.7%)
- American: 249 (8.6%)
- German: 188 (6.5%)
- English: 117 (4.0%)
- Slovak: 56 (1.9%)
- Ukrainian: 47 (1.6%)
- Lithuanian: 16 (0.6%)
- Slovene: 14 (0.5%)
- Carpatho Rusyn: 12 (0.4%)
- Russian: 11 (0.4%)
- Canadian: 9 (0.3%)
Most common places of birth for foreign-born residents (%):
| Archbald: | 70.2% (40) |
| Pennsylvania: | 10.7% (100,596) |
| Archbald: | 19.3% (11) |
| Pennsylvania: | 7.2% (67,704) |
Place of birth for U.S.-born residents:
- This state: 6,182
- Other state: 1,028
- Northeast: 650
- Midwest: 14
- South: 182
- West: 168
91.7% of Archbald residents lived in the same house 1 years ago.
Out of people who lived in different houses, 21.0% lived in this county.
Out of people who lived in different counties, 61.1% lived in Pennsylvania.
| Archbald: | 91.7% |
| State average: | 89.3% |
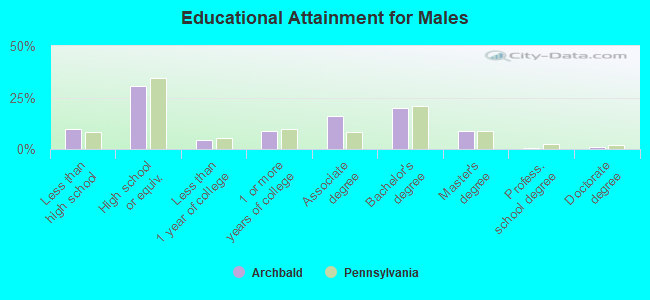
Education attainment for males 25 years and older:
- No schooling: 0
- Nursery to 4th grade: 0
- 5th and 6th grade: 0
- 7th and 8th grade: 0
- 9th grade: 5
- 10th grade: 48
- 11th grade: 145
- 12th grade, no diploma: 29
- High school graduate (or equivalency): 732
- Less than 1 year of college: 107
- Some college more than 1 year, no degree: 203
- Associate degree: 386
- Bachelor's degree: 470
- Master's degree: 213
- Professional school degree: 17
- Doctorate degree: 27
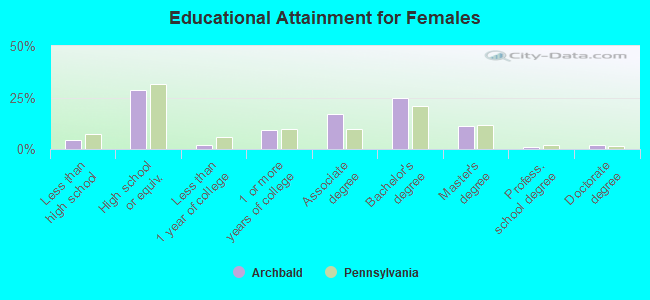
Education attainment for females 25 years and older:
- No schooling: 0
- Nursery to 4th grade: 0
- 5th and 6th grade: 0
- 7th and 8th grade: 0
- 9th grade: 0
- 10th grade: 43
- 11th grade: 22
- 12th grade, no diploma: 37
- High school graduate (or equivalency): 712
- Less than 1 year of college: 51
- Some college more than 1 year, no degree: 226
- Associate degree: 422
- Bachelor's degree: 612
- Master's degree: 274
- Professional school degree: 22
- Doctorate degree: 48
Housing units in structures:
- One, detached: 2,608
- One, attached: 163
- Two: 53
- 3 or 4: 110
- 5 to 9: 102
- Mobile homes: 57
Housing units lacking complete kitchen facilities in 2022: 2.4%
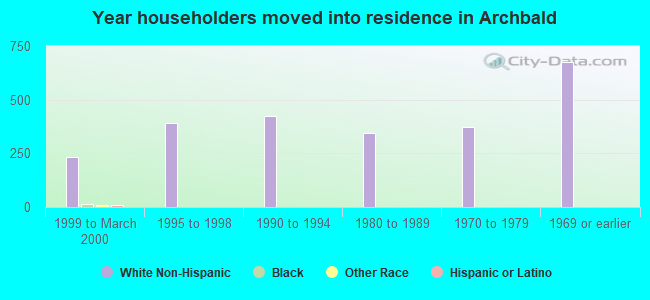
House/condo owner moved in on average 16 years ago
Renter moved in on average 5 years ago
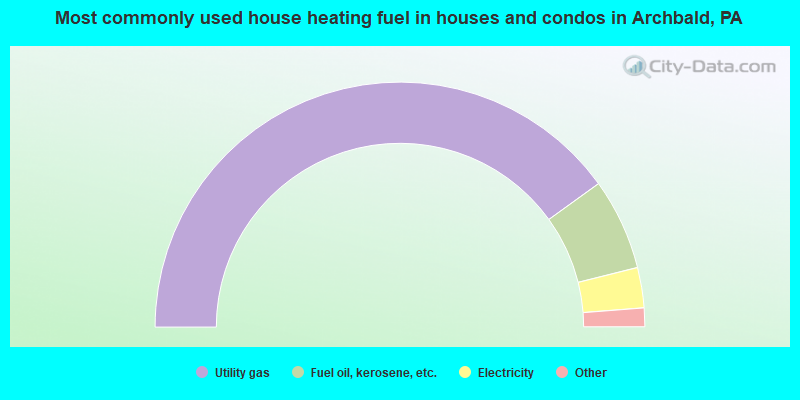
- 80.2%Utility gas
- 12.1%Fuel oil, kerosene, etc.
- 5.3%Electricity
- 0.9%Wood
- 0.8%Bottled, tank, or LP gas
- 0.7%Other fuel
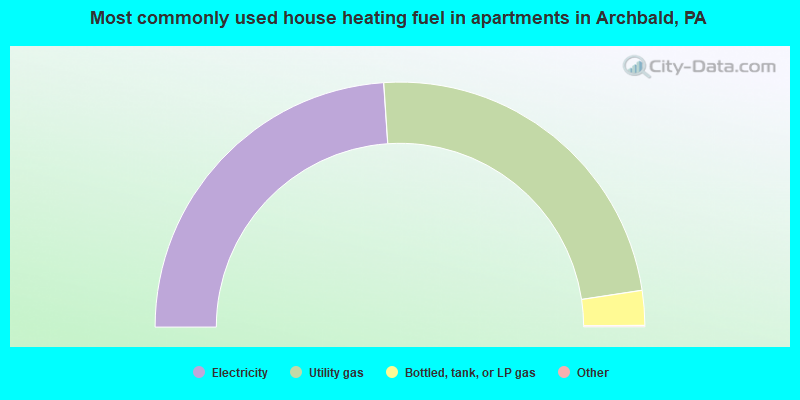
- 48.0%Electricity
- 47.4%Utility gas
- 4.6%Bottled, tank, or LP gas
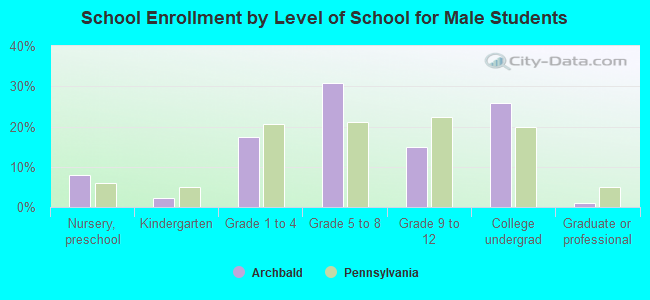
Private vs. public school enrollment:
| Here: | 0.0% |
| Pennsylvania: | 15.7% |
| Here: | 4.0% |
| Pennsylvania: | 13.4% |
| Here: | 44.3% |
| Pennsylvania: | 39.8% |