Antioch, CA (California) Houses and Residents
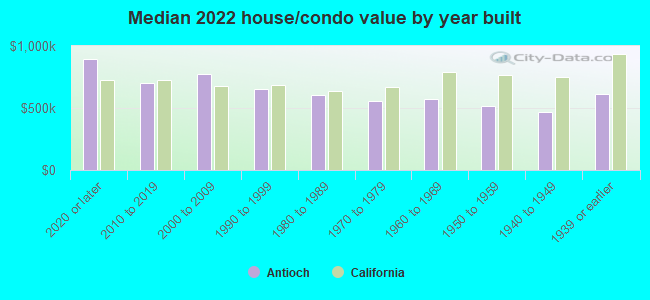
| Antioch: | $621,800 |
| California: | $715,900 |
Total population: 108,930 (Urban population: 89,092, Rural population: 1,722 (all nonfarm))
Houses: 38,701 (37,461 occupied: 23,983 owner occupied, 13,478 renter occupied)
| % of renters here: | 36% |
| State: | 44% |
Housing density: 1,436 houses/condos per square mile
Median price asked for vacant for-sale houses and condos in 2022: $223,917.
Median contract rent in 2022: $1,806 (lower quartile is $1,191, upper quartile is over $2,000)
Median rent asked for vacant for-rent units in 2022: $4,565
Median gross rent in Antioch, CA in 2022: over $2,000
Housing units in Antioch with a mortgage: 17,993 (1,842 second mortgage, 0 home equity loan, 1,463 both second mortgage and home equity loan)
Houses without a mortgage: 561
Median household income for houses/condos with a mortgage: $124,353
Median household income for apartments without a mortgage: $83,354
Median monthly housing costs: $2,176
Compare current foreclosures in Antioch, CA:
| Photo | Address | Area | Beds / Baths | Price | Details |
|---|---|---|---|---|---|

|
#1
Arthur Way
Antioch, CA 94509
|
1,595 sq. feet
|
2 baths 4 beds |
show details | |

|
#2
Hilliard Cir
Antioch, CA 94509
|
2,332 sq. feet
|
3 baths 4 beds |
show details | |

|
#3
Shetland Way
Antioch, CA 94531
|
3,249 sq. feet
|
3 baths 5 beds |
show details | |

|
#4
Nandina Ct
Antioch, CA 94531
|
1,267 sq. feet
|
2 baths 3 beds |
show details | |

|
#5
Monitor Pass Way
Antioch, CA 94531
|
1,657 sq. feet
|
2 baths 4 beds |
show details | |

|
#6
San Jose Dr Unit 228
Antioch, CA 94509
|
830 sq. feet
|
2 baths 2 beds |
show details | |

|
#7
W 15th St
Antioch, CA 94509
|
1,338 sq. feet
|
2 baths 3 beds |
show details | |

|
#8
Merrill Dr
Antioch, CA 94509
|
2,113 sq. feet
|
3 baths 3 beds |
show details | |

|
#9
S Royal Links Cir
Antioch, CA 94509
|
1,219 sq. feet
|
2 baths 3 beds |
show details | |

|
#10
Beede Way
Antioch, CA 94509
|
2,228 sq. feet
|
2 baths 2 beds |
show details |
| Photo | Address | Area | Beds / Baths | Price | Details |
|---|---|---|---|---|---|

|
#11
Pinzano Wy
Antioch, CA 94531
|
- sq. feet
|
2 baths 3 beds |
show details | |

|
#12
Yellowstone Dr
Antioch, CA 94509
|
2,128 sq. feet
|
3 baths 4 beds |
show details | |

|
#13
Crestwood Dr
Antioch, CA 94509
|
1,360 sq. feet
|
2 baths 3 beds |
show details | |

|
#14
Rockspring Way
Antioch, CA 94531
|
1,631 sq. feet
|
2 baths 4 beds |
show details | |

|
#15
Filbert St
Antioch, CA 94509
|
1,137 sq. feet
|
2 baths 3 beds |
show details | |

|
#16
Searsport Ct
Antioch, CA 94509
|
1,879 sq. feet
|
2 baths 3 beds |
show details | |

|
#17
Horseshoe Cir
Antioch, CA 94531
|
2,192 sq. feet
|
3 baths 4 beds |
show details | |

|
#18
Fuente Ct
Antioch, CA 94509
|
1,666 sq. feet
|
2 baths 4 beds |
show details | |

|
#19
Meadowbrook Rd
Antioch, CA 94509
|
1,433 sq. feet
|
2 baths 3 beds |
show details | |

|
#20
Peachtree Cir
Antioch, CA 94509
|
2,043 sq. feet
|
2 baths 4 beds |
show details |
| Photo | Address | Area | Beds / Baths | Price | Details |
|---|---|---|---|---|---|

|
#21
Canada Hills Way
Antioch, CA 94531
|
1,680 sq. feet
|
2 baths 4 beds |
show details | |

|
#22
Lipton St
Antioch, CA 94509
|
1,245 sq. feet
|
2 baths 3 beds |
show details | |

|
#23
Yorkshire Dr
Antioch, CA 94531
|
2,619 sq. feet
|
2 baths 4 beds |
show details | |

|
#24
Longhorn Ct
Antioch, CA 94531
|
2,380 sq. feet
|
3 baths 4 beds |
show details | |

|
#25
Blythe Dr
Antioch, CA 94509
|
1,488 sq. feet
|
2 baths 3 beds |
show details | |

|
#26
Vista Hills Ct
Antioch, CA 94531
|
2,181 sq. feet
|
3 baths 4 beds |
show details | |

|
#27
Osprey Dr # 3813
Antioch, CA 94509
|
2,724 sq. feet
|
3 baths 5 beds |
show details | |

|
#28
Garrow Dr
Antioch, CA 94509
|
2,180 sq. feet
|
2 baths 4 beds |
show details | |

|
#29
Morro Dr
Antioch, CA 94531
|
1,067 sq. feet
|
2 baths 3 beds |
show details | |

|
#30
Ashley Way
Antioch, CA 94509
|
1,814 sq. feet
|
2 baths 3 beds |
show details |
| Photo | Address | Area | Beds / Baths | Price | Details |
|---|---|---|---|---|---|

|
#31
Pawnee Dr
Antioch, CA 94531
|
1,382 sq. feet
|
2 baths 3 beds |
show details | |

|
#32
Daylily Ct
Antioch, CA 94531
|
2,053 sq. feet
|
2 baths 5 beds |
show details | |

|
#33
Gary Ave
Antioch, CA 94509
|
1,021 sq. feet
|
1 baths 3 beds |
show details | |

|
#34
Sunset Ln
Antioch, CA 94509
|
1,630 sq. feet
|
2 baths 3 beds |
show details | |

|
#35
Sterling Hill Dr
Antioch, CA 94531
|
1,545 sq. feet
|
2 baths 3 beds |
show details | |

|
#36
Putnam St
Antioch, CA 94509
|
1,245 sq. feet
|
2 baths 3 beds |
show details | |

|
#37
Winding Ln
Antioch, CA 94531
|
808 sq. feet
|
1 baths 2 beds |
show details | |

|
#38
Null Dr
Antioch, CA 94509
|
1,569 sq. feet
|
2 baths 4 beds |
show details | |

|
#39
Arabian Way
Antioch, CA 94531
|
2,192 sq. feet
|
3 baths 4 beds |
show details | |

|
#40
Fallow Way
Antioch, CA 94509
|
2,279 sq. feet
|
2 baths 4 beds |
show details |
| Photo | Address | Area | Beds / Baths | Price | Details |
|---|---|---|---|---|---|

|
#41
S Royal Links Cir
Antioch, CA 94509
|
1,219 sq. feet
|
2 baths 3 beds |
show details | |

|
#42
Sequoia Dr
Antioch, CA 94509
|
1,124 sq. feet
|
2 baths 3 beds |
show details | |

|
#43
Horseshoe Cir
Antioch, CA 94531
|
2,192 sq. feet
|
3 baths 4 beds |
show details | |

|
#44
Saint Frances Dr
Antioch, CA 94509
|
1,160 sq. feet
|
2 baths 3 beds |
show details | |

|
#45
Tabora Dr
Antioch, CA 94509
|
2,511 sq. feet
|
2 baths 4 beds |
show details | |

|
#46
Gentrytown Dr
Antioch, CA 94509
|
1,304 sq. feet
|
2 baths 4 beds |
show details | |

|
#47
Point Arena Ct
Antioch, CA 94531
|
1,415 sq. feet
|
2 baths 3 beds |
show details | |

|
#48
Wildflower Dr # 60
Antioch, CA 94531
|
1,831 sq. feet
|
2 baths 3 beds |
show details | |

|
#49
Asilomar Dr
Antioch, CA 94509
|
2,394 sq. feet
|
2 baths 4 beds |
show details | |

|
Check over 1 million property listings on Foreclosure.com!
|
browse all offers | |||

Latest news about housing in Antioch, CA collected exclusively by city-data.com from local newspapers, TV, and radio stations

 | California Renters Priced Out of Housing Due to Major Rent Increase (90 replies) |
| Feedback of Verona new homes in Antioch (9 replies) |
| Don’t make $235,000? Good luck buying a home in the Bay Area (106 replies) |
| SF/Bay Area Crime Thread (1410 replies) |
| Please, no more low income housing in Marin! (167 replies) |
| Safety of Antioch area? (6 replies) |
Median year apartment built: 1984
Household type by relationship:
Households: 115,268- Male householders: 15,716 (1,925 living alone), Female householders: 21,745 (4,361 living alone)
18,683 spouses (18,324 opposite-sex spouses), 3,229 unmarried partners, (3,095 opposite-sex unmarried partners), 34,016 children (32,575 natural, 174 adopted, 1,267 stepchildren), 4,949 grandchildren, 1,894 brothers or sisters, 4,469 parents, 900 foster children, 4,446 other relatives, 4,268 non-relatives
- In group quarters: 953
Size of family households: 8,314 2-persons, 8,117 3-persons, 4,200 4-persons, 5,831 5-persons, 1,770 6-persons, 713 7-or-more-persons.
Size of nonfamily households: 6,286 1-person, 2,086 2-persons, 144 5-persons.
13,943 married couples with children.
5,106 single-parent households (979 men, 4,127 women).
62.0% of residents of Antioch speak English at home.
22.6% of residents speak Spanish at home (59% speak English very well, 21% speak English well, 14% speak English not well, 6% don't speak English at all).
3.6% of residents speak other Indo-European language at home (63% speak English very well, 23% speak English well, 12% speak English not well, 2% don't speak English at all).
10.4% of residents speak Asian or Pacific Island language at home (54% speak English very well, 31% speak English well, 12% speak English not well, 4% don't speak English at all).
1.1% of residents speak other language at home (86% speak English very well, 11% speak English well, 3% speak English not well).
Foreign born population: 29,977 (26.0%)
(65.1% of them are naturalized citizens)
| Here: | 6.4 |
| State: | 6.0 |
| Here: | 4.8 |
| State: | 3.9 |
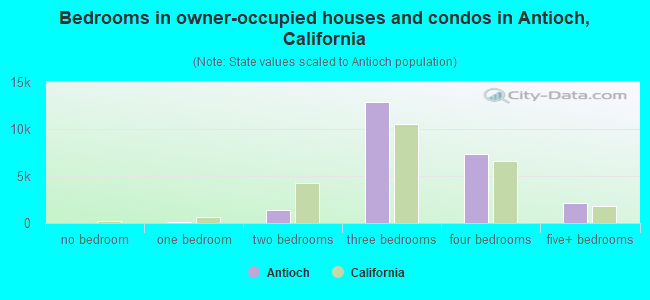
- Bedrooms in owner-occupied houses and condos in Antioch, California
- 0no bedroom
- 1241 bedroom
- 1,4362 bedrooms
- 12,8933 bedrooms
- 7,3744 bedrooms
- 2,1565+ bedrooms
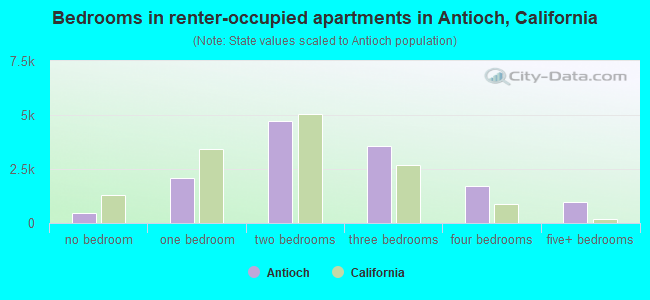
- Bedrooms in renter-occupied apartments in Antioch, California
- 448no bedroom
- 2,1061 bedroom
- 4,7062 bedrooms
- 3,5463 bedrooms
- 1,7114 bedrooms
- 9615+ bedrooms
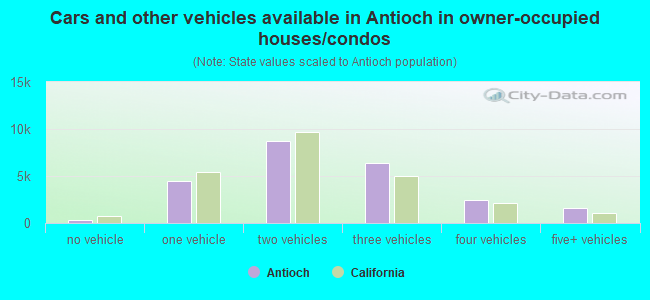
- Cars and other vehicles available in Antioch in owner-occupied houses/condos
- 271no vehicle
- 4,5031 vehicle
- 8,7652 vehicles
- 6,3983 vehicles
- 2,4244 vehicles
- 1,6225+ vehicles
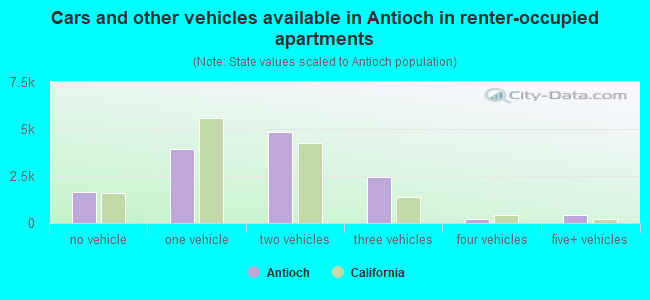
- Cars and other vehicles available in Antioch in renter-occupied apartments
- 1,634no vehicle
- 3,9161 vehicle
- 4,8562 vehicles
- 2,4373 vehicles
- 1904 vehicles
- 4455+ vehicles
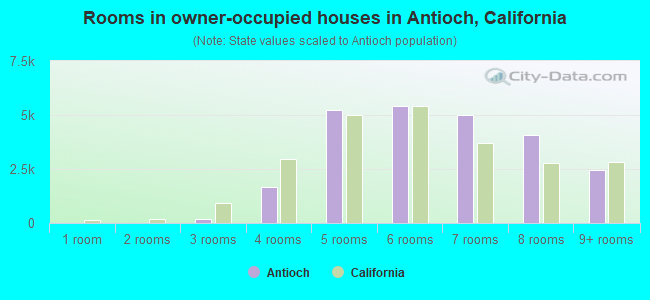
- Rooms in owner-occupied houses in Antioch, California
- 01 room
- 02 rooms
- 1943 rooms
- 1,6494 rooms
- 5,2245 rooms
- 5,4316 rooms
- 4,9797 rooms
- 4,0548 rooms
- 2,4529+ rooms
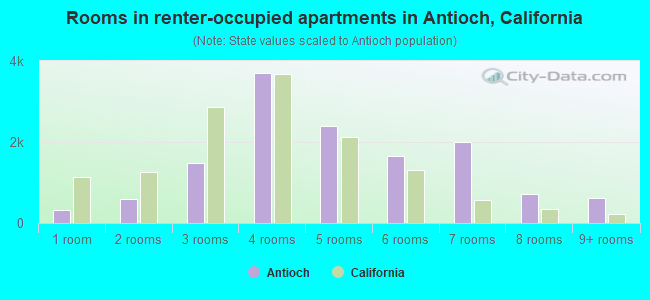
- Rooms in renter-occupied apartments in Antioch, California
- 3091 room
- 6032 rooms
- 1,4843 rooms
- 3,7014 rooms
- 2,4005 rooms
- 1,6556 rooms
- 1,9947 rooms
- 7248 rooms
- 6089+ rooms
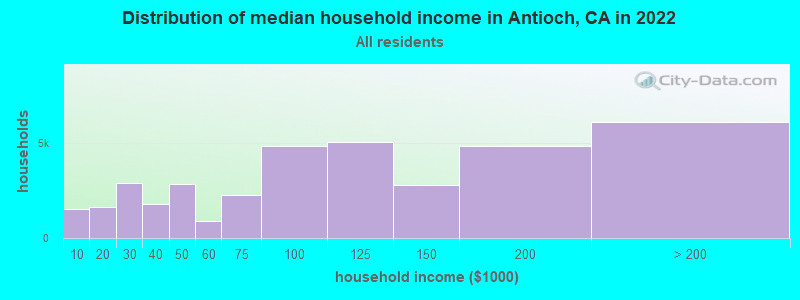
Antioch, CA household income distribution

- 1,542Less than $10,000
- 1,636$10,000 to $19,999
- 2,877$20,000 to $29,999
- 1,813$30,000 to $39,999
- 2,868$40,000 to $49,999
- 870$50,000 to $59,999
- 2,275$60,000 to $74,999
- 4,826$75,000 to $99,999
- 5,042$100,000 to $124,999
- 2,786$125,000 to $149,999
- 4,821$150,000 to $199,999
- 6,105$200,000 or more
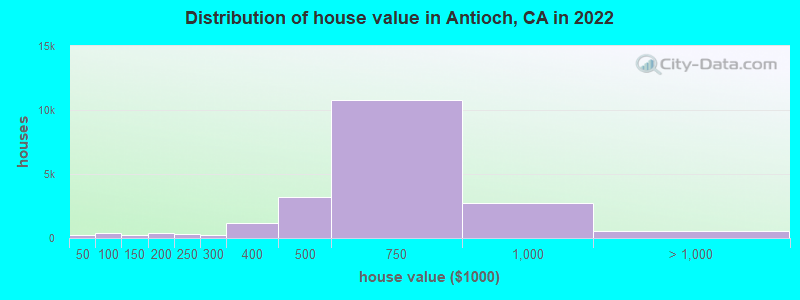
Home value of owner - occupied houses in 2022 in Antioch, CA
-
- 89Less than $10,000
- 12$10,000 to $14,999
- 9$20,000 to $24,999
- 7$25,000 to $29,999
- 45$35,000 to $39,999
- 34$40,000 to $49,999
- 92$50,000 to $59,999
- 11$60,000 to $69,999
- 196$70,000 to $79,999
- 41$80,000 to $89,999
- 30$90,000 to $99,999
- 181$100,000 to $124,999
- 20$125,000 to $149,999
- 223$150,000 to $174,999
- 200$175,000 to $199,999
- 349$200,000 to $249,999
- 258$250,000 to $299,999
- 1,137$300,000 to $399,999
- 3,169$400,000 to $499,999
- 10,818$500,000 to $749,999
- 2,766$750,000 to $999,999
- 264$1,000,000 to $1,499,999
- 31$1,500,000 to $1,999,999
- 272$2,000,000 or more
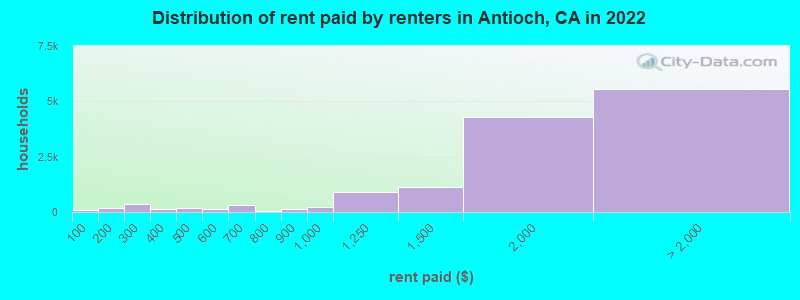
Rent paid by renters in 2022 in Antioch, CA
-
- 95Less than $100
- 62$100 to $149
- 107$150 to $199
- 141$200 to $249
- 228$250 to $299
- 42$300 to $349
- 94$350 to $399
- 104$400 to $449
- 73$450 to $499
- 88$500 to $549
- 64$550 to $599
- 278$600 to $649
- 43$650 to $699
- 51$700 to $749
- 129$800 to $899
- 236$900 to $999
- 900$1,000 to $1,249
- 1,126$1,250 to $1,499
- 4,294$1,500 to $1,999
- 2,329$2,000 to $2,499
- 2,079$2,500 to $2,999
- 465$3,000 to $3,499
- 257$3,500 or more
- 444No cash rent
Percentage of workers working in this county: 73.7%
Number of people working at home: 6,874 (12.4% of all workers)
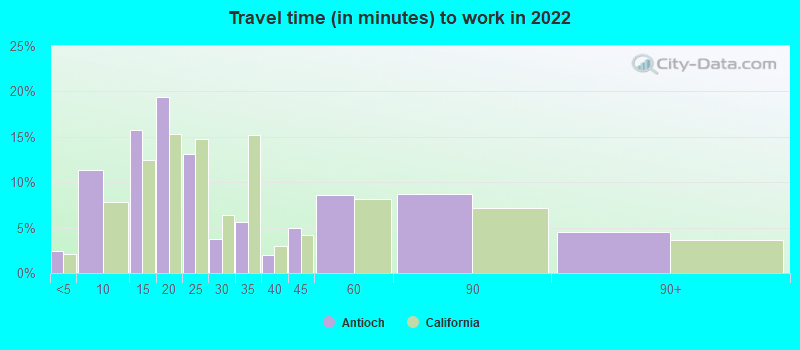
Travel time to work (commute)
- Less than 5 minutes: 619
- 5 to 9 minutes: 2,966
- 10 to 14 minutes: 6,073
- 15 to 19 minutes: 4,511
- 20 to 24 minutes: 4,787
- 25 to 29 minutes: 823
- 30 to 34 minutes: 3,906
- 35 to 39 minutes: 1,203
- 40 to 44 minutes: 1,900
- 45 to 59 minutes: 6,607
- 60 to 89 minutes: 8,549
- 90 or more minutes: 6,594
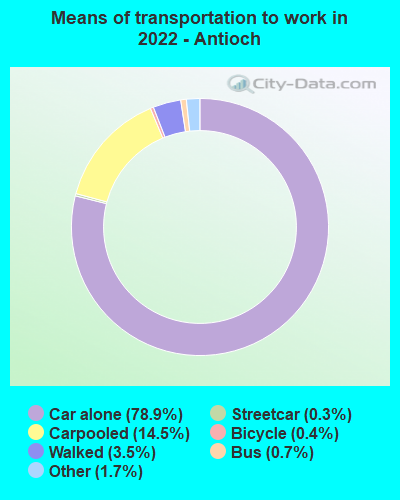
Means of transportation to work:
- Drove a car alone: 14,950 (57.0%)
- Carpooled: 3,080 (11.7%)
- Bus: 98 (0.4%)
- Subway or elevated rail: 43 (0.2%)
- Long-distance train or commuter rail: 3 (0.0%)
- Taxi: 350 (1.3%)
- Bicycle: 56 (0.2%)
- Walked: 939 (3.6%)
- Worked at home: 6,954 (26.5%)
- Unemployment by race in 2022
- Unemployment rate for White non-Hispanic residents
- 3.6%Males
- 9.2%Females
- Unemployment rate for Black residents
- 7.1%Males
- 10.2%Females
- Unemployment rate for American Indian and Alaska Native residents
- 39.9%Females
- Unemployment rate for Asian residents
- 4.3%Females
- Unemployment rate for other race residents
- 2.5%Males
- 3.7%Females
- Unemployment rate for two or more race residents
- 6.2%Males
- 7.3%Females
- Unemployment rate for Hispanic or Latino residents
- 5.0%Males
- 5.0%Females
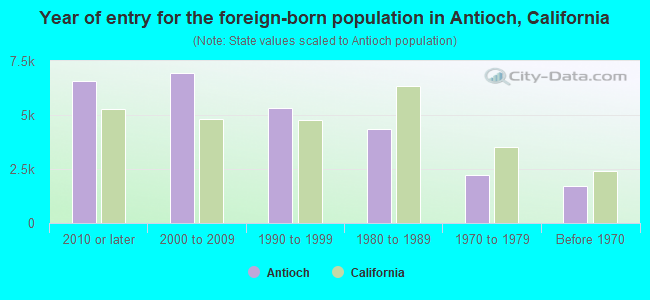
- Year of entry for the foreign-born population in Antioch, California
- 6,5692010 or later
- 6,9622000 to 2009
- 5,3181990 to 1999
- 4,3481980 to 1989
- 2,2151970 to 1979
- 1,712Before 1970
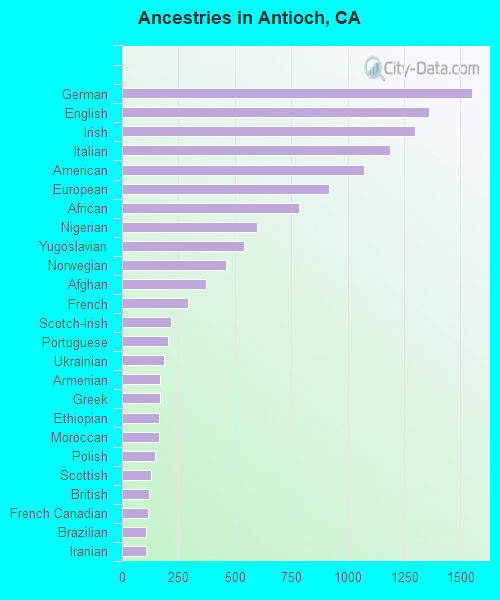
First ancestries reported:
- German: 1,549 (2.4%)
- English: 1,360 (2.1%)
- Irish: 1,299 (2.0%)
- Italian: 1,189 (1.9%)
- American: 1,072 (1.7%)
- European: 918 (1.4%)
- African: 786 (1.2%)
- Nigerian: 597 (0.9%)
- Yugoslavian: 540 (0.8%)
- Norwegian: 463 (0.7%)
- Afghan: 371 (0.6%)
- French: 293 (0.5%)
- Scotch-Irish: 217 (0.3%)
- Portuguese: 202 (0.3%)
- Ukrainian: 187 (0.3%)
- Armenian: 169 (0.3%)
- Greek: 169 (0.3%)
- Ethiopian: 164 (0.3%)
- Moroccan: 162 (0.3%)
- Polish: 145 (0.2%)
- Scottish: 128 (0.2%)
- British: 118 (0.2%)
- French Canadian: 115 (0.2%)
- Brazilian: 108 (0.2%)
- Iranian: 107 (0.2%)
- Lebanese: 98 (0.2%)
- South African: 92 (0.1%)
- Welsh: 91 (0.1%)
- Ghanaian: 87 (0.1%)
- Swedish: 72 (0.1%)
- Kenyan: 68 (0.1%)
- Belizean: 63 (0.10%)
- Eastern European: 62 (0.10%)
- Croatian: 62 (0.10%)
- Turkish: 61 (0.10%)
- Northern European: 47 (0.07%)
- Russian: 47 (0.07%)
- Dutch: 46 (0.07%)
- Scandinavian: 35 (0.05%)
- Jamaican: 35 (0.05%)
- Serbian: 26 (0.04%)
- Danish: 26 (0.04%)
- Guyanese: 18 (0.03%)
- Slovak: 18 (0.03%)
- Swiss: 17 (0.03%)
- Hungarian: 15 (0.02%)
- Finnish: 13 (0.02%)
- Assyrian: 13 (0.02%)
- Lithuanian: 12 (0.02%)
- Pennsylvania German: 12 (0.02%)
- Canadian: 9 (0.01%)
- Basque: 8 (0.01%)
- Estonian: 7 (0.01%)
- Czech: 5 (0.01%)
- Austrian: 4 (0.01%)
Most common places of birth for foreign-born residents (%):
| Antioch: | 29.8% (7,688) |
| California: | 37.2% (3,881,193) |
| Antioch: | 19.0% (4,896) |
| California: | 7.8% (818,297) |
| Antioch: | 6.1% (1,574) |
| California: | 4.9% (512,335) |
| Antioch: | 6.1% (1,570) |
| California: | 0.7% (74,025) |
| Antioch: | 6.0% (1,555) |
| California: | 4.2% (440,287) |
| Antioch: | 4.4% (1,136) |
| California: | 6.6% (684,672) |
| Antioch: | 3.9% (1,015) |
| California: | 0.5% (53,260) |
| Antioch: | 3.6% (926) |
| California: | 0.6% (58,161) |
| Antioch: | 1.6% (419) |
| California: | 5.2% (539,184) |
Place of birth for U.S.-born residents:
- This state: 72,302
- Other state: 11,486
- Northeast: 2,332
- Midwest: 2,291
- South: 4,814
- West: 2,049
89.3% of Antioch residents lived in the same house 1 years ago.
Out of people who lived in different houses, 36.7% lived in this county.
Out of people who lived in different counties, 81.5% lived in California.
| Antioch: | 89.3% |
| State average: | 88.9% |
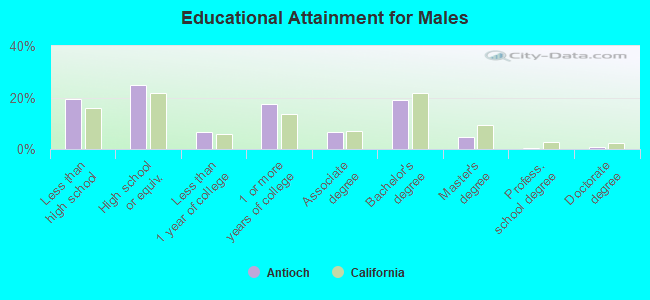
Education attainment for males 25 years and older:
- No schooling: 1,845
- Nursery to 4th grade: 660
- 5th and 6th grade: 1,107
- 7th and 8th grade: 291
- 9th grade: 364
- 10th grade: 112
- 11th grade: 827
- 12th grade, no diploma: 1,696
- High school graduate (or equivalency): 8,853
- Less than 1 year of college: 2,365
- Some college more than 1 year, no degree: 6,284
- Associate degree: 2,394
- Bachelor's degree: 6,878
- Master's degree: 1,657
- Professional school degree: 183
- Doctorate degree: 273
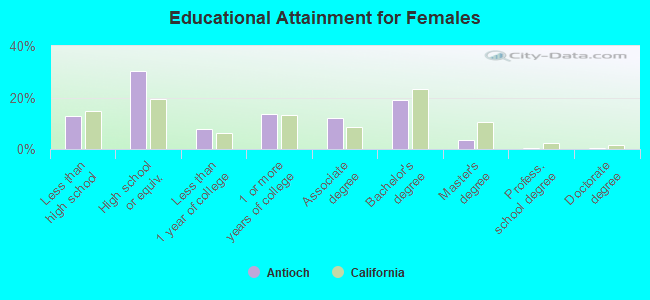
Education attainment for females 25 years and older:
- No schooling: 1,217
- Nursery to 4th grade: 464
- 5th and 6th grade: 914
- 7th and 8th grade: 158
- 9th grade: 222
- 10th grade: 69
- 11th grade: 822
- 12th grade, no diploma: 1,649
- High school graduate (or equivalency): 12,954
- Less than 1 year of college: 3,321
- Some college more than 1 year, no degree: 5,741
- Associate degree: 5,209
- Bachelor's degree: 8,185
- Master's degree: 1,467
- Professional school degree: 134
- Doctorate degree: 209
Housing units in structures:
- One, detached: 30,993
- One, attached: 1,305
- Two: 158
- 3 or 4: 1,532
- 5 to 9: 665
- 10 to 19: 905
- 20 to 49: 758
- 50 or more: 1,798
- Mobile homes: 587
Median worth of mobile homes: $80,500
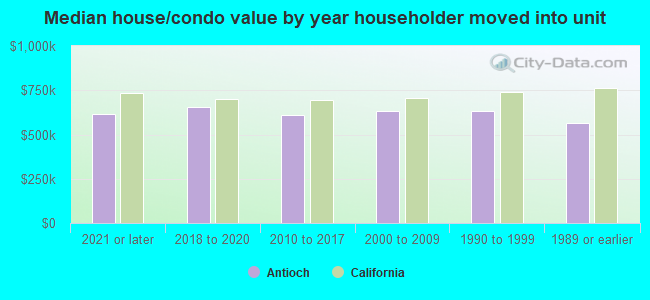
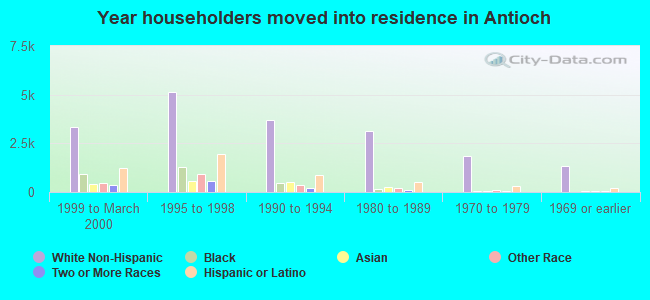
House/condo owner moved in on average 11 years ago
Renter moved in on average 3 years ago
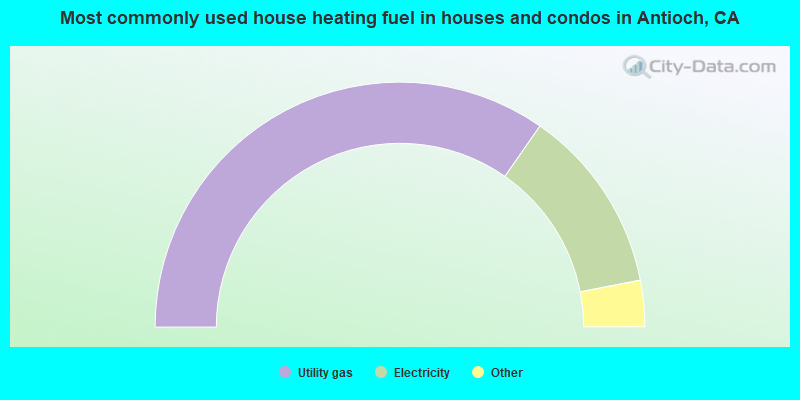
- 69.3%Utility gas
- 24.5%Electricity
- 3.5%Solar energy
- 1.4%Bottled, tank, or LP gas
- 0.5%Wood
- 0.5%No fuel used
- 0.2%Fuel oil, kerosene, etc.
- 0.1%Coal or coke
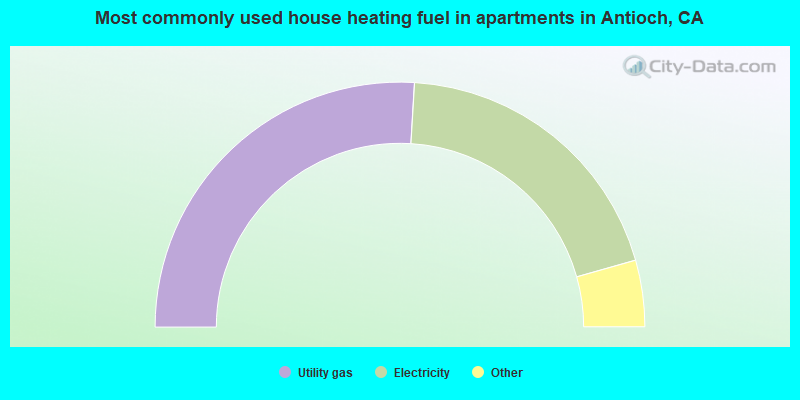
- 51.9%Utility gas
- 39.3%Electricity
- 3.7%Bottled, tank, or LP gas
- 3.6%No fuel used
- 1.4%Solar energy
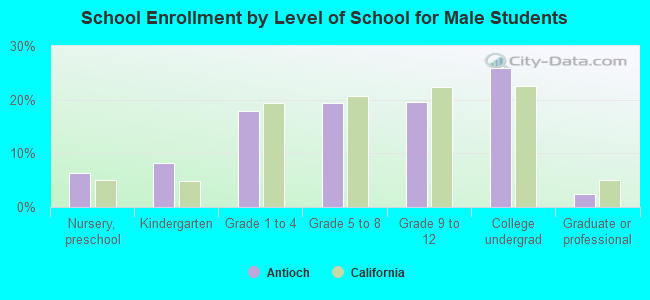
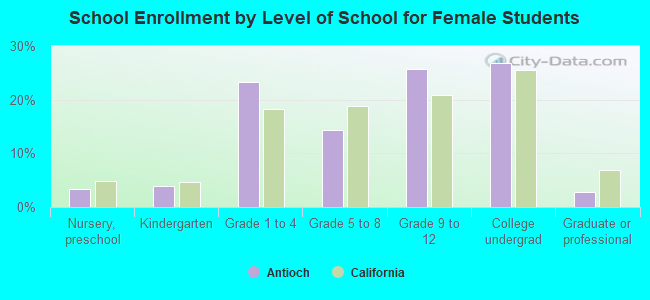
Private vs. public school enrollment:
| Here: | 9.3% |
| California: | 10.5% |
| Here: | 5.5% |
| California: | 8.5% |
| Here: | 13.0% |
| California: | 15.9% |