Housing density: 879 houses/condos per square mile
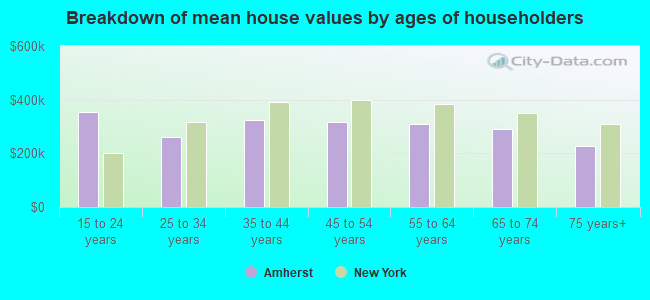
Median price asked for vacant for-sale houses and condos in 2022 in this county: $275,138.
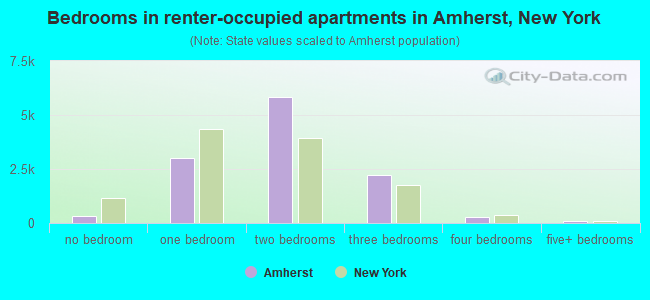
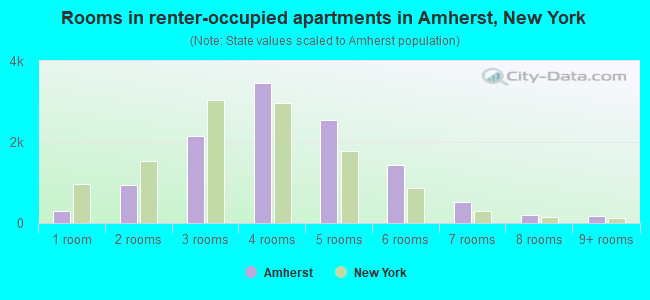
Median contract rent in 2022: $1,268 (lower quartile is $999, upper quartile is $1,613)
Median rent asked for vacant for-rent units in 2022: $1,340
Median gross rent in Amherst, NY in 2022: $1,355
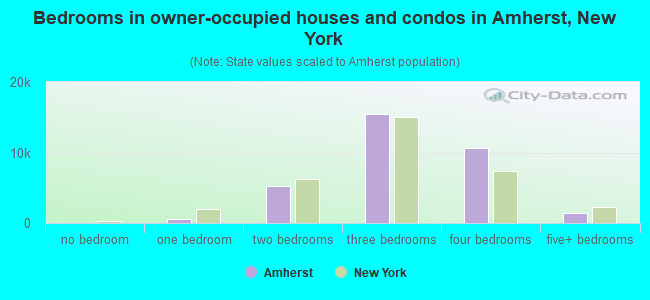
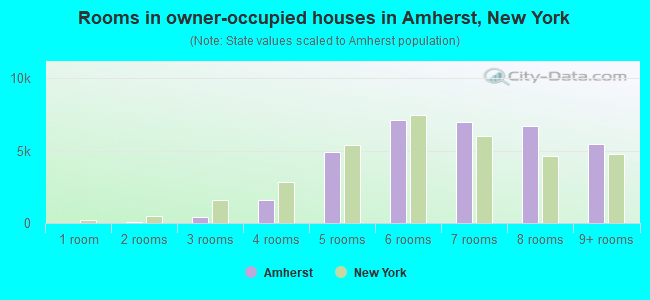
Housing units in Amherst with a mortgage: 20,877 (1,577 second mortgage, 3,948 home equity loan, 76 both second mortgage and home equity loan) Houses without a mortgage: 8,737
In family households: 703,665 (150,587 male householders, 79,422 female householders)
161,163 spouses, 259,954 children (245,472 natural, 6,125 adopted, 8,357 stepchildren), 13,651 grandchildren, 7,172 brothers or sisters, 6,060 parents, foster children, 6,352 other relatives, 16,208 non-relatives
In nonfamily households: 186,988 (69,279 male householders (54,381 living alone)), 83,876 female householders (72,187 living alone)), 33,833 nonrelatives
In group quarters: 28,387 (12,145 institutionalized population)
148,778 married couples with children.
64,240 single-parent households (9,850 men, 54,390 women).
89.1% of residents of Amherst speak English at home.
1.6% of residents speak Spanish at home (78% speak English very well, 12% speak English well, 9% speak English not well, 1% don't speak English at all).
6.0% of residents speak other Indo-European language at home (70% speak English very well, 20% speak English well, 10% speak English not well, 1% don't speak English at all).
2.7% of residents speak Asian or Pacific Island language at home (59% speak English very well, 28% speak English well, 13% speak English not well, 1% don't speak English at all).
0.6% of residents speak other language at home (72% speak English very well, 18% speak English well, 9% speak English not well, 1% don't speak English at all).
Foreign born population: 16,465 (14.1%)
(53.0% of them are naturalized citizens)
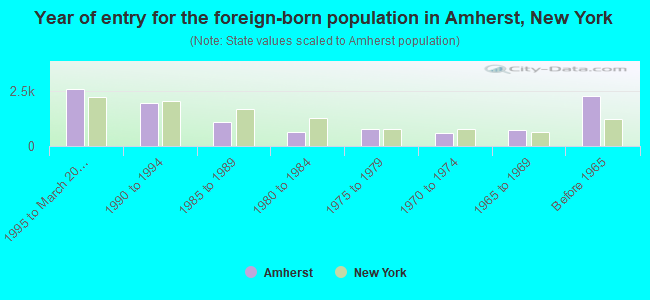
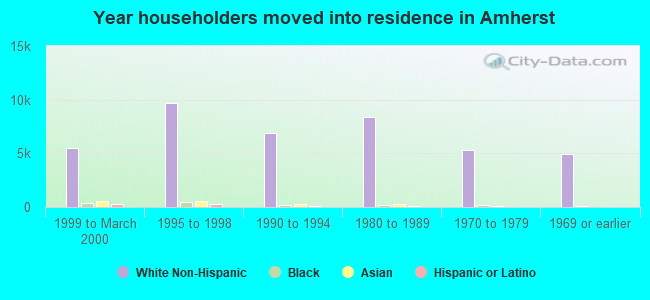
Year of entry for the foreign-born population in Amherst, New York
2,5601995 to March 2000
1,9651990 to 1994
1,0651985 to 1989
6121980 to 1984
7571975 to 1979
5781970 to 1974
7031965 to 1969
2,271Before 1965
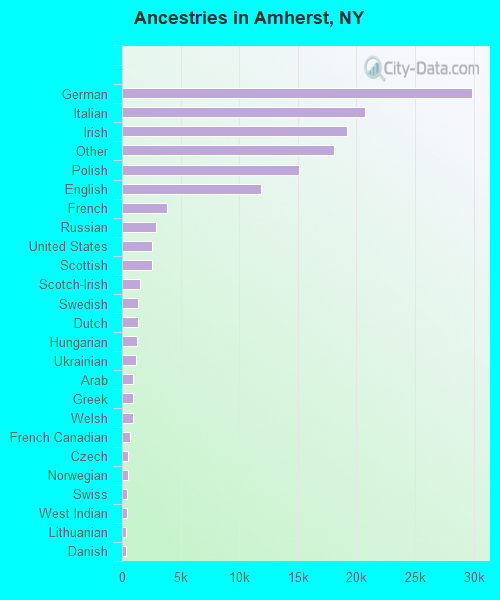
First ancestries reported:
German: 29,827 (21.3%)
Italian: 20,696 (14.8%)
Irish: 19,215 (13.7%)
Other: 18,125 (12.9%)
Polish: 15,136 (10.8%)
English: 11,843 (8.5%)
French: 3,824 (2.7%)
Russian: 2,937 (2.1%)
United States: 2,585 (1.8%)
Scottish: 2,546 (1.8%)
Scotch-Irish: 1,500 (1.1%)
Swedish: 1,399 (1.0%)
Dutch: 1,366 (1.0%)
Hungarian: 1,316 (0.9%)
Ukrainian: 1,158 (0.8%)
Arab: 959 (0.7%)
Greek: 904 (0.6%)
Welsh: 899 (0.6%)
French Canadian: 662 (0.5%)
Czech: 546 (0.4%)
Norwegian: 509 (0.4%)
Swiss: 459 (0.3%)
West Indian: 398 (0.3%)
Lithuanian: 373 (0.3%)
Danish: 343 (0.2%)
Subsaharan African: 275 (0.2%)
Slovak: 270 (0.2%)
Most common places of birth for foreign-born residents (%):
Canada
Amherst:
13.9% (1,460)
New York:
1.4% (54,876)
India
Amherst:
12.3% (1,289)
New York:
3.0% (117,238)
Italy
Amherst:
6.9% (725)
New York:
3.8% (147,729)
China, excluding Hong Kong and Taiwan
Amherst:
6.7% (707)
New York:
6.0% (233,766)
Korea
Amherst:
6.3% (660)
New York:
2.5% (97,933)
Russia
Amherst:
4.8% (505)
New York:
2.4% (94,595)
United Kingdom
Amherst:
4.6% (486)
New York:
1.6% (62,237)
Germany
Amherst:
4.0% (424)
New York:
1.8% (69,327)
Ukraine
Amherst:
3.2% (340)
New York:
2.1% (82,238)
Taiwan
Amherst:
2.8% (295)
New York:
0.8% (30,473)
Other Eastern Europe
Amherst:
2.4% (254)
New York:
1.4% (53,825)
Pakistan
Amherst:
1.9% (204)
New York:
1.3% (51,055)
Poland
Amherst:
1.6% (168)
New York:
2.4% (93,187)
Japan
Amherst:
1.6% (163)
New York:
0.8% (32,034)
Place of birth for U.S.-born residents:
This state: 86,613
Other state: 18,474
Northeast: 5,651
Midwest: 6,280
South: 5,089
West: 1,454
62% of Amherst residents lived in the same house 5 years ago. Out of people who lived in different houses, 64% lived in this county. Out of people who lived in different counties, 52% lived in New York.
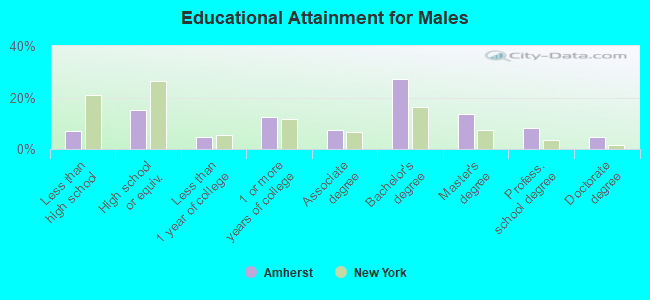
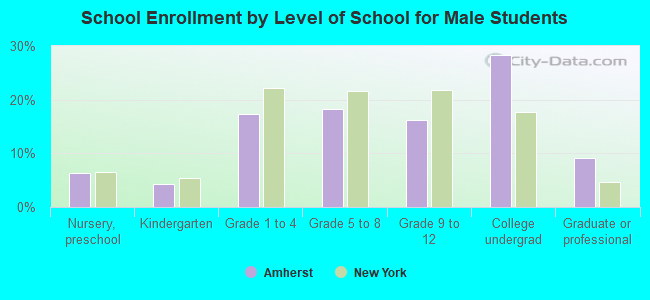
Education attainment for males 25 years and older:
No schooling: 151
Nursery to 4th grade: 60
5th and 6th grade: 175
7th and 8th grade: 500
9th grade: 246
10th grade: 338
11th grade: 314
12th grade, no diploma: 657
High school graduate (or equivalency): 5,350
Less than 1 year of college: 1,611
Some college more than 1 year, no degree: 4,388
Associate degree: 2,557
Bachelor's degree: 9,623
Master's degree: 4,809
Professional school degree: 2,927
Doctorate degree: 1,604
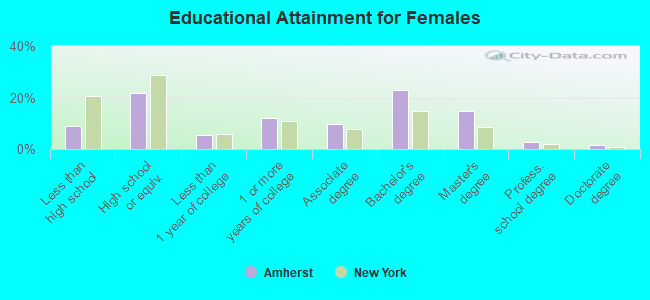
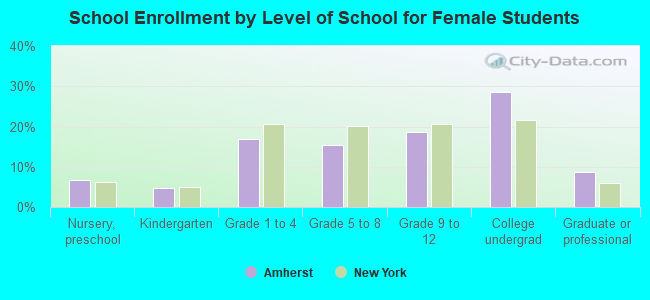
Education attainment for females 25 years and older:
No schooling: 204
Nursery to 4th grade: 63
5th and 6th grade: 161
7th and 8th grade: 904
9th grade: 426
10th grade: 619
11th grade: 573
12th grade, no diploma: 936
High school graduate (or equivalency): 9,290
Less than 1 year of college: 2,342
Some college more than 1 year, no degree: 5,253
Associate degree: 4,124
Bachelor's degree: 9,799
Master's degree: 6,421
Professional school degree: 1,214
Doctorate degree: 750
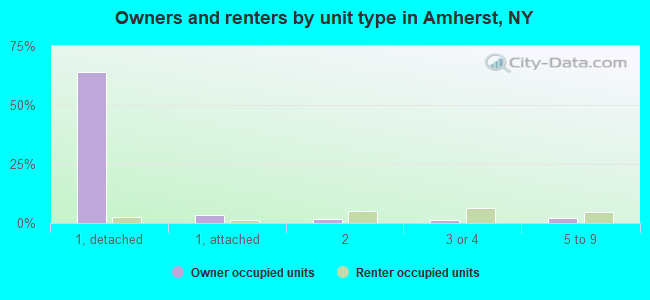
Housing units in structures:
One, detached: 30,684
One, attached: 2,300
Two: 3,381
3 or 4: 3,588
5 to 9: 3,242
10 to 19: 1,189
20 to 49: 589
50 or more: 1,774
Mobile homes: 46
Boats, RVs, vans, etc.: 10
Median worth of mobile homes: $194,687
Housing units lacking complete plumbing facilities: 0.2%
Housing units lacking complete kitchen facilities: 0.4%