American Fork, UT (Utah) Houses and Residents
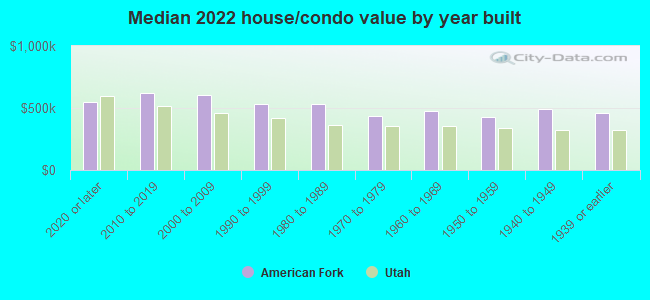
| American Fork: | $503,435 |
| Utah: | $499,500 |
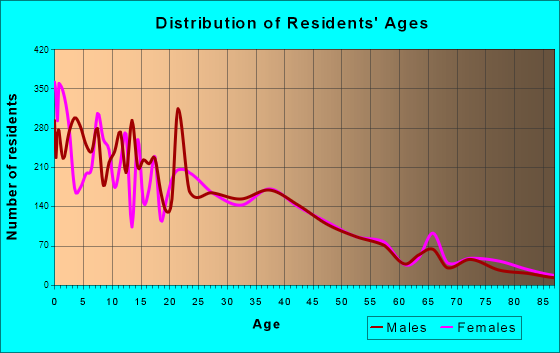
Total population: 28,152 (Urban population: 21,917, Rural population: 8 (all nonfarm))
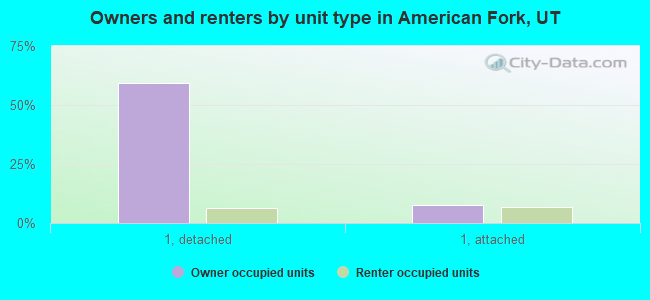
Houses: 11,596 (11,153 occupied: 7,964 owner occupied, 3,212 renter occupied)
| % of renters here: | 29% |
| State: | 29% |
Housing density: 1,538 houses/condos per square mile
Median price asked for vacant for-sale houses and condos in 2022: $1,862,293.
Median contract rent in 2022: $1,469 (lower quartile is $1,124, upper quartile is $1,958)
Median rent asked for vacant for-rent units in 2022: $1,832
Median gross rent in American Fork, UT in 2022: $1,644
Housing units in American Fork with a mortgage: 5,454 (726 second mortgage, 15 home equity loan, 648 both second mortgage and home equity loan)
Houses without a mortgage: 198
Median household income for houses/condos with a mortgage: $121,087
Median household income for apartments without a mortgage: $74,289
Median monthly housing costs: $1,560
Compare current foreclosures in American Fork, UT:
| Photo | Address | Area | Beds / Baths | Price | Details |
|---|---|---|---|---|---|

|
#1
Washington Ave
American Fork, UT 84003
|
1,112 sq. feet
|
1 baths 3 beds |
show details | |

|
#2
W 9770 N
American Fork, UT 84003
|
1,983 sq. feet
|
4 baths 5 beds |
show details | |

|
#3
E 420 N
American Fork, UT 84003
|
2,034 sq. feet
|
4 baths 4 beds |
show details | |

|
#4
N 30 W
American Fork, UT 84003
|
1,935 sq. feet
|
1 baths 4 beds |
show details | |

|
#5
N 560 W
American Fork, UT 84003
|
1,193 sq. feet
|
2 baths 3 beds |
show details | |

|
#6
N 630 E
American Fork, UT 84003
|
1,843 sq. feet
|
2 baths 3 beds |
show details | |

|
#7
W 1080 N
American Fork, UT 84003
|
1,506 sq. feet
|
2 baths 3 beds |
show details | |

|
#8
N 850 E
American Fork, UT 84003
|
2,376 sq. feet
|
3 baths 5 beds |
show details | |

|
#9
N 800 E
American Fork, UT 84003
|
1,492 sq. feet
|
2 baths 3 beds |
show details | |

|
#10
Apollo Way
American Fork, UT 84003
|
2,120 sq. feet
|
2 baths 3 beds |
show details |
| Photo | Address | Area | Beds / Baths | Price | Details |
|---|---|---|---|---|---|

|
#11
N 980 E
American Fork, UT 84003
|
1,616 sq. feet
|
2 baths 4 beds |
show details | |

|
#12
W 10180 N
American Fork, UT 84003
|
2,478 sq. feet
|
2 baths 3 beds |
show details | |

|
#13
N 570 W
American Fork, UT 84003
|
1,325 sq. feet
|
2 baths 3 beds |
show details | |

|
#14
W 500 N
American Fork, UT 84003
|
1,047 sq. feet
|
1 baths 2 beds |
show details | |

|
#15
W 200 S, Apt 7102
American Fork, UT 84003
|
- sq. feet
|
- baths - beds |
show details | |

|
#16
S 500 E # E305
American Fork, UT 84003
|
- sq. feet
|
- baths - beds |
show details | |

|
#17
S 830 E, Unit A
American Fork, UT 84003
|
- sq. feet
|
- baths - beds |
show details | |

|
#18
S 900 W
American Fork, UT 84003
|
- sq. feet
|
- baths - beds |
show details | |

|
#19
S 620 E, Apt 1101
American Fork, UT 84003
|
- sq. feet
|
- baths - beds |
show details | |

|
#20
N Angels Gate
American Fork, UT 84003
|
- sq. feet
|
- baths - beds |
show details |
| Photo | Address | Area | Beds / Baths | Price | Details |
|---|---|---|---|---|---|

|
#21
E 100 S
American Fork, UT 84003
|
- sq. feet
|
- baths - beds |
show details | |

|
#22
E 400 S
American Fork, UT 84003
|
- sq. feet
|
- baths - beds |
show details | |

|
#23
S 860 E # C117
American Fork, UT 84003
|
- sq. feet
|
- baths - beds |
show details | |

|
#24
S 250 W
American Fork, UT 84003
|
- sq. feet
|
- baths - beds |
show details | |

|
#25
E 460 S
American Fork, UT 84003
|
- sq. feet
|
- baths - beds |
show details | |

|
#26
East Ln # 680
American Fork, UT 84003
|
- sq. feet
|
- baths - beds |
show details | |

|
#27
S 930 E
American Fork, UT 84003
|
- sq. feet
|
- baths - beds |
show details | |

|
#28
S 600 E
American Fork, UT 84003
|
- sq. feet
|
- baths - beds |
show details | |

|
#29
S 860 E # A117
American Fork, UT 84003
|
- sq. feet
|
- baths - beds |
show details | |

|
#30
S 750 E
American Fork, UT 84003
|
- sq. feet
|
- baths - beds |
show details |
| Photo | Address | Area | Beds / Baths | Price | Details |
|---|---|---|---|---|---|

|
#31
E 500 S, Unit B
American Fork, UT 84003
|
- sq. feet
|
- baths - beds |
show details | |

|
#32
S 650 E
American Fork, UT 84003
|
- sq. feet
|
- baths - beds |
show details | |

|
#33
S 50 West Cir
American Fork, UT 84003
|
- sq. feet
|
- baths - beds |
show details | |

|
#34
W Green Spring Way
American Fork, UT 84003
|
- sq. feet
|
- baths - beds |
show details | |

|
#35
W Park Cir
American Fork, UT 84003
|
- sq. feet
|
- baths - beds |
show details | |

|
#36
S 860 E # E206
American Fork, UT 84003
|
- sq. feet
|
- baths - beds |
show details | |

|
#37
S 330 W
American Fork, UT 84003
|
- sq. feet
|
- baths - beds |
show details | |

|
#38
S 850 E, Unit 304
American Fork, UT 84003
|
- sq. feet
|
- baths - beds |
show details | |

|
#39
W 300 N
American Fork, UT 84003
|
- sq. feet
|
- baths - beds |
show details | |

|
#40
N 400 W Apt B
American Fork, UT 84003
|
- sq. feet
|
- baths - beds |
show details |
| Photo | Address | Area | Beds / Baths | Price | Details |
|---|---|---|---|---|---|

|
#41
W Turin Ln
American Fork, UT 84003
|
- sq. feet
|
- baths - beds |
show details | |

|
#42
E 340 S
American Fork, UT 84003
|
- sq. feet
|
- baths - beds |
show details | |

|
#43
W 540 S
American Fork, UT 84003
|
- sq. feet
|
- baths - beds |
show details | |

|
#44
W 720 S
American Fork, UT 84003
|
- sq. feet
|
- baths - beds |
show details | |

|
#45
Riverbirch Cir
American Fork, UT 84003
|
- sq. feet
|
- baths - beds |
show details | |

|
#46
N 700 E, Apt 4
American Fork, UT 84003
|
- sq. feet
|
- baths - beds |
show details | |

|
#47
N 1280 E
American Fork, UT 84003
|
- sq. feet
|
- baths - beds |
show details | |

|
Check over 1 million property listings on Foreclosure.com!
|
browse all offers | |||


 | Ogden vs American Fork (4 replies) |
| U of U transfer student seeking advice (3 replies) |
| Daughter at Snow need to get her car to American Fork (5 replies) |
| Inversion Cap Elevation? (40 replies) |
| Input re: recreational subdivisions east of Spanish Fork (1 reply) |
| Moving from Houston to Utah (10 replies) |
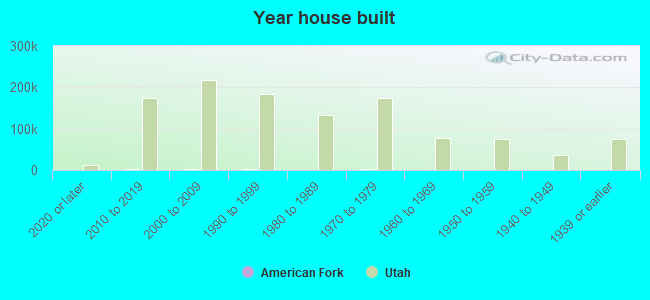
Median year apartment built: 1996
Household type by relationship:
Households: 35,844- Male householders: 5,854 (652 living alone), Female householders: 4,945 (799 living alone)
7,603 spouses (7,578 opposite-sex spouses), 354 unmarried partners, (338 opposite-sex unmarried partners), 13,150 children (12,625 natural, 169 adopted, 355 stepchildren), 423 grandchildren, 539 brothers or sisters, 295 parents, 37 foster children, 894 other relatives, 1,242 non-relatives
- In group quarters: 502
Size of family households: 3,173 2-persons, 1,948 3-persons, 1,712 4-persons, 1,164 5-persons, 721 6-persons, 442 7-or-more-persons.
Size of nonfamily households: 1,560 1-person, 196 2-persons, 134 3-persons, 8 4-persons, 17 5-persons, 107 6-persons.
8,965 married couples with children.
878 single-parent households (222 men, 656 women).
88.9% of residents of American Fork speak English at home.
7.8% of residents speak Spanish at home (52% speak English very well, 32% speak English well, 10% speak English not well, 6% don't speak English at all).
1.6% of residents speak other Indo-European language at home (81% speak English very well, 15% speak English well, 4% speak English not well).
2.0% of residents speak Asian or Pacific Island language at home (77% speak English very well, 14% speak English well, 7% speak English not well, 2% don't speak English at all).
Foreign born population: 2,353 (6.6%)
(46.8% of them are naturalized citizens)
| Here: | 8.3 |
| State: | 7.6 |
| Here: | 4.8 |
| State: | 4.3 |
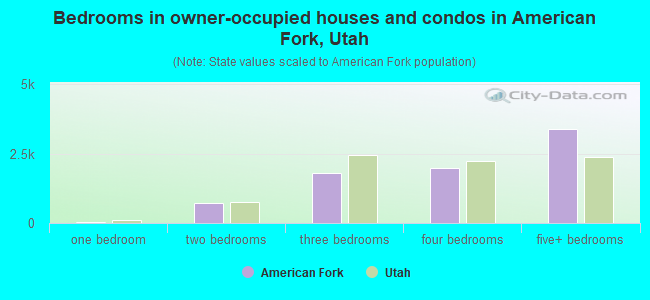
- Bedrooms in owner-occupied houses and condos in American Fork, Utah
- 14no bedroom
- 361 bedroom
- 7292 bedrooms
- 1,8223 bedrooms
- 1,9714 bedrooms
- 3,3925+ bedrooms
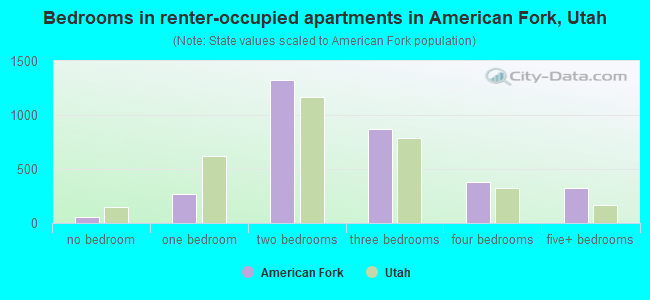
- Bedrooms in renter-occupied apartments in American Fork, Utah
- 53no bedroom
- 2701 bedroom
- 1,3222 bedrooms
- 8683 bedrooms
- 3794 bedrooms
- 3215+ bedrooms
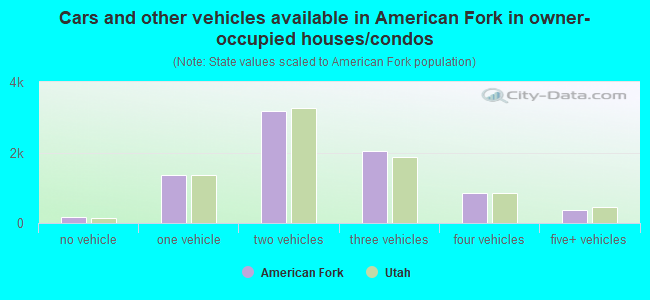
- Cars and other vehicles available in American Fork in owner-occupied houses/condos
- 165no vehicle
- 1,3581 vehicle
- 3,1872 vehicles
- 2,0493 vehicles
- 8384 vehicles
- 3685+ vehicles
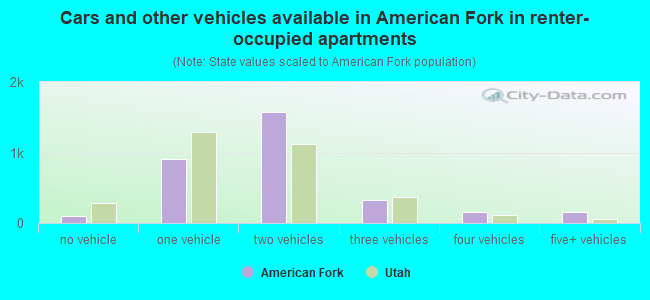
- Cars and other vehicles available in American Fork in renter-occupied apartments
- 106no vehicle
- 9091 vehicle
- 1,5692 vehicles
- 3253 vehicles
- 1504 vehicles
- 1535+ vehicles
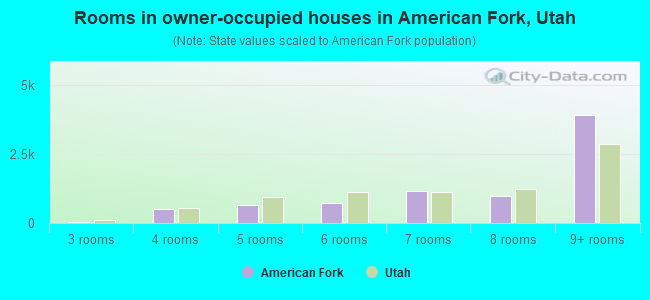
- Rooms in owner-occupied houses in American Fork, Utah
- 01 room
- 02 rooms
- 503 rooms
- 4914 rooms
- 6445 rooms
- 7336 rooms
- 1,1547 rooms
- 9898 rooms
- 3,9039+ rooms
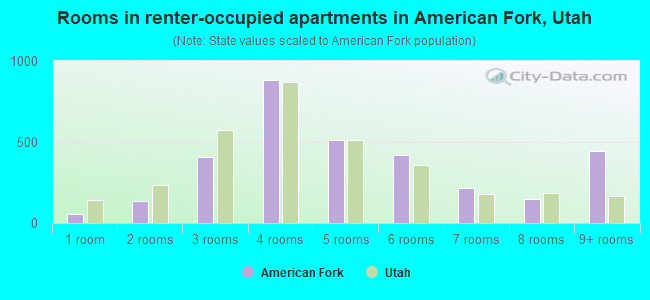
- Rooms in renter-occupied apartments in American Fork, Utah
- 531 room
- 1362 rooms
- 4063 rooms
- 8814 rooms
- 5115 rooms
- 4176 rooms
- 2197 rooms
- 1468 rooms
- 4429+ rooms
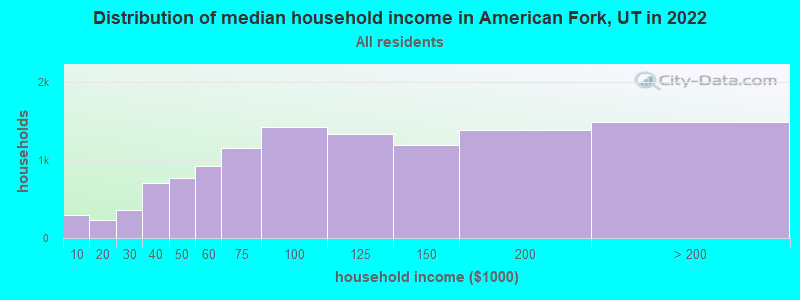
American Fork, UT household income distribution

- 292Less than $10,000
- 235$10,000 to $19,999
- 358$20,000 to $29,999
- 709$30,000 to $39,999
- 765$40,000 to $49,999
- 916$50,000 to $59,999
- 1,145$60,000 to $74,999
- 1,414$75,000 to $99,999
- 1,331$100,000 to $124,999
- 1,195$125,000 to $149,999
- 1,387$150,000 to $199,999
- 1,484$200,000 or more
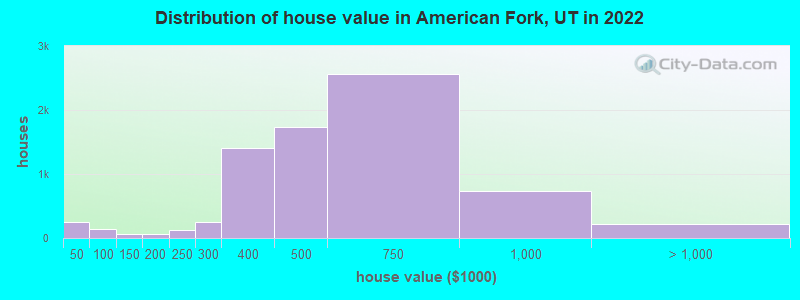
Home value of owner - occupied houses in 2022 in American Fork, UT
-
- 108Less than $10,000
- 42$20,000 to $24,999
- 47$25,000 to $29,999
- 14$30,000 to $34,999
- 39$40,000 to $49,999
- 5$50,000 to $59,999
- 8$60,000 to $69,999
- 8$70,000 to $79,999
- 56$80,000 to $89,999
- 13$90,000 to $99,999
- 9$100,000 to $124,999
- 51$125,000 to $149,999
- 30$150,000 to $174,999
- 29$175,000 to $199,999
- 125$200,000 to $249,999
- 244$250,000 to $299,999
- 1,413$300,000 to $399,999
- 1,729$400,000 to $499,999
- 2,559$500,000 to $749,999
- 736$750,000 to $999,999
- 137$1,000,000 to $1,499,999
- 18$1,500,000 to $1,999,999
- 60$2,000,000 or more
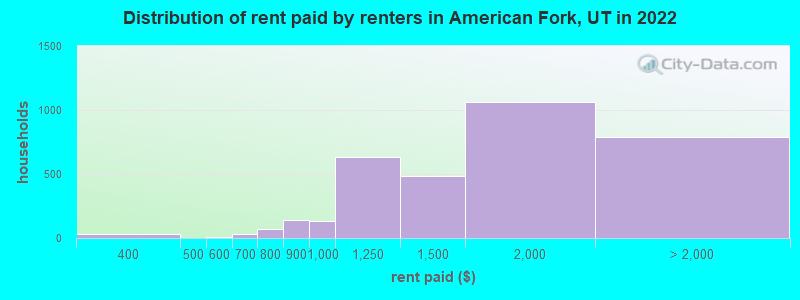
Rent paid by renters in 2022 in American Fork, UT
-
- 16$300 to $349
- 14$350 to $399
- 7$550 to $599
- 16$600 to $649
- 14$650 to $699
- 10$700 to $749
- 59$750 to $799
- 140$800 to $899
- 136$900 to $999
- 633$1,000 to $1,249
- 483$1,250 to $1,499
- 1,064$1,500 to $1,999
- 618$2,000 to $2,499
- 8$3,000 to $3,499
- 160No cash rent
Percentage of workers working in this county: 83.1%
Number of people working at home: 3,684 (20.5% of all workers)
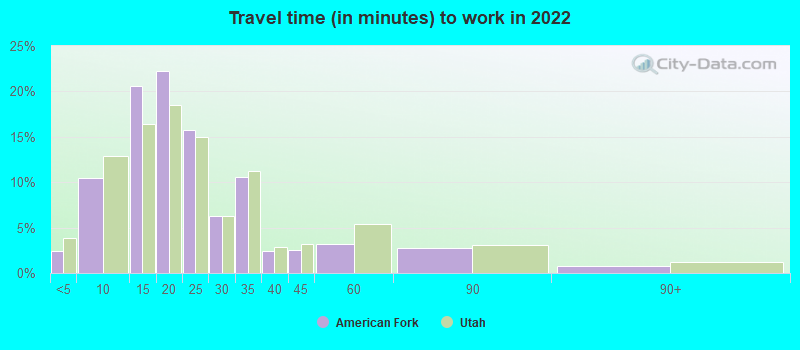
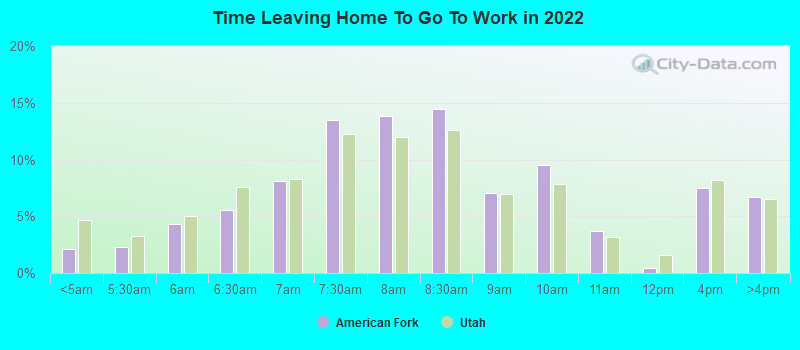
Travel time to work (commute)
- Less than 5 minutes: 518
- 5 to 9 minutes: 2,190
- 10 to 14 minutes: 2,724
- 15 to 19 minutes: 2,651
- 20 to 24 minutes: 1,790
- 25 to 29 minutes: 679
- 30 to 34 minutes: 1,464
- 35 to 39 minutes: 521
- 40 to 44 minutes: 436
- 45 to 59 minutes: 805
- 60 to 89 minutes: 350
- 90 or more minutes: 166
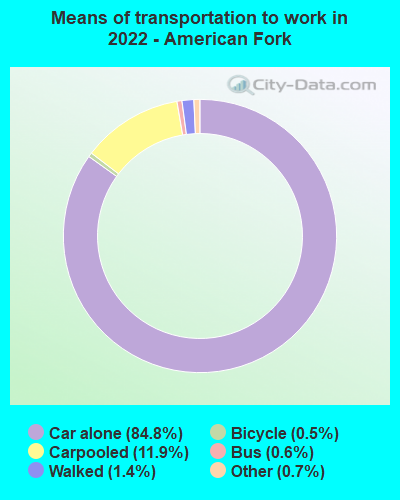
Means of transportation to work:
- Drove a car alone: 18,268 (72.0%)
- Carpooled: 2,528 (10.0%)
- Bus: 138 (0.5%)
- Long-distance train or commuter rail: 6 (0.0%)
- Taxi: 163 (0.6%)
- Bicycle: 127 (0.5%)
- Walked: 227 (0.9%)
- Worked at home: 3,684 (14.5%)
- Unemployment by race in 2022
- Unemployment rate for White non-Hispanic residents
- 2.2%Males
- 3.5%Females
- Unemployment rate for Asian residents
- 2.3%Females
- Unemployment rate for other race residents
- 9.2%Males
- Unemployment rate for two or more race residents
- 2.6%Females
- Unemployment rate for Hispanic or Latino residents
- 4.9%Males
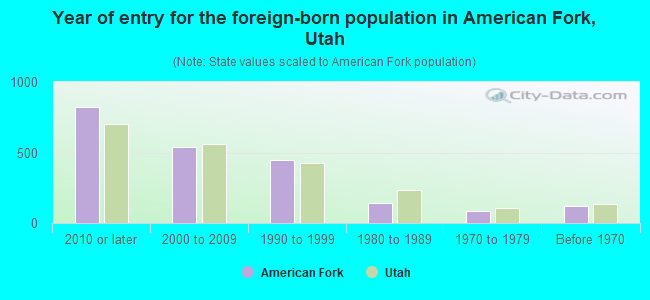
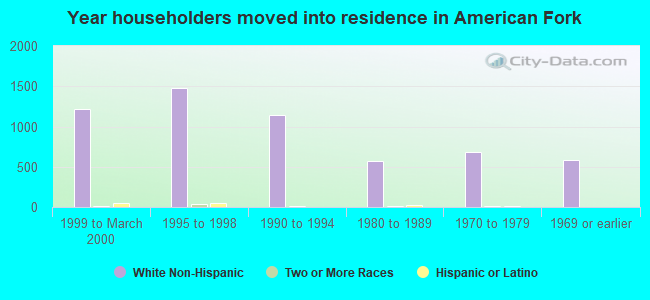
- Year of entry for the foreign-born population in American Fork, Utah
- 8262010 or later
- 5402000 to 2009
- 4451990 to 1999
- 1441980 to 1989
- 871970 to 1979
- 123Before 1970
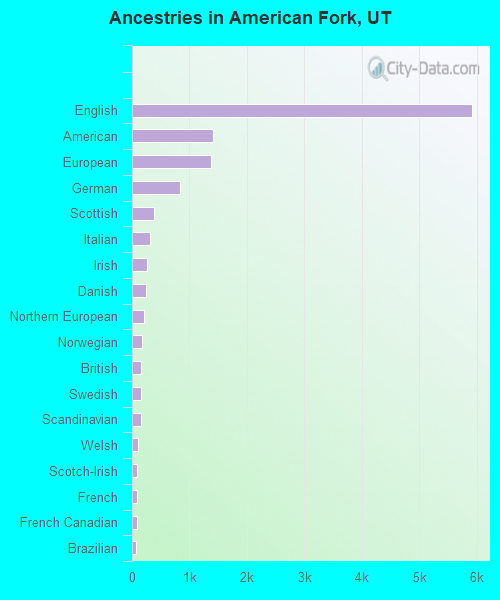
First ancestries reported:
- English: 5,920 (37.5%)
- American: 1,414 (9.0%)
- European: 1,371 (8.7%)
- German: 841 (5.3%)
- Scottish: 390 (2.5%)
- Italian: 319 (2.0%)
- Irish: 260 (1.6%)
- Danish: 244 (1.5%)
- Northern European: 214 (1.4%)
- Norwegian: 172 (1.1%)
- British: 154 (1.0%)
- Swedish: 154 (1.0%)
- Scandinavian: 153 (1.0%)
- Welsh: 100 (0.6%)
- Scotch-Irish: 94 (0.6%)
- French: 85 (0.5%)
- French Canadian: 81 (0.5%)
- Brazilian: 66 (0.4%)
- Canadian: 52 (0.3%)
- Polish: 44 (0.3%)
- Dutch: 38 (0.2%)
- Swiss: 19 (0.1%)
- Basque: 15 (0.09%)
- Belgian: 12 (0.08%)
- Portuguese: 11 (0.07%)
- Croatian: 8 (0.05%)
- Icelander: 7 (0.04%)
- Russian: 7 (0.04%)
- Hungarian: 5 (0.03%)
Most common places of birth for foreign-born residents (%):
| American Fork: | 36.0% (787) |
| Utah: | 36.1% (99,740) |
| American Fork: | 10.0% (218) |
| Utah: | 2.1% (5,902) |
| American Fork: | 5.7% (125) |
| Utah: | 2.8% (7,644) |
| American Fork: | 5.1% (111) |
| Utah: | 1.3% (3,479) |
| American Fork: | 5.0% (110) |
| Utah: | 0.5% (1,315) |
| American Fork: | 4.9% (106) |
| Utah: | 3.0% (8,294) |
| American Fork: | 4.0% (88) |
| Utah: | 2.0% (5,555) |
| American Fork: | 3.3% (72) |
| Utah: | 2.9% (8,017) |
| American Fork: | 3.2% (70) |
| Utah: | 3.0% (8,341) |
| American Fork: | 2.7% (58) |
| Utah: | 0.5% (1,269) |
| American Fork: | 2.3% (51) |
| Utah: | 2.9% (7,901) |
| American Fork: | 1.8% (40) |
| Utah: | 0.1% (351) |
| American Fork: | 1.6% (36) |
| Utah: | 3.2% (8,804) |
| American Fork: | 1.6% (35) |
| Utah: | 0.7% (1,957) |
Place of birth for U.S.-born residents:
- This state: 23,459
- Other state: 9,865
- Northeast: 709
- Midwest: 1,572
- South: 1,251
- West: 6,333
86.1% of American Fork residents lived in the same house 1 years ago.
Out of people who lived in different houses, 38.4% lived in this county.
Out of people who lived in different counties, 69.2% lived in Utah.
| American Fork: | 86.1% |
| State average: | 85.7% |
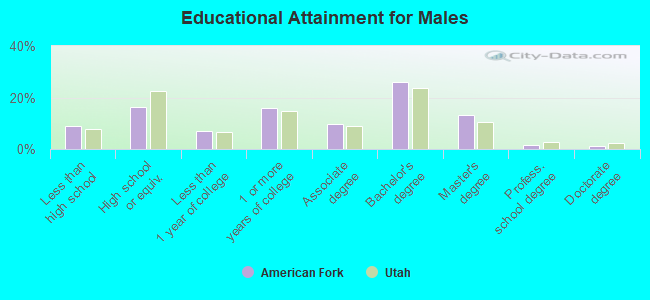
Education attainment for males 25 years and older:
- No schooling: 225
- Nursery to 4th grade: 0
- 5th and 6th grade: 69
- 7th and 8th grade: 63
- 9th grade: 16
- 10th grade: 58
- 11th grade: 228
- 12th grade, no diploma: 298
- High school graduate (or equivalency): 1,741
- Less than 1 year of college: 757
- Some college more than 1 year, no degree: 1,704
- Associate degree: 1,045
- Bachelor's degree: 2,771
- Master's degree: 1,429
- Professional school degree: 186
- Doctorate degree: 106
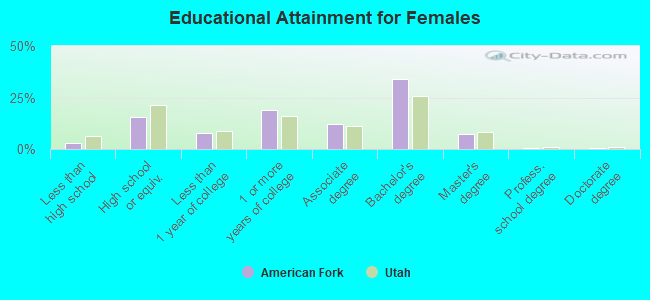
Education attainment for females 25 years and older:
- No schooling: 61
- Nursery to 4th grade: 0
- 5th and 6th grade: 2
- 7th and 8th grade: 23
- 9th grade: 13
- 10th grade: 23
- 11th grade: 68
- 12th grade, no diploma: 126
- High school graduate (or equivalency): 1,560
- Less than 1 year of college: 780
- Some college more than 1 year, no degree: 1,942
- Associate degree: 1,238
- Bachelor's degree: 3,447
- Master's degree: 735
- Professional school degree: 58
- Doctorate degree: 72
Housing units in structures:
- One, detached: 7,716
- One, attached: 1,473
- Two: 444
- 3 or 4: 302
- 5 to 9: 421
- 10 to 19: 526
- 20 to 49: 270
- 50 or more: 179
- Mobile homes: 222
- Boats, RVs, vans, etc.: 39
Housing units lacking complete kitchen facilities in 2022: 0.9%
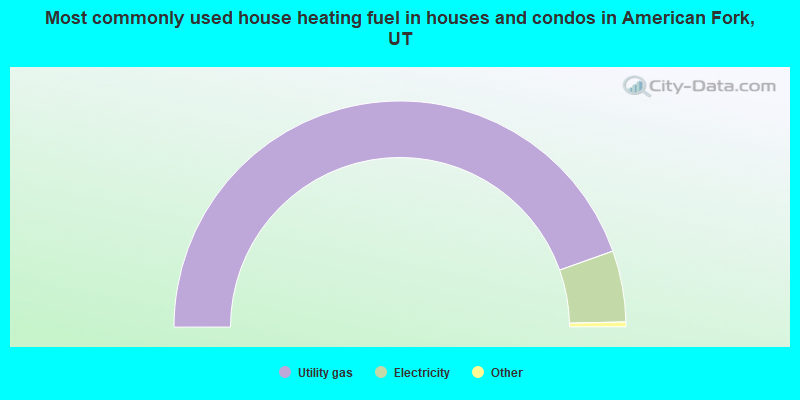
- 89.1%Utility gas
- 10.2%Electricity
- 0.3%Bottled, tank, or LP gas
- 0.2%Solar energy
- 0.1%Wood
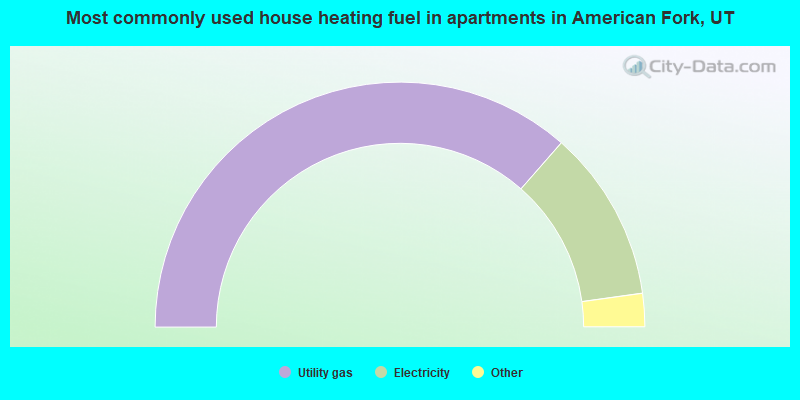
- 73.0%Utility gas
- 22.7%Electricity
- 2.2%Bottled, tank, or LP gas
- 1.7%Other fuel
- 0.4%No fuel used
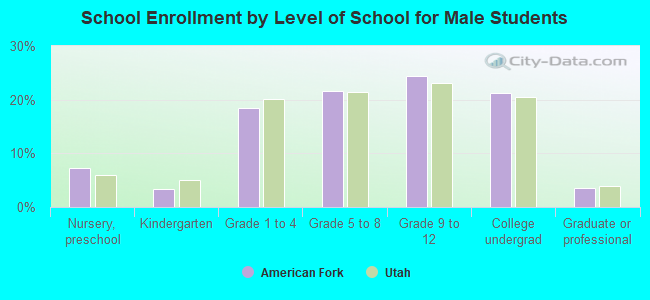
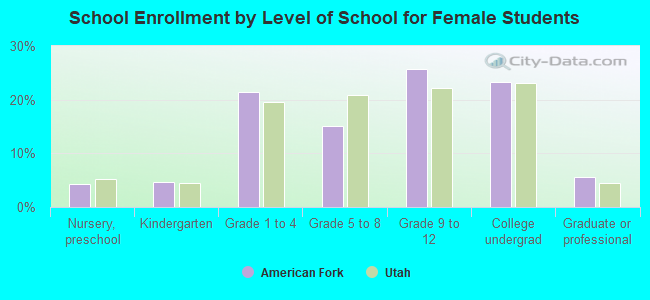
Private vs. public school enrollment:
| Here: | 11.9% |
| Utah: | 7.2% |
| Here: | 9.7% |
| Utah: | 5.3% |
| Here: | 19.2% |
| Utah: | 26.7% |