Housing density: 1,459 houses/condos per square mile
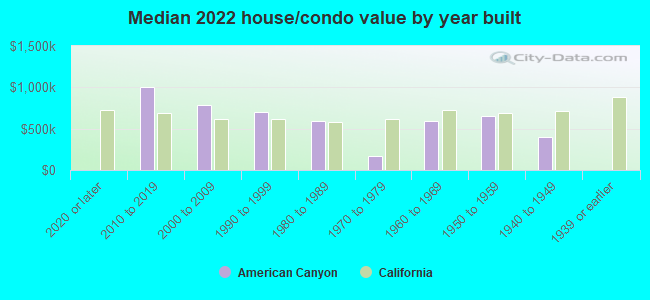
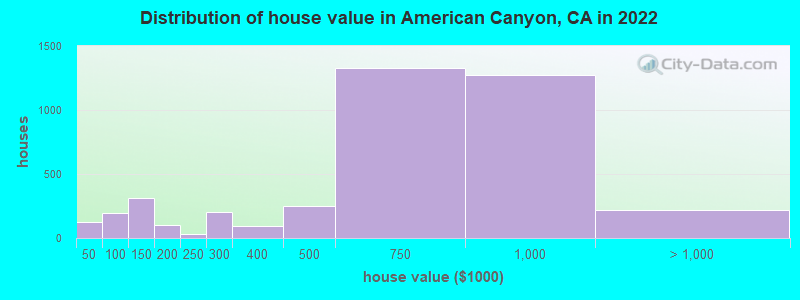
Median price asked for vacant for-sale houses and condos in 2022 in this county: $1,177,232.
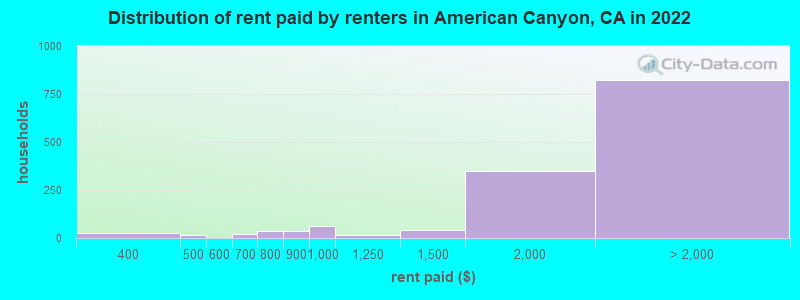
Median contract rent in 2022: over $2,000 (lower quartile is $1,647, upper quartile is over $2,000)
Median rent asked for vacant for-rent units in 2022: $4,106
Median gross rent in American Canyon, CA in 2022: over $2,000
Housing units in American Canyon with a mortgage: 3,257 (310 second mortgage, 17 home equity loan, 290 both second mortgage and home equity loan) Houses without a mortgage: 23
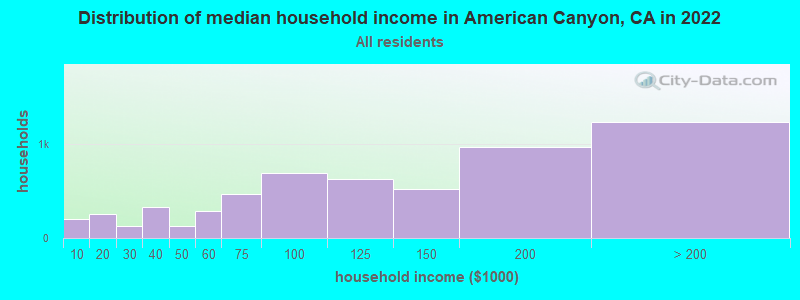
Median household income for houses/condos with a mortgage: $145,700
Median household income for apartments without a mortgage: $88,874
Median monthly housing costs: $2,343
Compare current foreclosures near American Canyon, CA:
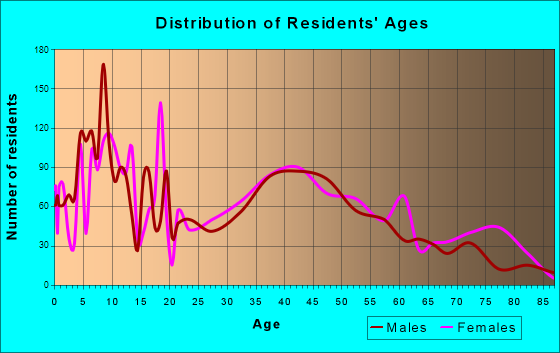
3,684 married couples with children.
642 single-parent households (176 men, 466 women).
56.1% of residents of American Canyon speak English at home.
20.5% of residents speak Spanish at home (58% speak English very well, 26% speak English well, 9% speak English not well, 6% don't speak English at all).
4.5% of residents speak other Indo-European language at home (61% speak English very well, 26% speak English well, 9% speak English not well, 4% don't speak English at all).
18.4% of residents speak Asian or Pacific Island language at home (65% speak English very well, 27% speak English well, 7% speak English not well, 1% don't speak English at all).
0.4% of residents speak other language at home (68% speak English very well, 8% speak English well, 24% speak English not well).
Foreign born population: 6,822 (32.2%)
(74.1% of them are naturalized citizens)
Percentage of workers working in this county: 53.8% Number of people working at home: 892 (8.9% of all workers)
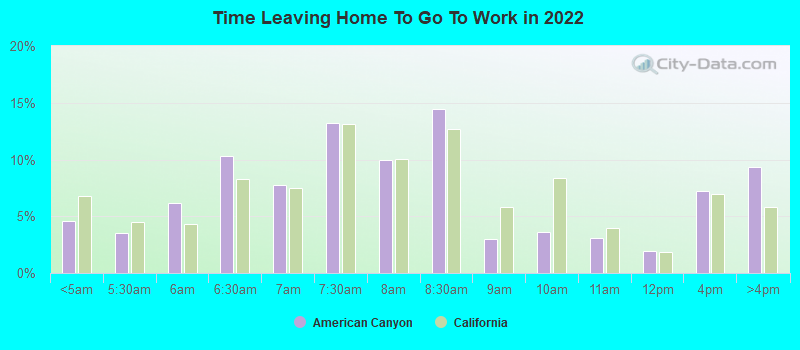
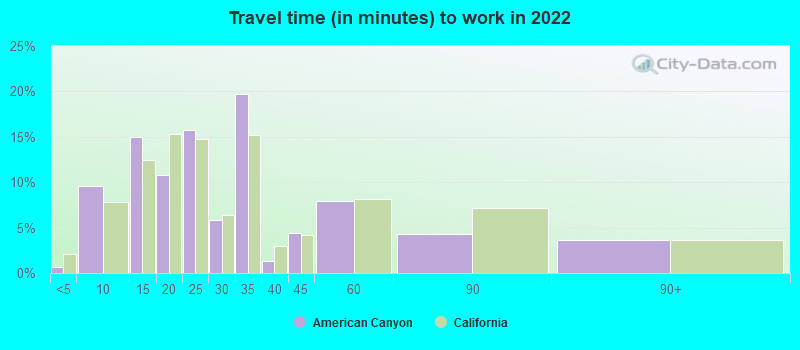
Travel time to work (commute)
Less than 5 minutes: 35
5 to 9 minutes: 558
10 to 14 minutes: 1,044
15 to 19 minutes: 1,090
20 to 24 minutes: 1,128
25 to 29 minutes: 439
30 to 34 minutes: 1,422
35 to 39 minutes: 398
40 to 44 minutes: 345
45 to 59 minutes: 1,052
60 to 89 minutes: 846
90 or more minutes: 333
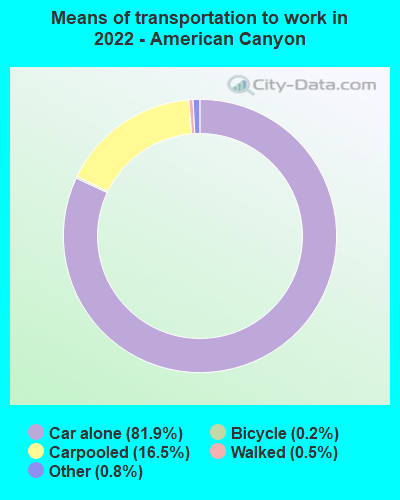
Means of transportation to work:
Drove a car alone: 3,008 (65.0%)
Carpooled: 724 (15.6%)
Taxi: 39 (0.8%)
Bicycle: 9 (0.2%)
Walked: 18 (0.4%)
Worked at home: 892 (19.3%)
Unemployment by race in 2022
Unemployment rate for White non-Hispanic residents
4.8%Males
4.9%Females
Unemployment rate for Black residents
12.2%Males
2.9%Females
Unemployment rate for Asian residents
4.5%Males
2.6%Females
Unemployment rate for other race residents
6.3%Males
9.5%Females
Unemployment rate for two or more race residents
7.7%Males
4.5%Females
Unemployment rate for Hispanic or Latino residents
9.4%Males
8.0%Females
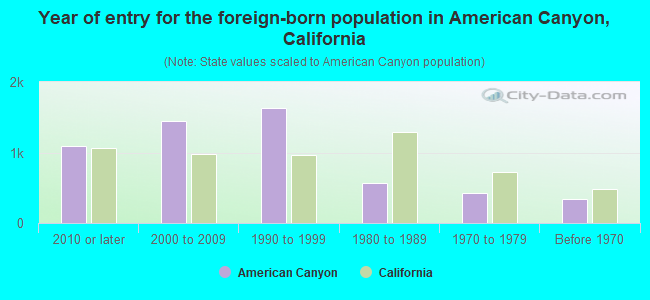
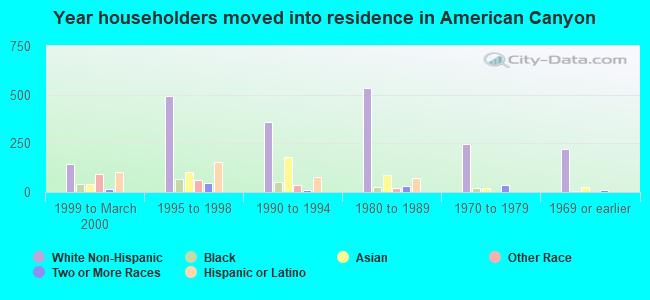
Year of entry for the foreign-born population in American Canyon, California
1,0922010 or later
1,4512000 to 2009
1,6271990 to 1999
5721980 to 1989
4291970 to 1979
340Before 1970
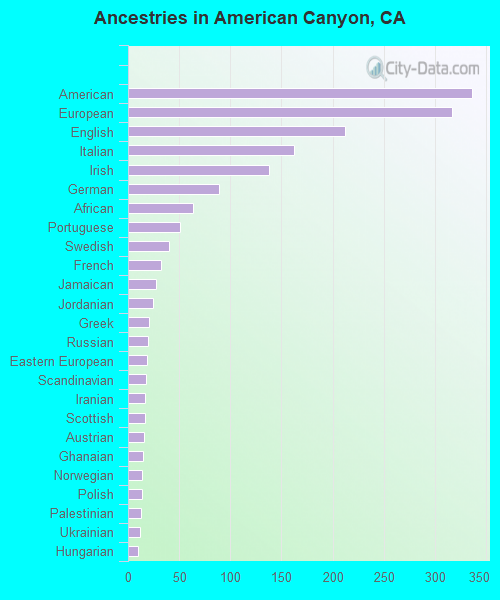
First ancestries reported:
American: 336 (2.7%)
European: 317 (2.6%)
English: 212 (1.7%)
Italian: 162 (1.3%)
Irish: 138 (1.1%)
German: 89 (0.7%)
African: 64 (0.5%)
Portuguese: 51 (0.4%)
Swedish: 40 (0.3%)
French: 32 (0.3%)
Jamaican: 27 (0.2%)
Jordanian: 24 (0.2%)
Greek: 21 (0.2%)
Russian: 20 (0.2%)
Eastern European: 19 (0.2%)
Scandinavian: 18 (0.1%)
Iranian: 17 (0.1%)
Scottish: 17 (0.1%)
Austrian: 16 (0.1%)
Ghanaian: 15 (0.1%)
Norwegian: 14 (0.1%)
Polish: 14 (0.1%)
Palestinian: 13 (0.1%)
Ukrainian: 12 (0.10%)
Hungarian: 10 (0.08%)
British: 9 (0.07%)
Armenian: 8 (0.06%)
Northern European: 7 (0.06%)
French Canadian: 3 (0.02%)
Welsh: 3 (0.02%)
Turkish: 2 (0.02%)
Scotch-Irish: 1 (0.01%)
Most common places of birth for foreign-born residents (%):
Philippines
American Canyon:
46.5% (3,134)
California:
7.8% (818,297)
Mexico
American Canyon:
23.5% (1,583)
California:
37.2% (3,881,193)
India
American Canyon:
6.8% (458)
California:
5.2% (539,184)
El Salvador
American Canyon:
3.9% (261)
California:
4.2% (440,287)
Taiwan
American Canyon:
2.4% (162)
California:
1.7% (176,274)
China, excluding Hong Kong and Taiwan
American Canyon:
1.9% (128)
California:
6.6% (684,672)
Vietnam
American Canyon:
1.7% (116)
California:
4.9% (512,335)
Guatemala
American Canyon:
1.5% (101)
California:
2.8% (290,436)
Place of birth for U.S.-born residents:
This state: 12,232
Other state: 1,934
Northeast: 286
Midwest: 499
South: 531
West: 550
93.2% of American Canyon residents lived in the same house 1 years ago. Out of people who lived in different houses, 30.8% lived in this county. Out of people who lived in different counties, 85.5% lived in California.
American Canyon:
93.2%
State average:
88.9%
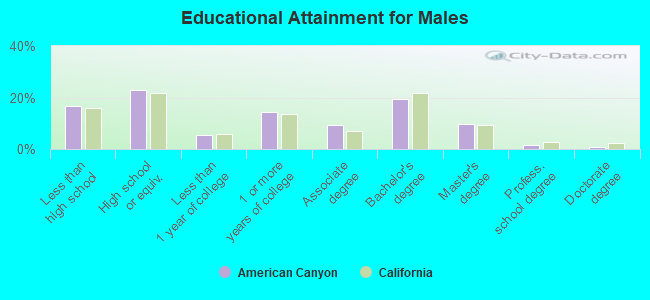
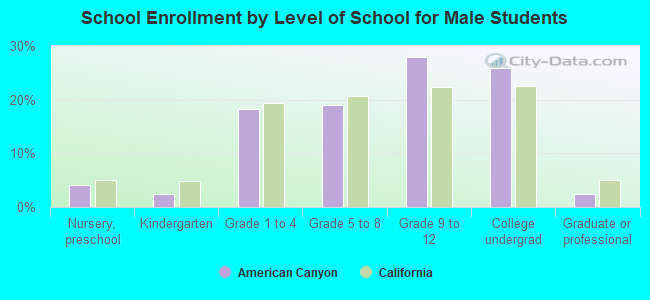
Education attainment for males 25 years and older:
No schooling: 313
Nursery to 4th grade: 94
5th and 6th grade: 176
7th and 8th grade: 160
9th grade: 34
10th grade: 26
11th grade: 51
12th grade, no diploma: 226
High school graduate (or equivalency): 1,469
Less than 1 year of college: 350
Some college more than 1 year, no degree: 921
Associate degree: 608
Bachelor's degree: 1,246
Master's degree: 620
Professional school degree: 99
Doctorate degree: 41
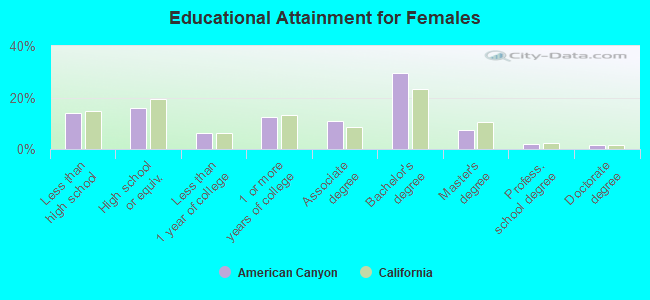
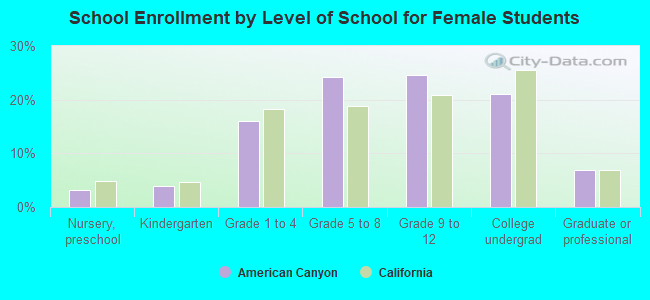
Education attainment for females 25 years and older:
No schooling: 250
Nursery to 4th grade: 120
5th and 6th grade: 106
7th and 8th grade: 83
9th grade: 15
10th grade: 65
11th grade: 28
12th grade, no diploma: 301
High school graduate (or equivalency): 1,096
Less than 1 year of college: 431
Some college more than 1 year, no degree: 860
Associate degree: 750
Bachelor's degree: 2,032
Master's degree: 510
Professional school degree: 135
Doctorate degree: 112
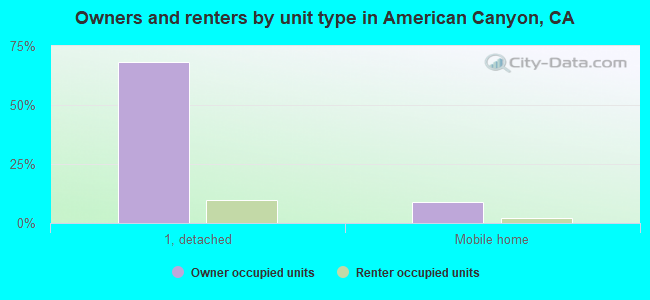
Housing units in structures:
One, detached: 4,339
One, attached: 144
Two: 39
3 or 4: 77
5 to 9: 84
10 to 19: 53
20 to 49: 287
50 or more: 146
Mobile homes: 848
Median worth of mobile homes: $144,910
Housing units lacking complete plumbing facilities in 2022: 0.3%
Housing units lacking complete kitchen facilities in 2022: 0.4%
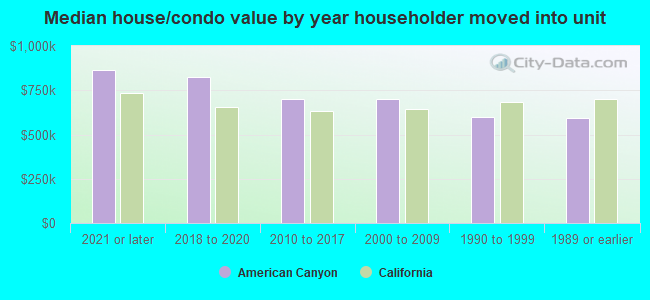
House/condo owner moved in on average 12 years ago