Amarillo, TX (Texas) Houses and Residents
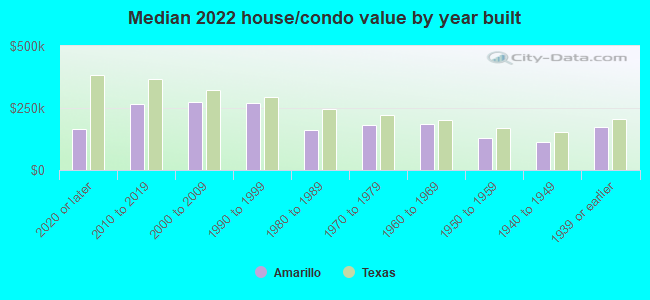
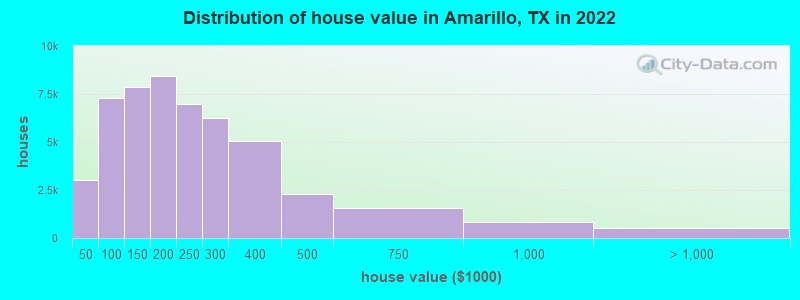
Estimated median house or condo value in 2022: $193,800 (it was $71,600 in 2000 )
Amarillo:
$193,800Texas:
$275,400
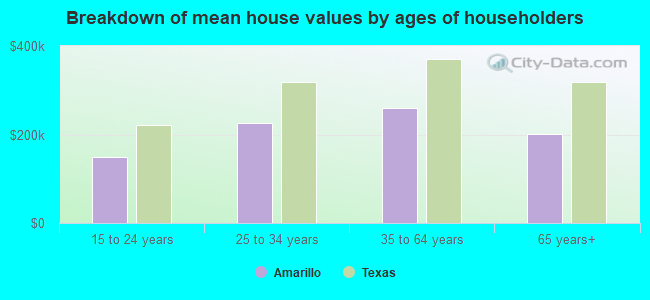
Lower value quartile - upper value quartile: $118,900 - $283,700Mean price in 2022: Detached houses: $265,145 Here:
$265,145State:
$369,058
Townhouses or other attached units: $236,372 Here:
$236,372State:
$327,631
In 2-unit structures: $192,445 Here:
$192,445State:
$374,947
In 3-to-4-unit structures: $248,115 Here:
$248,115State:
$209,652
In 5-or-more-unit structures: $320,442 Here:
$320,442State:
$413,944
Mobile homes: $100,914 Here:
$100,914State:
$124,413
Occupied boats, RVs, vans, etc.: $41,727 Here:
$41,727State:
$73,921
Total population: 197,254 (Urban population: 172,230, Rural population: 1,296 (30 farm, 1,266 nonfarm ))
Houses: 89,448 (78,793 occupied: 49,113 owner occupied, 29,680 renter occupied )
% of renters here:
38%State:
38%
Housing density: 995 houses/condos per square mile
Median price asked for vacant for-sale houses and condos in 2022: $195,337.
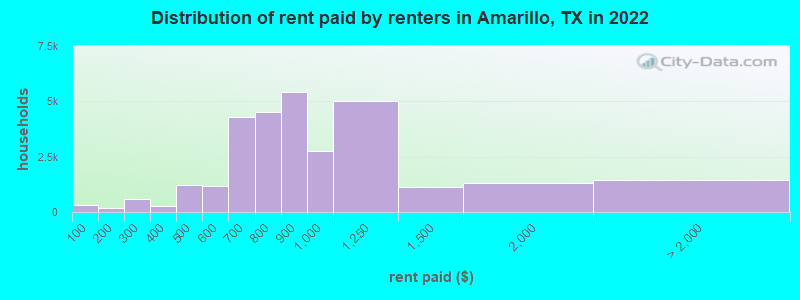
Median contract rent in 2022: $832 (lower quartile is $681, upper quartile is $1,040)
Median rent asked for vacant for-rent units in 2022: $840
Median gross rent in Amarillo, TX in 2022: $1,008
Housing units in Amarillo with a mortgage: 27,529 (777 second mortgage, 28 home equity loan, 565 both second mortgage and home equity loan )Houses without a mortgage: 365
Median household income for houses/condos with a mortgage: $84,330
Median household income for apartments without a mortgage: $62,994
Median monthly housing costs: $1,063
Data:
Median house or condo value ($)
Median house or condo value ($ change since 2000)
Median house or condo value ($) - White
Median house or condo value ($) - Black or African American
Median house or condo value ($) - Asian
Median house or condo value ($) - Hispanic or Latino
Median house or condo value ($) - American Indian and Alaska Native
Median house or condo value ($) - Multirace
Median house or condo value ($) - Other Race
Median price asked for mobile homes ($)
Household density (households per square mile)
Mean house or condo value by units in structure - 1, detached ($)
Mean house or condo value by units in structure - 1, attached ($)
Mean house or condo value by units in structure - 2 ($)
Mean house or condo value by units in structure by units in structure - 3 or 4 ($)
Mean house or condo value by units in structure - 5 or more ($)
Mean house or condo value by units in structure - Boat, RV, van, etc. ($)
Mean house or condo value by units in structure - Mobile home ($)
Median contract rent ($)
Median contract rent - Lower quartile ($)
Median contract rent - Upper quartile ($)
Median gross rent ($)
Urban houses (%)
Rural houses (%)
Houses occupied (%)
Houses occupied (% change since 2000)
Houses owner occupied (%)
Houses owner occupied (% change since 2000)
Houses renter occupied (%)
Houses renter occupied (% change since 2000)
Vacant housing units - For rent (%)
Vacant housing units - For rent (% change since 2000)
Vacant housing units - For sale only (%)
Vacant housing units - For sale only (% change since 2000)
Vacant housing units - Rented or sold, not occupied (%)
Vacant housing units - Rented or sold, not occupied (% change since 2000)
Vacant housing units - For seasonal, recreational, or occasional use (%)
Vacant housing units - For seasonal, recreational, or occasional use (% change since 2000)
Vacant housing units - For migrant workers (%)
Vacant housing units - For migrant workers (% change since 2000)
Vacant housing units - Other vacant (%)
Vacant housing units - Other vacant (% change since 2000)
Median monthly housing costs ($)
Median household income for houses/condos with a mortgage ($)
Median household income for houses/condos without a mortgage ($)
Median household income ($)
Median household income ($) - White
Median household income ($) - Black or African American
Median household income ($) - Asian
Median household income ($) - Hispanic or Latino
Median household income ($) - American Indian and Alaska Native
Median household income ($) - Multirace
Median household income ($) - Other Race
Mortgage status - with mortgage (%)
Mortgage status - with second mortgage (%)
Mortgage status - with home equity loan (%)
Mortgage status - with both second mortgage and home equity loan (%)
Mortgage status - without a mortgage (%)
Median year house/condo built
Median year apartment built
Household type by relationship - Male householder living alone (%)
Household type by relationship - Male householder not living alone (%)
Household type by relationship - Female householder living alone (%)
Household type by relationship - Female householder not living alone (%)
Household type by relationship - Opposite-Sex spouse (%)
Household type by relationship - Same-Sex spouse (%)
Household type by relationship - Opposite-Sex unmarried partner (%)
Household type by relationship - Same-Sex unmarried partner (%)
Household type by relationship - In group quarters (%)
Size of family households - 2-person household (%)
Size of family households - 3-person household (%)
Size of family households - 4-person household (%)
Size of family households - 5-person household (%)
Size of family households - 6-person household (%)
Size of family households - 7-or-more-person household (%)
Size of nonfamily households - 1-person household (%)
Size of nonfamily households - 2-person household (%)
Size of nonfamily households - 3-person household (%)
Size of nonfamily households - 4-person household (%)
Size of nonfamily households - 5-person household (%)
Size of nonfamily households - 6-person household (%)
Size of nonfamily households - 7-or-moreperson household (%)
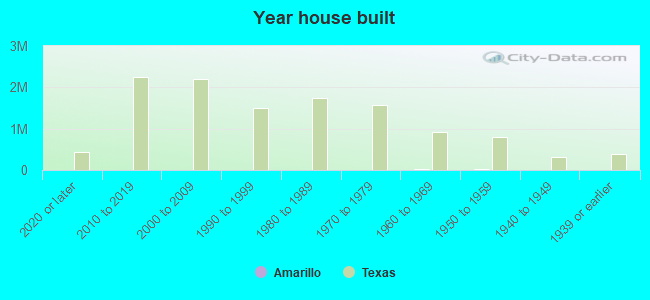
Year house built - Built 2010 or later (%)
Year house built - Built 2000 to 2009 (%)
Year house built - Built 1990 to 1999 (%)
Year house built - Built 1980 to 1989 (%)
Year house built - Built 1970 to 1979 (%)
Year house built - Built 1960 to 1969 (%)
Year house built - Built 1950 to 1959 (%)
Year house built - Built 1940 to 1949 (%)
Year house built - Built 1939 or earlier (%)
Median number of rooms in houses and condos
Median number of rooms in apartments
Median number of bedrooms in owner occupied houses
Mean number of bedrooms in owner occupied houses
Median number of bedrooms in renter occupied houses
Mean number of bedrooms in renter occupied houses
Median number of vehichles in owner occupied houses
Mean number of vehichles in owner occupied houses
Median number of vehichles in renter occupied houses
Mean number of vehichles in renter occupied houses
Rooms in owner-occupied houses - 1 room (%)
Rooms in owner-occupied houses - 2 rooms (%)
Rooms in owner-occupied houses - 3 rooms (%)
Rooms in owner-occupied houses - 4 rooms (%)
Rooms in owner-occupied houses - 5 rooms (%)
Rooms in owner-occupied houses - 6 rooms (%)
Rooms in owner-occupied houses - 7 rooms (%)
Rooms in owner-occupied houses - 8 rooms (%)
Rooms in owner-occupied houses - 9+ rooms (%)
Rooms in renter-occupied houses - 1 room (%)
Rooms in renter-occupied houses - 2 rooms (%)
Rooms in renter-occupied houses - 3 rooms (%)
Rooms in renter-occupied houses - 4 rooms (%)
Rooms in renter-occupied houses - 5 rooms (%)
Rooms in renter-occupied houses - 6 rooms (%)
Rooms in renter-occupied houses - 7 rooms (%)
Rooms in renter-occupied houses - 8 rooms (%)
Rooms in renter-occupied houses - 9+ rooms (%)
Bedrooms in owner-occupied houses - no bedrooms (%)
Bedrooms in owner-occupied houses - 1 bedroom (%)
Bedrooms in owner-occupied houses - 2 bedrooms (%)
Bedrooms in owner-occupied houses - 3 bedrooms (%)
Bedrooms in owner-occupied houses - 4 bedrooms (%)
Bedrooms in owner-occupied houses - 5+ bedrooms (%)
Bedrooms in renter-occupied houses - no bedrooms (%)
Bedrooms in renter-occupied houses - 1 bedroom (%)
Bedrooms in renter-occupied houses - 2 bedrooms (%)
Bedrooms in renter-occupied houses - 3 bedrooms (%)
Bedrooms in renter-occupied houses - 4 bedrooms (%)
Bedrooms in renter-occupied houses - 5+ bedrooms (%)
Vehicles available in owner-occupied houses - no vehicle available (%)
Vehicles available in owner-occupied houses - 1 vehicle available(%)
Vehicles available in owner-occupied houses - 2 Vehicles available (%)
Vehicles available in owner-occupied houses - 3 Vehicles available (%)
Vehicles available in owner-occupied houses - 4 Vehicles available (%)
Vehicles available in owner-occupied houses - 5+ Vehicles available (%)
Vehicles available in renter-occupied houses - no vehicle available (%)
Vehicles available in renter-occupied houses - 1 vehicle available (%)
Vehicles available in renter-occupied houses - 2 Vehicles available (%)
Vehicles available in renter-occupied houses - 3 Vehicles available (%)
Vehicles available in renter-occupied houses - 4 Vehicles available (%)
Vehicles available in renter-occupied houses - 5+ Vehicles available (%)
Housing units in structures - 1, detached (%)
Housing units in structures - 1, attached (%)
Housing units in structures - 2 (%)
Housing units in structures - 3 or 4 (%)
Housing units in structures - 5 to 9 (%)
Housing units in structures - 10 to 19 (%)
Housing units in structures - 20 to 49 (%)
Housing units in structures - 50 or more (%)
Housing units in structures - Mobile home (%)
Housing units in structures - Boat, RV, van, etc. (%)
Housing units in structures - Owners - 1, detached (%)
Housing units in structures - Owners - 1, attached (%)
Housing units in structures - Owners - 2 (%)
Housing units in structures - Owners - 3 or 4 (%)
Housing units in structures - Owners - 5 to 9 (%)
Housing units in structures - Owners - 10 to 19 (%)
Housing units in structures - Owners - 20 to 49 (%)
Housing units in structures - Owners - 50 or more (%)
Housing units in structures - Owners - Mobile home (%)
Housing units in structures - Owners - Boat, RV, van, etc. (%)
Housing units in structures - Renters - 1, detached (%)
Housing units in structures - Renters - 1, attached (%)
Housing units in structures - Renters - 2 (%)
Housing units in structures - Renters - 3 or 4 (%)
Housing units in structures - Renters - 5 to 9 (%)
Housing units in structures - Renters - 10 to 19 (%)
Housing units in structures - Renters - 20 to 49 (%)
Housing units in structures - Renters - 50 or more (%)
Housing units in structures - Renters - Mobile home (%)
Housing units in structures - Renters - Boat, RV, van, etc. (%)
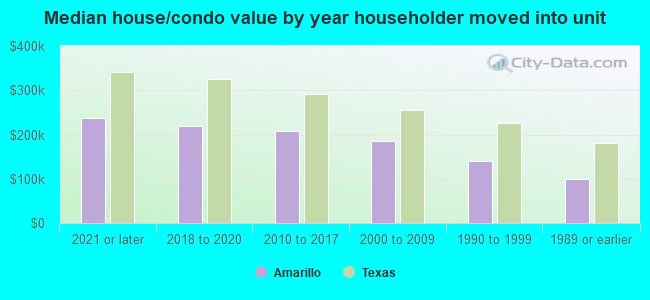
House/condo owner moved in on average (years ago)
Renter moved in on average (years ago)
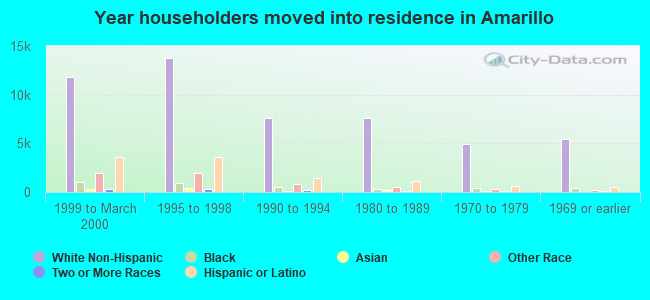
Year householder moved into unit - Moved in 1999 to March 2000 (%)
Year householder moved into unit - Moved in 1999 to March 2000 (%) - White
Year householder moved into unit - Moved in 1999 to March 2000 (%) - Black or African American
Year householder moved into unit - Moved in 1999 to March 2000 (%) - Asian
Year householder moved into unit - Moved in 1999 to March 2000 (%) - Hispanic or Latino
Year householder moved into unit - Moved in 1999 to March 2000 (%) - American Indian and Alaska Native
Year householder moved into unit - Moved in 1999 to March 2000 (%) - Multirace
Year householder moved into unit - Moved in 1999 to March 2000 (%) - Other Race
Year householder moved into unit - Moved in 1995 to 1998 (%)
Year householder moved into unit - Moved in 1995 to 1998 (%) - White
Year householder moved into unit - Moved in 1995 to 1998 (%) - Black or African American
Year householder moved into unit - Moved in 1995 to 1998 (%) - Asian
Year householder moved into unit - Moved in 1995 to 1998 (%) - Hispanic or Latino
Year householder moved into unit - Moved in 1995 to 1998 (%) - American Indian and Alaska Native
Year householder moved into unit - Moved in 1995 to 1998 (%) - Multirace
Year householder moved into unit - Moved in 1995 to 1998 (%) - Other Race
Year householder moved into unit - Moved in 1990 to 1994 (%)
Year householder moved into unit - Moved in 1990 to 1994 (%) - White
Year householder moved into unit - Moved in 1990 to 1994 (%) - Black or African American
Year householder moved into unit - Moved in 1990 to 1994 (%) - Asian
Year householder moved into unit - Moved in 1990 to 1994 (%) - Hispanic or Latino
Year householder moved into unit - Moved in 1990 to 1994 (%) - American Indian and Alaska Native
Year householder moved into unit - Moved in 1990 to 1994 (%) - Multirace
Year householder moved into unit - Moved in 1990 to 1994 (%) - Other Race
Year householder moved into unit - Moved in 1980 to 1989 (%)
Year householder moved into unit - Moved in 1980 to 1989 (%) - White
Year householder moved into unit - Moved in 1980 to 1989 (%) - Black or African American
Year householder moved into unit - Moved in 1980 to 1989 (%) - Asian
Year householder moved into unit - Moved in 1980 to 1989 (%) - Hispanic or Latino
Year householder moved into unit - Moved in 1980 to 1989 (%) - American Indian and Alaska Native
Year householder moved into unit - Moved in 1980 to 1989 (%) - Multirace
Year householder moved into unit - Moved in 1980 to 1989 (%) - Other Race
Year householder moved into unit - Moved in 1970 to 1979 (%)
Year householder moved into unit - Moved in 1970 to 1979 (%) - White
Year householder moved into unit - Moved in 1970 to 1979 (%) - Black or African American
Year householder moved into unit - Moved in 1970 to 1979 (%) - Asian
Year householder moved into unit - Moved in 1970 to 1979 (%) - Hispanic or Latino
Year householder moved into unit - Moved in 1970 to 1979 (%) - American Indian and Alaska Native
Year householder moved into unit - Moved in 1970 to 1979 (%) - Multirace
Year householder moved into unit - Moved in 1970 to 1979 (%) - Other Race
Year householder moved into unit - Moved in 1969 or earlier (%)
Year householder moved into unit - Moved in 1969 or earlier (%) - White
Year householder moved into unit - Moved in 1969 or earlier (%) - Black or African American
Year householder moved into unit - Moved in 1969 or earlier (%) - Asian
Year householder moved into unit - Moved in 1969 or earlier (%) - Hispanic or Latino
Year householder moved into unit - Moved in 1969 or earlier (%) - American Indian and Alaska Native
Year householder moved into unit - Moved in 1969 or earlier (%) - Multirace
Year householder moved into unit - Moved in 1969 or earlier (%) - Other Race
Housing units lacking complete plumbing facilities (%)
Housing units lacking complete kitchen facilities (%)
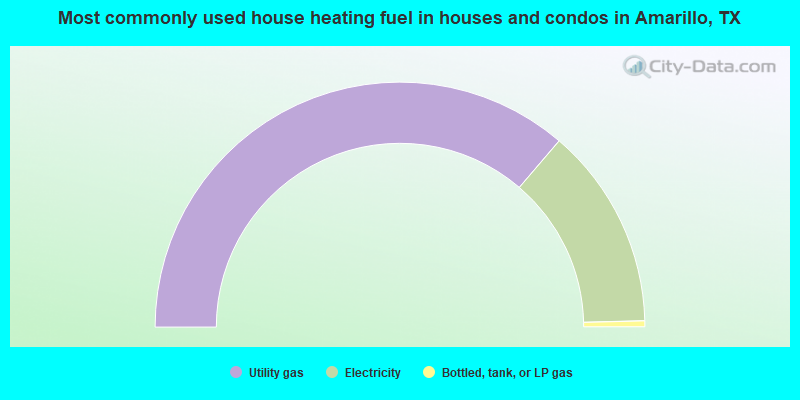
House heating fuel used in houses and condos - Utility gas (%)
House heating fuel used in houses and condos - Bottled, tank, or LP gas (%)
House heating fuel used in houses and condos - Electricity (%)
House heating fuel used in houses and condos - Fuel oil, kerosene, etc. (%)
House heating fuel used in houses and condos - Coal or coke (%)
House heating fuel used in houses and condos - Wood (%)
House heating fuel used in houses and condos - Solar energy (%)
House heating fuel used in houses and condos - Other fuel (%)
House heating fuel used in houses and condos - No fuel used (%)
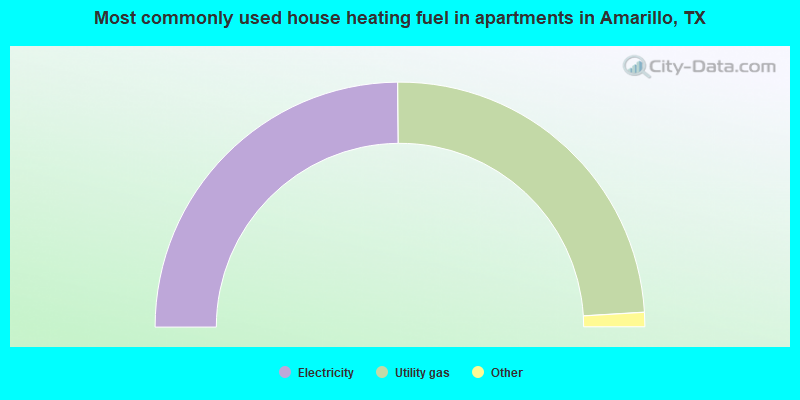
House heating fuel used in apartments - Utility gas (%)
House heating fuel used in apartments - Bottled, tank, or LP gas (%)
House heating fuel used in apartments - Electricity (%)
House heating fuel used in apartments - Fuel oil, kerosene, etc. (%)
House heating fuel used in apartments - Coal or coke (%)
House heating fuel used in apartments - Wood (%)
House heating fuel used in apartments - Solar energy (%)
House heating fuel used in apartments - Other fuel (%)
House heating fuel used in apartments - No fuel used (%)
Latest news about housing in Amarillo, TX collected exclusively by city-data.com from local newspapers, TV, and radio stations
Median year house/condo built: 1975Median year apartment built: 1974Household type by relationship:
Households: 203,477
Male householders: 40,168 (12,236 living alone ), Female householders: 38,625 (13,627 living alone )36,801 spouses (36,510 opposite-sex spouses ), 3,501 unmarried partners , (3,052 opposite-sex unmarried partners ), 64,888 children (59,883 natural , 2,032 adopted , 2,973 stepchildren ), 3,586 grandchildren , 2,033 brothers or sisters , 4,585 parents , 148 foster children , 2,282 other relatives , 4,149 non-relatives In group quarters: 2,711
Size of family households: 20,951 2-persons , 12,352 3-persons , 8,321 4-persons , 5,239 5-persons , 844 6-persons , 1,857 7-or-more-persons .
Size of nonfamily households: 25,863 1-person , 3,212 2-persons , 106 4-persons , 48 5-persons .
32,896 married couples with children. single-parent households (4,101 men , 11,224 women ).
76.3% of residents of Amarillo speak English at home. of residents speak Spanish at home (73% speak English very well , 13% speak English well , 10% speak English not well , 4% don't speak English at all ).of residents speak other Indo-European language at home (65% speak English very well , 24% speak English well , 7% speak English not well , 4% don't speak English at all ).of residents speak Asian or Pacific Island language at home (48% speak English very well , 24% speak English well , 23% speak English not well , 5% don't speak English at all ).of residents speak other language at home (65% speak English very well , 15% speak English well , 17% speak English not well , 3% don't speak English at all ).
Foreign born population: 20,406 (10.0%)of them are naturalized citizens )
Median number of rooms in houses and condos:
Median number of rooms in apartments
Owner-occupied Renter-occupied
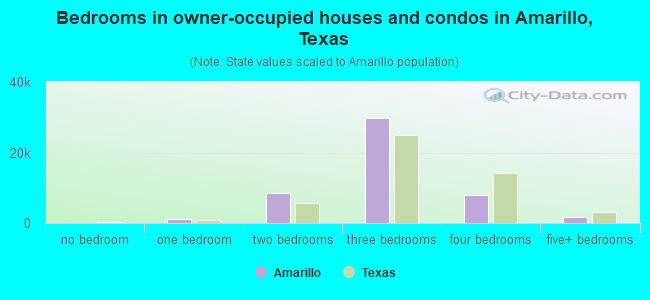
Bedrooms in owner-occupied houses and condos in Amarillo, Texas
105 no bedroom 1,134 1 bedroom 8,647 2 bedrooms 29,673 3 bedrooms 7,857 4 bedrooms 1,697 5+ bedrooms
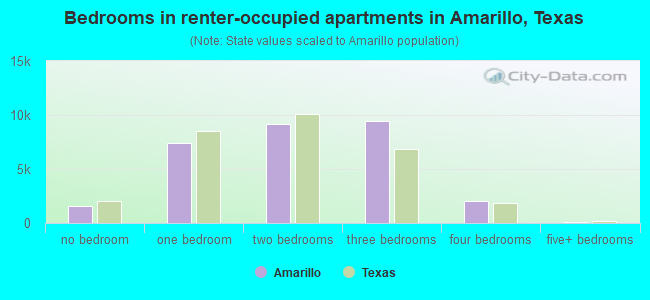
Bedrooms in renter-occupied apartments in Amarillo, Texas
1,576 no bedroom 7,450 1 bedroom 9,165 2 bedrooms 9,411 3 bedrooms 2,002 4 bedrooms 76 5+ bedrooms
Owner-occupied Renter-occupied
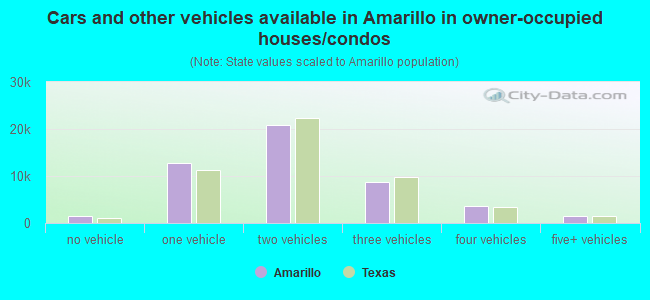
Cars and other vehicles available in Amarillo in owner-occupied houses/condos
1,571 no vehicle 12,842 1 vehicle 20,848 2 vehicles 8,756 3 vehicles 3,621 4 vehicles 1,475 5+ vehicles
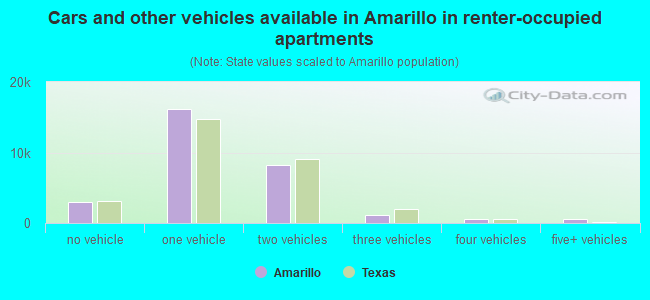
Cars and other vehicles available in Amarillo in renter-occupied apartments
2,941 no vehicle 16,239 1 vehicle 8,192 2 vehicles 1,152 3 vehicles 590 4 vehicles 566 5+ vehicles
Owner-occupied Renter-occupied
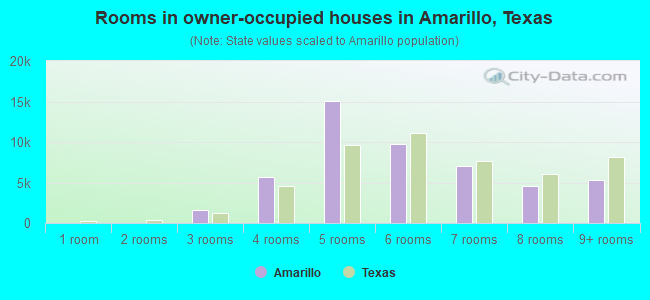
Rooms in owner-occupied houses in Amarillo, Texas
53 1 room 61 2 rooms 1,661 3 rooms 5,629 4 rooms 15,066 5 rooms 9,704 6 rooms 7,065 7 rooms 4,551 8 rooms 5,323 9+ rooms
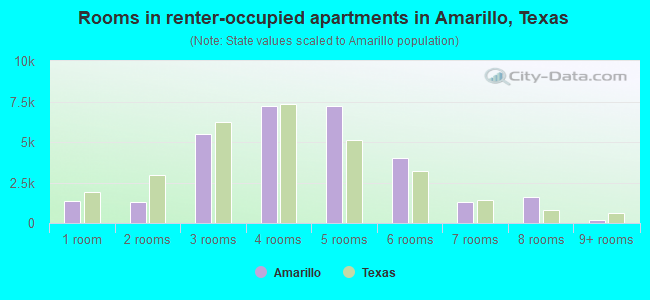
Rooms in renter-occupied apartments in Amarillo, Texas
1,356 1 room 1,325 2 rooms 5,477 3 rooms 7,218 4 rooms 7,208 5 rooms 3,983 6 rooms 1,292 7 rooms 1,621 8 rooms 200 9+ rooms
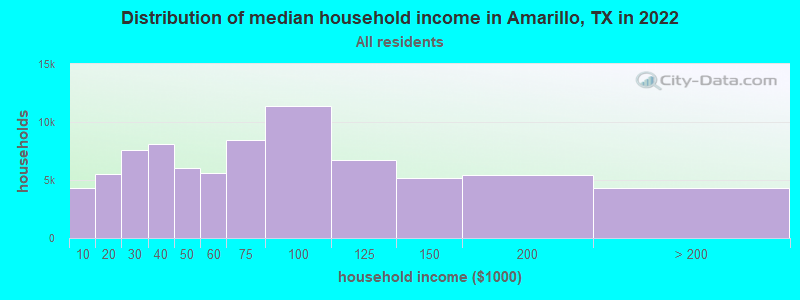
Amarillo, TX household income distribution 4,273 Less than $10,0005,554 $10,000 to $19,9997,614 $20,000 to $29,9998,143 $30,000 to $39,9996,065 $40,000 to $49,9995,625 $50,000 to $59,9998,485 $60,000 to $74,99911,337 $75,000 to $99,9996,721 $100,000 to $124,9995,191 $125,000 to $149,9995,435 $150,000 to $199,9994,350 $200,000 or more
Home value of owner - occupied houses in 2022 in Amarillo, TX 675 Less than $10,000575 $10,000 to $14,999217 $15,000 to $19,999179 $20,000 to $24,99966 $25,000 to $29,99989 $30,000 to $34,999223 $35,000 to $39,999972 $40,000 to $49,999583 $50,000 to $59,999826 $60,000 to $69,9991,116 $70,000 to $79,9992,229 $80,000 to $89,9991,550 $90,000 to $99,9993,944 $100,000 to $124,9993,933 $125,000 to $149,9994,192 $150,000 to $174,9994,245 $175,000 to $199,9996,999 $200,000 to $249,9996,272 $250,000 to $299,9995,072 $300,000 to $399,9992,268 $400,000 to $499,9991,566 $500,000 to $749,999815 $750,000 to $999,999244 $1,000,000 to $1,499,999263 $2,000,000 or moreRent paid by renters in 2022 in Amarillo, TX 335 Less than $10033 $100 to $149134 $150 to $199470 $200 to $249139 $250 to $29955 $300 to $349196 $350 to $399323 $400 to $449899 $450 to $499679 $500 to $549512 $550 to $5992,013 $600 to $6492,277 $650 to $6992,402 $700 to $7492,137 $750 to $7995,413 $800 to $8992,751 $900 to $9995,013 $1,000 to $1,2491,110 $1,250 to $1,4991,328 $1,500 to $1,999299 $2,000 to $2,49935 $2,500 to $2,999199 $3,500 or more928 No cash rent
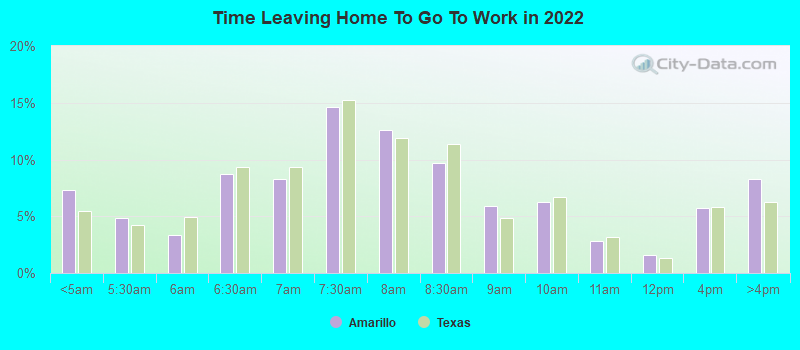
Percentage of workers working in this county: 60.7%Number of people working at home: 6,272 (6.3% of all workers )
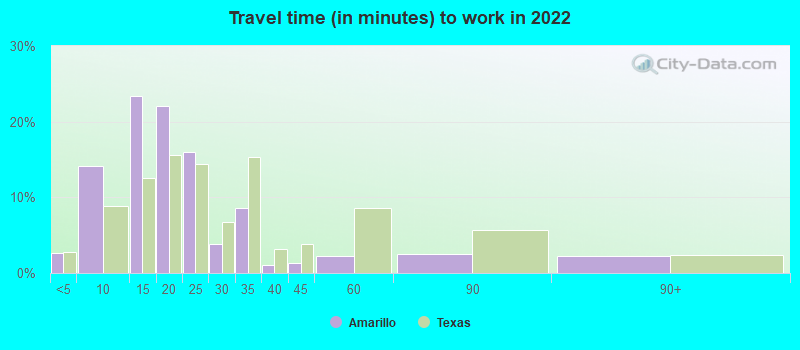
Travel time to work (commute)
Less than 5 minutes: 2,6985 to 9 minutes: 13,43910 to 14 minutes: 23,10115 to 19 minutes: 20,47920 to 24 minutes: 13,46025 to 29 minutes: 3,86830 to 34 minutes: 8,56735 to 39 minutes: 85840 to 44 minutes: 92245 to 59 minutes: 1,36060 to 89 minutes: 2,47890 or more minutes: 1,378
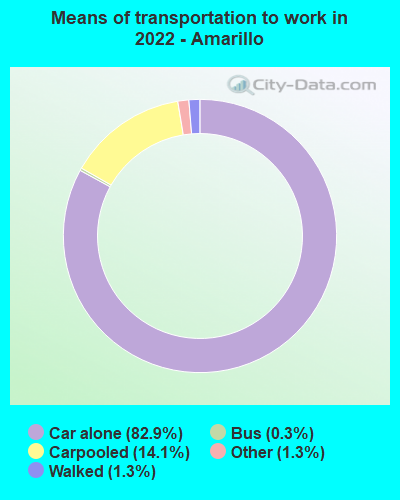
Means of transportation to work:
Drove a car alone: 79,182 (77.8%)Carpooled: 13,452 (13.2%)Bus : 309 (0.3%)Taxi: 1,226 (1.2%)Bicycle: 89 (0.1%)Walked: 1,247 (1.2%)Worked at home: 6,272 (6.2%)
Unemployment by race in 2022
Unemployment rate for White non-Hispanic residents 1.2% Males4.8% FemalesUnemployment rate for Black residents 3.8% Males6.9% FemalesUnemployment rate for American Indian and Alaska Native residents 2.9% MalesUnemployment rate for Asian residents 0.8% Males0.5% FemalesUnemployment rate for other race residents 4.0% Males5.8% FemalesUnemployment rate for two or more race residents 2.3% Males3.2% FemalesUnemployment rate for Hispanic or Latino residents 3.0% Males4.3% Females
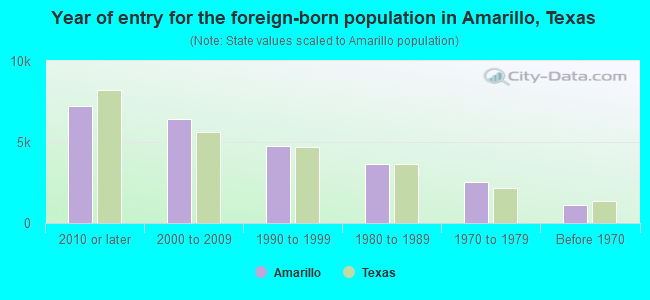
Year of entry for the foreign-born population in Amarillo, Texas
7,252 2010 or later 6,432 2000 to 2009 4,744 1990 to 1999 3,651 1980 to 1989 2,508 1970 to 1979 1,128 Before 1970
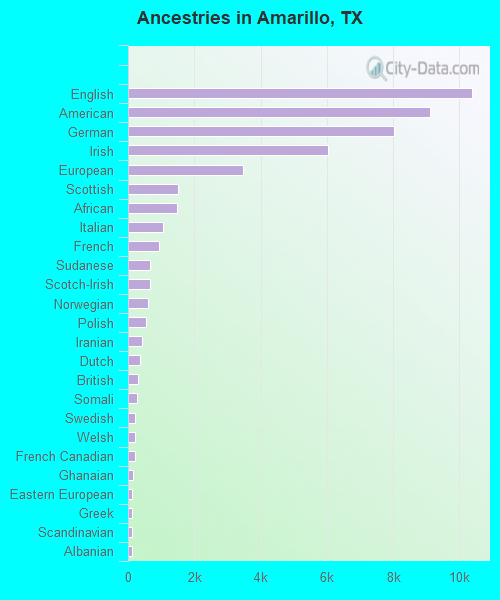
First ancestries reported:
English: 10,378 (8.8%)
American: 9,110 (7.7%)
German: 8,029 (6.8%)
Irish: 6,042 (5.1%)
European: 3,463 (2.9%)
Scottish: 1,514 (1.3%)
African: 1,494 (1.3%)
Italian: 1,050 (0.9%)
French: 948 (0.8%)
Sudanese: 671 (0.6%)
Scotch-Irish: 662 (0.6%)
Norwegian: 604 (0.5%)
Polish: 530 (0.5%)
Iranian: 414 (0.4%)
Dutch: 349 (0.3%)
British: 295 (0.3%)
Somali: 267 (0.2%)
Swedish: 223 (0.2%)
Welsh: 215 (0.2%)
French Canadian: 210 (0.2%)
Ghanaian: 148 (0.1%)
Eastern European: 131 (0.1%)
Greek: 120 (0.1%)
Scandinavian: 118 (0.1%)
Albanian: 111 (0.09%)
Russian: 110 (0.09%)
Ethiopian: 97 (0.08%)
Lebanese: 96 (0.08%)
Romanian: 89 (0.08%)
Iraqi: 87 (0.07%)
Austrian: 82 (0.07%)
Jamaican: 79 (0.07%)
Afghan: 78 (0.07%)
Basque: 76 (0.06%)
Hungarian: 74 (0.06%)
Czech: 66 (0.06%)
Nigerian: 63 (0.05%)
Croatian: 56 (0.05%)
Arab: 43 (0.04%)
Canadian: 40 (0.03%)
Danish: 34 (0.03%)
Slavic: 30 (0.03%)
Ugandan: 29 (0.02%)
Northern European: 27 (0.02%)
Yugoslavian: 23 (0.02%)
Turkish: 22 (0.02%)
Czechoslovakian: 21 (0.02%)
Syrian: 19 (0.02%)
Swiss: 16 (0.01%)
Cajun: 14 (0.01%)
British West Indian: 12 (0.01%)
Armenian: 10 (0.01%)
Celtic: 9 (0.01%)
Portuguese: 8 (0.01%)
West Indian: 8 (0.01%)
Sierra Leonean: 6 (0.01%)
Most common places of birth for foreign-born residents (%): Mexico Amarillo:
47.9% (11,297)Texas:
48.4% (2,411,723)
Vietnam Amarillo:
5.1% (1,199)Texas:
3.7% (184,770)
Burma (Myanmar) Amarillo:
4.5% (1,070)Texas:
0.2% (12,200)
Thailand Amarillo:
3.2% (762)Texas:
0.3% (15,368)
Congo Amarillo:
2.6% (623)Texas:
0.1% (6,376)
Laos Amarillo:
2.1% (505)Texas:
0.2% (9,141)
Philippines Amarillo:
1.9% (449)Texas:
2.1% (103,148)
India Amarillo:
1.7% (404)Texas:
6.1% (306,347)
Iran Amarillo:
1.6% (388)Texas:
0.6% (28,963)
El Salvador Amarillo:
1.6% (387)Texas:
4.5% (224,455)
Honduras Amarillo:
1.6% (367)Texas:
3.0% (147,182)
Place of birth for U.S.-born residents:
This state: 133,940Other state: 46,066Northeast: 3,641Midwest: 8,724South: 14,217West: 19,484 89.0% of Amarillo residents lived in the same house 1 years ago.
Out of people who lived in different houses, 29.6% lived in this county.
Out of people who lived in different counties, 66.3% lived in Texas.
Amarillo:
89.0%State average:
85.7%
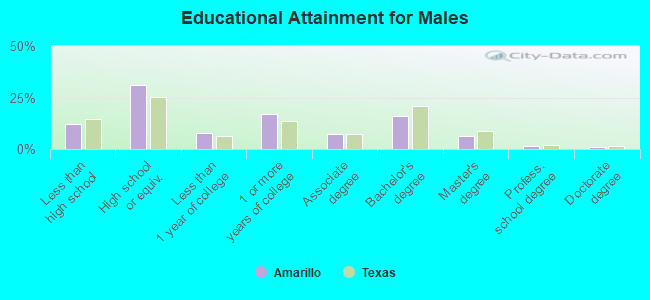
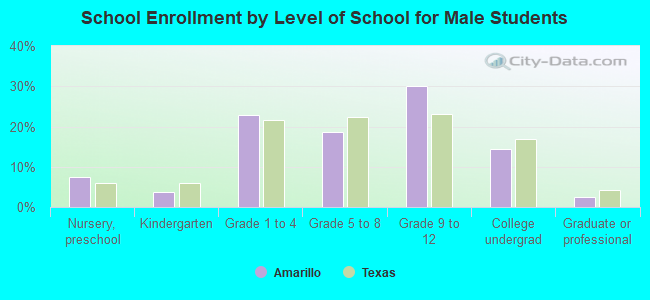
Education attainment for males 25 years and older:
No schooling: 1,058Nursery to 4th grade: 695th and 6th grade: 1,3207th and 8th grade: 5309th grade: 95510th grade: 1,65911th grade: 1,24812th grade, no diploma: 1,119High school graduate (or equivalency): 19,966Less than 1 year of college: 4,877Some college more than 1 year, no degree: 10,933Associate degree: 4,852Bachelor's degree: 10,219Master's degree: 4,053Professional school degree: 985Doctorate degree: 745
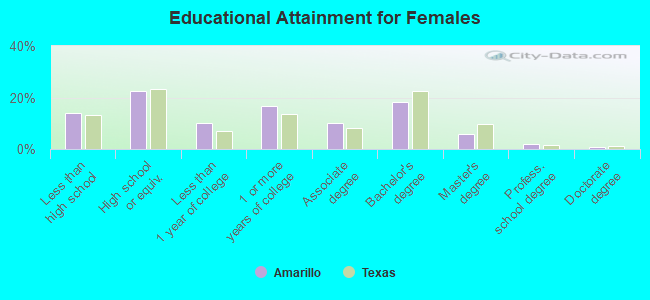
Education attainment for females 25 years and older:
No schooling: 2,391Nursery to 4th grade: 4975th and 6th grade: 7357th and 8th grade: 8509th grade: 1,36410th grade: 94311th grade: 1,24412th grade, no diploma: 1,138High school graduate (or equivalency): 14,851Less than 1 year of college: 6,543Some college more than 1 year, no degree: 11,150Associate degree: 6,585Bachelor's degree: 12,123Master's degree: 3,929Professional school degree: 1,165Doctorate degree: 501
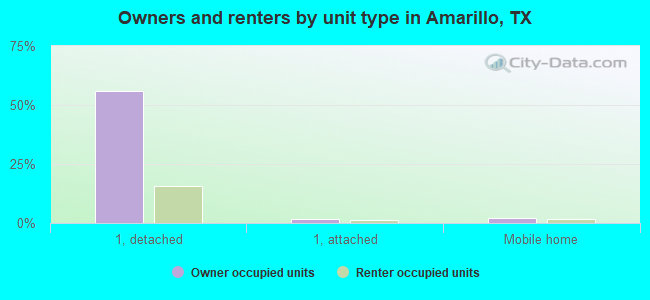
Housing units in structures:
One, detached: 64,437One, attached: 3,448Two: 1,3433 or 4: 2,8905 to 9: 3,39010 to 19: 3,51920 to 49: 2,46950 or more: 4,666Mobile homes: 3,184Boats, RVs, vans, etc.: 102Median worth of mobile homes: $44,000
Housing units lacking complete plumbing facilities in 2022: 4.1%Housing units lacking complete kitchen facilities in 2022: 6.5%House/condo owner moved in on average 10 years ago
Renter moved in on average 2 years ago
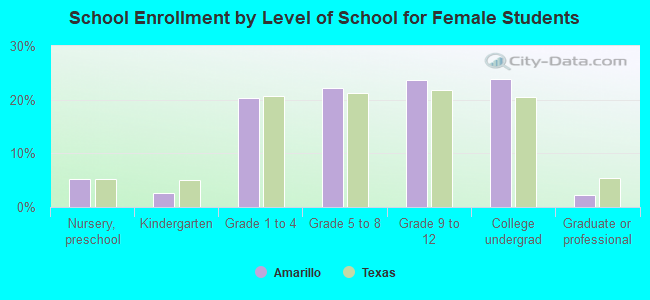
Private vs. public school enrollment:
Students in private schools in grades 1 to 8 (elementary and middle school): 2,435 Students in private schools in grades 9 to 12 (high school): 683 Students in private undergraduate colleges: 787