Housing density: 1,830 houses/condos per square mile
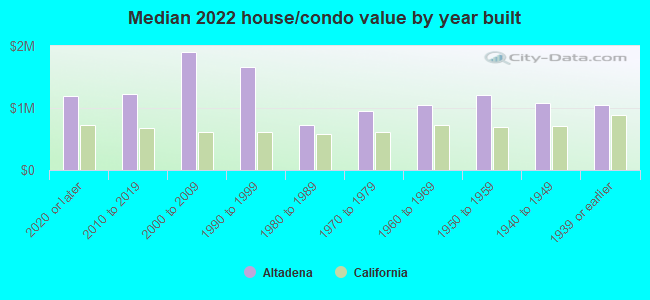
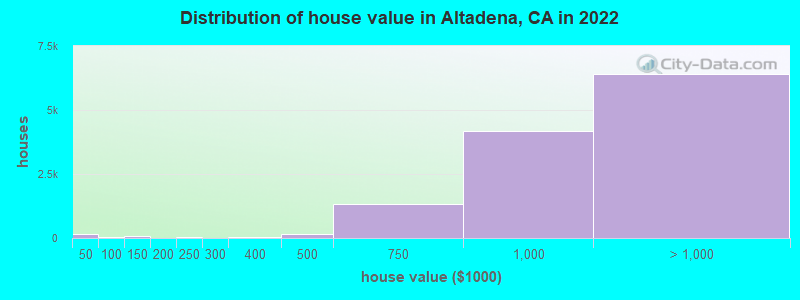
Median price asked for vacant for-sale houses and condos in 2022: $958,079.
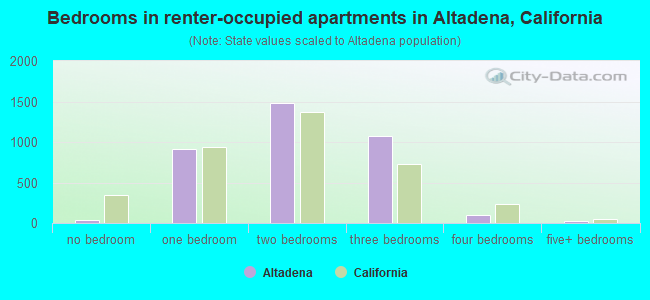
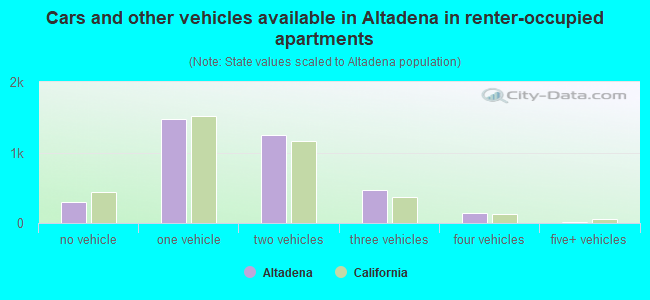
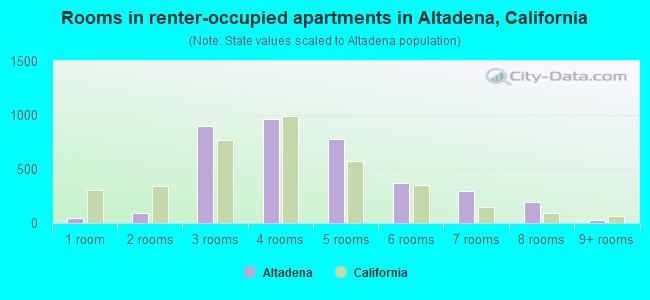
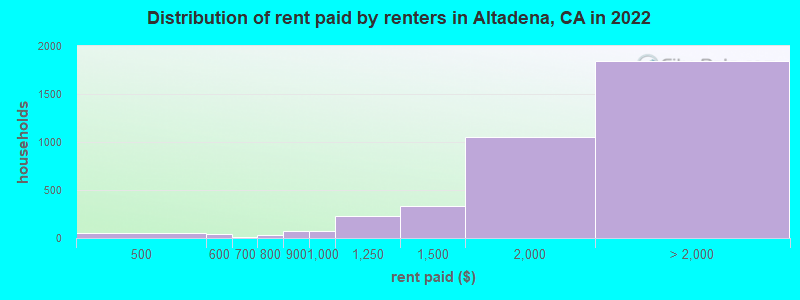
Median contract rent in 2022: $1,910 (lower quartile is $1,470, upper quartile is over $2,000)
Median rent asked for vacant for-rent units in 2022: $3,702
Median gross rent in Altadena, CA in 2022: over $2,000
Housing units in Altadena with a mortgage: 8,036 (975 second mortgage, 44 home equity loan, 845 both second mortgage and home equity loan) Houses without a mortgage: 52
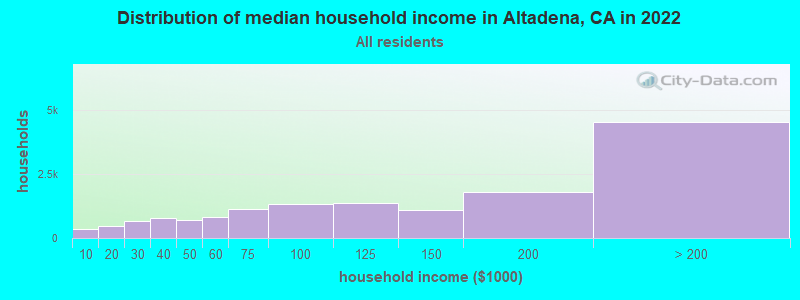
Median household income for houses/condos with a mortgage: $164,090
Median household income for apartments without a mortgage: $115,399
4,875 married couples with children.
1,823 single-parent households (222 men, 1,601 women).
69.0% of residents of Altadena speak English at home.
19.5% of residents speak Spanish at home (62% speak English very well, 18% speak English well, 16% speak English not well, 5% don't speak English at all).
8.6% of residents speak other Indo-European language at home (71% speak English very well, 14% speak English well, 15% speak English not well).
2.7% of residents speak Asian or Pacific Island language at home (65% speak English very well, 24% speak English well, 9% speak English not well, 1% don't speak English at all).
1.0% of residents speak other language at home (83% speak English very well, 5% speak English well, 12% speak English not well).
Foreign born population: 8,891 (21.3%)
(72.6% of them are naturalized citizens)
Percentage of workers working in this county: 96.1% Number of people working at home: 5,403 (26.1% of all workers)
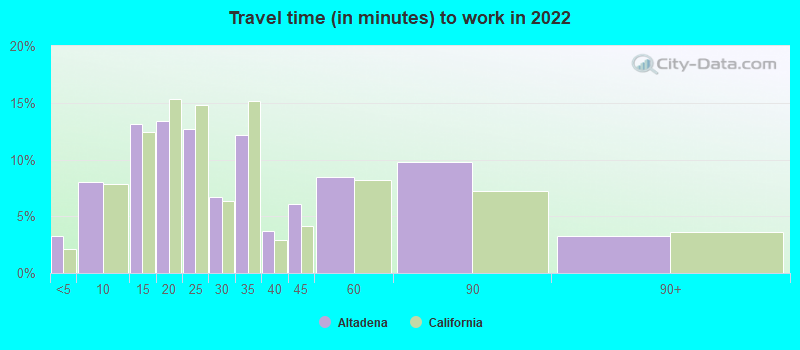
Travel time to work (commute)
Less than 5 minutes: 312
5 to 9 minutes: 941
10 to 14 minutes: 2,293
15 to 19 minutes: 2,589
20 to 24 minutes: 2,392
25 to 29 minutes: 1,053
30 to 34 minutes: 2,119
35 to 39 minutes: 492
40 to 44 minutes: 886
45 to 59 minutes: 1,486
60 to 89 minutes: 1,118
90 or more minutes: 228
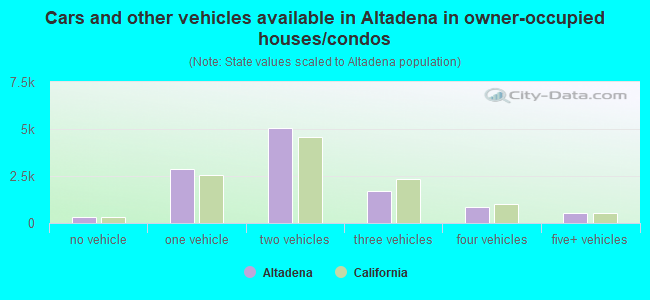
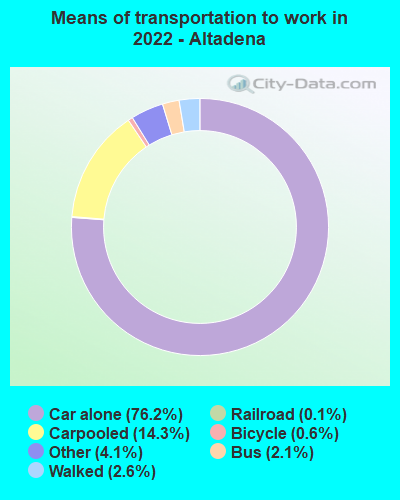
Means of transportation to work:
Drove a car alone: 4,320 (42.5%)
Carpooled: 895 (8.8%)
Bus: 107 (1.1%)
Light rail, streetcar or trolley: 4 (0.0%)
Taxi: 254 (2.5%)
Bicycle: 35 (0.3%)
Walked: 158 (1.6%)
Worked at home: 5,403 (53.2%)
Unemployment by race in 2022
Unemployment rate for White non-Hispanic residents
7.0%Males
1.5%Females
Unemployment rate for Black residents
11.9%Males
4.8%Females
Unemployment rate for American Indian and Alaska Native residents
7.9%Females
Unemployment rate for Asian residents
0.8%Males
1.2%Females
Unemployment rate for other race residents
4.1%Males
12.0%Females
Unemployment rate for two or more race residents
8.5%Males
7.5%Females
Unemployment rate for Hispanic or Latino residents
5.8%Males
7.7%Females
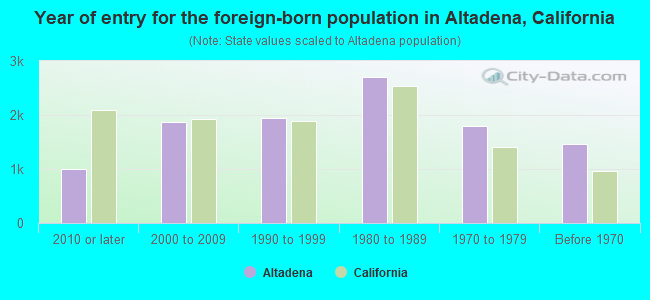
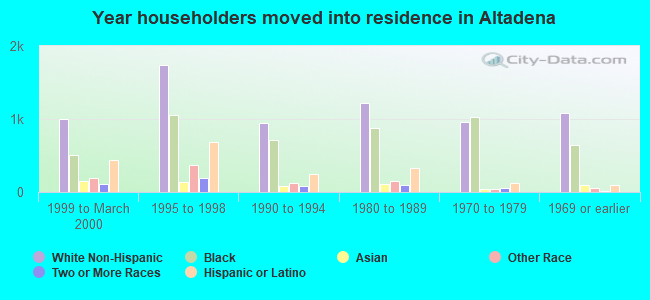
Year of entry for the foreign-born population in Altadena, California
9932010 or later
1,8762000 to 2009
1,9501990 to 1999
2,7121980 to 1989
1,8001970 to 1979
1,471Before 1970
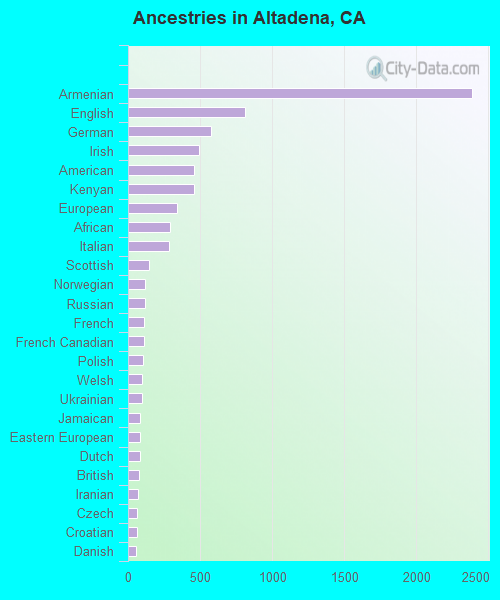
First ancestries reported:
Armenian: 2,385 (10.7%)
English: 814 (3.6%)
German: 579 (2.6%)
Irish: 494 (2.2%)
American: 461 (2.1%)
Kenyan: 461 (2.1%)
European: 341 (1.5%)
African: 294 (1.3%)
Italian: 283 (1.3%)
Scottish: 148 (0.7%)
Norwegian: 120 (0.5%)
Russian: 117 (0.5%)
French: 113 (0.5%)
French Canadian: 113 (0.5%)
Polish: 102 (0.5%)
Welsh: 100 (0.4%)
Ukrainian: 94 (0.4%)
Jamaican: 86 (0.4%)
Eastern European: 83 (0.4%)
Dutch: 82 (0.4%)
British: 73 (0.3%)
Iranian: 67 (0.3%)
Czech: 65 (0.3%)
Croatian: 59 (0.3%)
Danish: 55 (0.2%)
Scotch-Irish: 51 (0.2%)
Belizean: 50 (0.2%)
Lithuanian: 47 (0.2%)
Swedish: 44 (0.2%)
Arab: 41 (0.2%)
Scandinavian: 41 (0.2%)
Estonian: 39 (0.2%)
Egyptian: 36 (0.2%)
Canadian: 30 (0.1%)
Ghanaian: 30 (0.1%)
Greek: 28 (0.1%)
Palestinian: 22 (0.10%)
Hungarian: 21 (0.09%)
Afghan: 19 (0.08%)
Northern European: 16 (0.07%)
Jordanian: 15 (0.07%)
Austrian: 14 (0.06%)
Pennsylvania German: 12 (0.05%)
Sierra Leonean: 10 (0.04%)
Celtic: 9 (0.04%)
Guyanese: 9 (0.04%)
Latvian: 8 (0.04%)
Icelander: 7 (0.03%)
Portuguese: 7 (0.03%)
Trinidadian and Tobagonian: 5 (0.02%)
Romanian: 4 (0.02%)
Cypriot: 4 (0.02%)
Most common places of birth for foreign-born residents (%):
Mexico
Altadena:
22.0% (1,956)
California:
37.2% (3,881,193)
Armenia
Altadena:
9.9% (878)
California:
0.8% (78,847)
El Salvador
Altadena:
9.0% (801)
California:
4.2% (440,287)
Lebanon
Altadena:
4.3% (386)
California:
0.3% (31,757)
Philippines
Altadena:
4.2% (375)
California:
7.8% (818,297)
Syria
Altadena:
4.2% (371)
California:
0.3% (30,949)
Colombia
Altadena:
3.4% (304)
California:
0.5% (55,249)
Kenya
Altadena:
3.2% (284)
California:
0.1% (12,503)
India
Altadena:
3.1% (276)
California:
5.2% (539,184)
Venezuela
Altadena:
3.1% (273)
California:
0.2% (16,998)
Nicaragua
Altadena:
2.8% (248)
California:
0.6% (58,161)
Guatemala
Altadena:
2.7% (236)
California:
2.8% (290,436)
Canada
Altadena:
2.5% (219)
California:
1.2% (127,477)
Jamaica
Altadena:
1.8% (162)
California:
0.2% (15,939)
Iran
Altadena:
1.8% (158)
California:
2.0% (206,004)
Germany
Altadena:
1.8% (157)
California:
0.7% (73,304)
Japan
Altadena:
1.6% (145)
California:
1.0% (103,575)
China, excluding Hong Kong and Taiwan
Altadena:
1.6% (144)
California:
6.6% (684,672)
South Africa
Altadena:
1.6% (139)
California:
0.2% (20,614)
Place of birth for U.S.-born residents:
This state: 23,144
Other state: 9,031
Northeast: 2,645
Midwest: 2,615
South: 2,781
West: 1,011
91.4% of Altadena residents lived in the same house 1 years ago. Out of people who lived in different houses, 42.9% lived in this county. Out of people who lived in different counties, 44.2% lived in California.
Altadena:
91.4%
State average:
88.9%
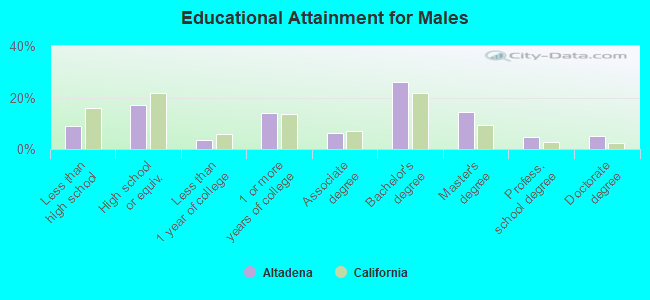
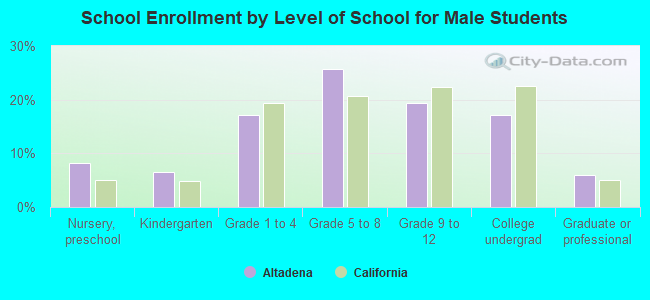
Education attainment for males 25 years and older:
No schooling: 364
Nursery to 4th grade: 28
5th and 6th grade: 280
7th and 8th grade: 114
9th grade: 2
10th grade: 61
11th grade: 121
12th grade, no diploma: 343
High school graduate (or equivalency): 2,499
Less than 1 year of college: 535
Some college more than 1 year, no degree: 2,035
Associate degree: 927
Bachelor's degree: 3,832
Master's degree: 2,139
Professional school degree: 704
Doctorate degree: 725
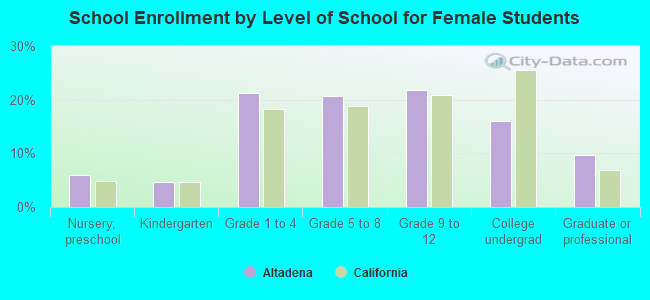
Education attainment for females 25 years and older:
No schooling: 218
Nursery to 4th grade: 107
5th and 6th grade: 195
7th and 8th grade: 219
9th grade: 56
10th grade: 48
11th grade: 94
12th grade, no diploma: 149
High school graduate (or equivalency): 1,940
Less than 1 year of college: 634
Some college more than 1 year, no degree: 1,828
Associate degree: 1,799
Bachelor's degree: 4,803
Master's degree: 3,048
Professional school degree: 947
Doctorate degree: 806
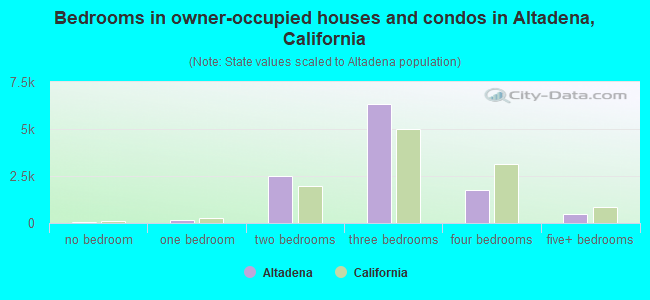
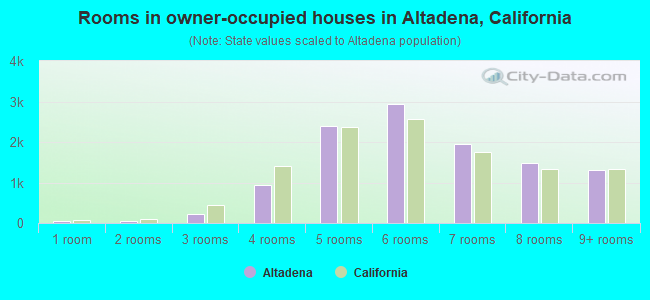
Housing units in structures:
One, detached: 13,803
One, attached: 617
Two: 225
3 or 4: 433
5 to 9: 116
10 to 19: 204
20 to 49: 290
50 or more: 179
Mobile homes: 36
Boats, RVs, vans, etc.: 8
Housing units lacking complete plumbing facilities in 2022: 0.4%
Housing units lacking complete kitchen facilities in 2022: 1.1%
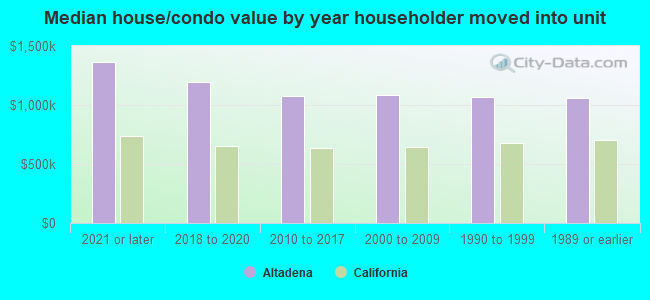
House/condo owner moved in on average 18 years ago