Alpine, CA (California) Houses and Residents
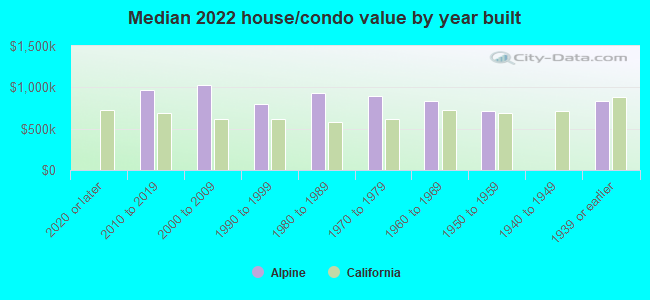
| Alpine: | $885,941 |
| California: | $715,900 |
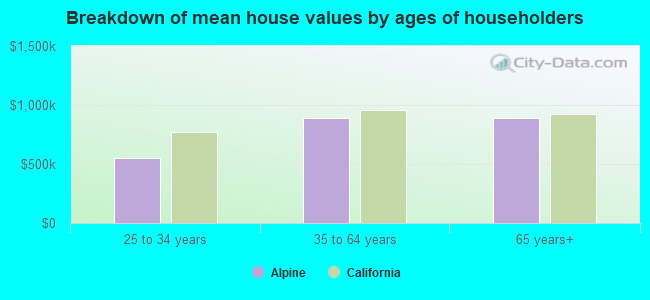
Mean price in 2022:
Detached houses: $976,668
Here: $976,668 State: $988,808 Townhouses or other attached units: $346,537
Here: $346,537 State: $838,546 In 5-or-more-unit structures: $241,819
Here: $241,819 State: $730,996 Mobile homes: $304,660
Here: $304,660 State: $184,506
Total population: 14,236 (Urban population: 10,639, Rural population: 2,518 (all nonfarm))
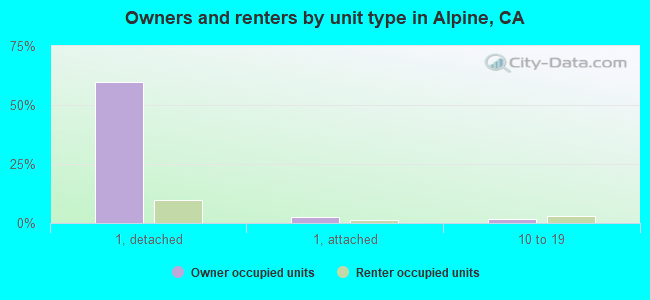
Houses: 5,751 (5,539 occupied: 3,975 owner occupied, 1,598 renter occupied)
| % of renters here: | 29% |
| State: | 44% |
Housing density: 214 houses/condos per square mile
Median price asked for vacant for-sale houses and condos in 2022 in this county: $1,340,665.
Median contract rent in 2022: $1,802 (lower quartile is $1,530, upper quartile is over $2,000)
Median rent asked for vacant for-rent units in 2022: $1,712
Median gross rent in Alpine, CA in 2022: $1,957
Housing units in Alpine with a mortgage: 3,003 (320 second mortgage, 7 home equity loan, 310 both second mortgage and home equity loan)
Houses without a mortgage: 60
Median household income for houses/condos with a mortgage: $133,989
Median household income for apartments without a mortgage: $75,360
Median monthly housing costs: $2,268
Compare current foreclosures near Alpine, CA:
| Photo | Address | Area | Beds / Baths | Price | Details |
|---|---|---|---|---|---|

|
#1
E Victoria Dr
Alpine, CA 91901
|
1,092 sq. feet
|
2 baths 2 beds |
show details | |

|
#2
Marshall Rd Unit 14
Alpine, CA 91901
|
1,005 sq. feet
|
2 baths 2 beds |
show details | |

|
#3
Columbine Rd
Alpine, CA 91901
|
1,706 sq. feet
|
2 baths 3 beds |
show details | |

|
#4
Arnold Way
Alpine, CA 91901
|
1,422 sq. feet
|
2 baths 3 beds |
show details | |

|
#5
Columbine Dr
Alpine, CA 91901
|
1,706 sq. feet
|
2 baths 3 beds |
show details | |

|
#6
Marshall Rd Apt 233
Alpine, CA 91901
|
- sq. feet
|
- baths - beds |
show details | |

|
#7
Emmanuel Way
Alpine, CA 91901
|
2,483 sq. feet
|
- baths - beds |
show details | |

|
#8
Plaza Manzana
Alpine, CA 91901
|
- sq. feet
|
- baths - beds |
show details | |

|
#9
Tavern Rd Apt 58
Alpine, CA 91901
|
- sq. feet
|
- baths - beds |
show details | |

|
#10
Arnold Way # 6
Alpine, CA 91901
|
- sq. feet
|
- baths - beds |
show details |
| Photo | Address | Area | Beds / Baths | Price | Details |
|---|---|---|---|---|---|

|
#11
Arnold Way Apt 2303
Alpine, CA 91901
|
- sq. feet
|
- baths - beds |
show details | |

|
#12
Arnold Way Apt 101
Alpine, CA 91901
|
- sq. feet
|
- baths - beds |
show details | |

|
#13
Real Way Ln
Alpine, CA 91901
|
- sq. feet
|
- baths - beds |
show details | |

|
#14
Rangeview St
Spring Valley, CA 91977
|
- sq. feet
|
1 baths 3 beds |
show details | |

|
#15
Joliet St
El Cajon, CA 92019
|
1,408 sq. feet
|
1 baths 3 beds |
show details | |

|
#16
Lakeview Rd
Lakeside, CA 92040
|
852 sq. feet
|
1 baths 2 beds |
show details | |

|
#17
Sacramento Ave
Spring Valley, CA 91977
|
1,380 sq. feet
|
1 baths 3 beds |
show details | |

|
#18
Alton Dr
Lemon Grove, CA 91945
|
1,723 sq. feet
|
2 baths 3 beds |
show details | |

|
#19
Rancho Diego Cir
El Cajon, CA 92019
|
2,955 sq. feet
|
2 baths 4 beds |
show details | |

|
#20
Normal Ave
La Mesa, CA 91941
|
1,766 sq. feet
|
2 baths 3 beds |
show details |
| Photo | Address | Area | Beds / Baths | Price | Details |
|---|---|---|---|---|---|

|
#21
E Madison Ave
El Cajon, CA 92020
|
1,152 sq. feet
|
2 baths 3 beds |
show details | |

|
#22
N Paradise Ridge Way
Chula Vista, CA 91915
|
3,258 sq. feet
|
3 baths 3 beds |
show details | |

|
#23
E Chase Ave
El Cajon, CA 92020
|
2,617 sq. feet
|
3 baths 4 beds |
show details | |

|
#24
Ramona Dr
Spring Valley, CA 91977
|
1,124 sq. feet
|
2 baths 3 beds |
show details | |

|
#25
Manzanita Way
Jamul, CA 91935
|
2,400 sq. feet
|
2 baths 4 beds |
show details | |

|
#26
Baltimore Dr Unit 75
La Mesa, CA 91942
|
1,612 sq. feet
|
3 baths 3 beds |
show details | |

|
#27
Rancho Canada Rd
El Cajon, CA 92021
|
1,421 sq. feet
|
2 baths 4 beds |
show details | |

|
#28
Alvarado Rd Unit 2
San Diego, CA 92120
|
1,120 sq. feet
|
1 baths 2 beds |
show details | |

|
#29
D St
Ramona, CA 92065
|
396 sq. feet
|
1 baths 2 beds |
show details | |

|
#30
Spring Oaks Rd Spc 150
El Cajon, CA 92021
|
1,776 sq. feet
|
2 baths 3 beds |
show details |
| Photo | Address | Area | Beds / Baths | Price | Details |
|---|---|---|---|---|---|

|
#31
Lawson Valley Rd
Jamul, CA 91935
|
1,975 sq. feet
|
2 baths 3 beds |
show details | |

|
#32
Mitra Ct
Spring Valley, CA 91977
|
1,760 sq. feet
|
2 baths 3 beds |
show details | |

|
#33
Skyview St
El Cajon, CA 92020
|
2,200 sq. feet
|
2 baths 4 beds |
show details | |

|
#34
Mono Lake Dr
San Diego, CA 92119
|
1,714 sq. feet
|
2 baths 3 beds |
show details | |

|
#35
Lakeview Dr
Spring Valley, CA 91977
|
- sq. feet
|
2 baths 4 beds |
show details | |

|
#36
Silva Rd
El Cajon, CA 92021
|
3,158 sq. feet
|
3 baths 4 beds |
show details | |

|
#37
Austin Dr
Spring Valley, CA 91977
|
2,356 sq. feet
|
2 baths 3 beds |
show details | |

|
#38
Mussey Grade Rd
Ramona, CA 92065
|
1,664 sq. feet
|
1 baths 2 beds |
show details | |

|
#39
Griffith Rd
Ramona, CA 92065
|
1,538 sq. feet
|
2 baths 3 beds |
show details | |

|
#40
Pebble Beach Dr
Santee, CA 92071
|
1,137 sq. feet
|
2 baths 3 beds |
show details |
| Photo | Address | Area | Beds / Baths | Price | Details |
|---|---|---|---|---|---|

|
#41
S Tropico Dr
La Mesa, CA 91941
|
1,570 sq. feet
|
2 baths 3 beds |
show details | |

|
#42
Merritt Blvd
La Mesa, CA 91941
|
1,109 sq. feet
|
1 baths 3 beds |
show details | |

|
#43
Creelman Ln
Ramona, CA 92065
|
1,215 sq. feet
|
1 baths 1 beds |
show details | |

|
#44
Kelton Ave
La Mesa, CA 91942
|
1,056 sq. feet
|
1 baths 3 beds |
show details | |

|
#45
Cristobal Way
Spring Valley, CA 91977
|
1,839 sq. feet
|
2 baths 4 beds |
show details | |

|
#46
Citrus Tree Ln
Spring Valley, CA 91977
|
1,062 sq. feet
|
2 baths 2 beds |
show details | |

|
#47
Quail View St
Spring Valley, CA 91977
|
3,177 sq. feet
|
3 baths 4 beds |
show details | |

|
#48
Hudson Dr
San Diego, CA 92119
|
2,064 sq. feet
|
2 baths 4 beds |
show details | |

|
#49
10th St
Ramona, CA 92065
|
1,748 sq. feet
|
1 baths 3 beds |
show details | |

|
Check over 1 million property listings on Foreclosure.com!
|
browse all offers | |||

Latest news about housing in Alpine, CA collected exclusively by city-data.com from local newspapers, TV, and radio stations


Median year apartment built: 1985
Household type by relationship:
Households: 15,845- Male householders: 2,611 (434 living alone), Female householders: 2,830 (618 living alone)
3,323 spouses (3,235 opposite-sex spouses), 396 unmarried partners, (396 opposite-sex unmarried partners), 4,620 children (4,332 natural, 125 adopted, 163 stepchildren), 385 grandchildren, 42 brothers or sisters, 329 parents, 37 foster children, 497 other relatives, 528 non-relatives
- In group quarters: 241
Size of family households: 1,742 2-persons, 867 3-persons, 948 4-persons, 344 5-persons, 185 6-persons, 65 7-or-more-persons.
Size of nonfamily households: 1,080 1-person, 290 2-persons, 41 3-persons.
2,267 married couples with children.
755 single-parent households (435 men, 320 women).
82.0% of residents of Alpine speak English at home.
11.9% of residents speak Spanish at home (67% speak English very well, 15% speak English well, 14% speak English not well, 4% don't speak English at all).
3.2% of residents speak other Indo-European language at home (91% speak English very well, 9% speak English well).
2.4% of residents speak Asian or Pacific Island language at home (37% speak English very well, 54% speak English well, 9% speak English not well).
0.2% of residents speak other language at home (100% speak English very well).
Foreign born population: 1,307 (8.2%)
(71.3% of them are naturalized citizens)
| Here: | 6.4 |
| State: | 6.0 |
| Here: | 4.2 |
| State: | 3.9 |
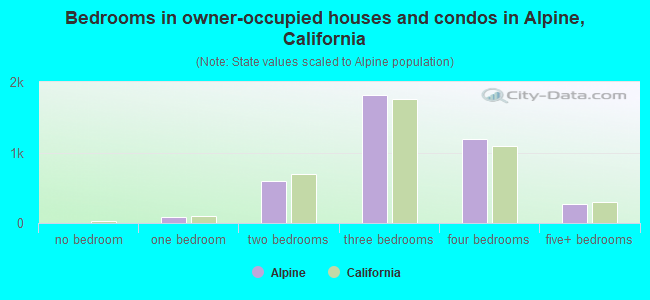
- Bedrooms in owner-occupied houses and condos in Alpine, California
- 0no bedroom
- 901 bedroom
- 6012 bedrooms
- 1,8203 bedrooms
- 1,1914 bedrooms
- 2745+ bedrooms
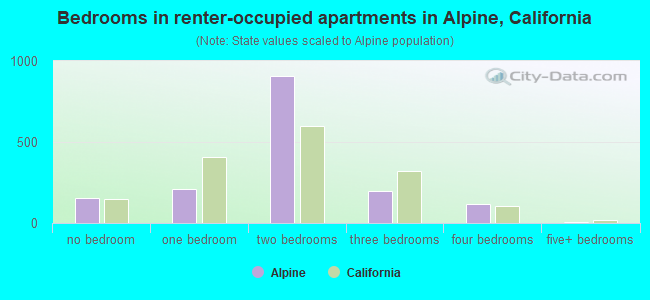
- Bedrooms in renter-occupied apartments in Alpine, California
- 156no bedroom
- 2111 bedroom
- 9062 bedrooms
- 1963 bedrooms
- 1204 bedrooms
- 95+ bedrooms
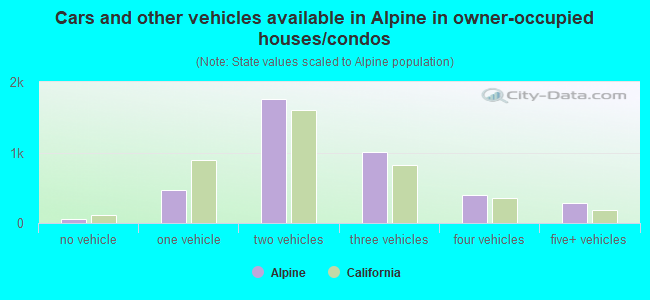
- Cars and other vehicles available in Alpine in owner-occupied houses/condos
- 53no vehicle
- 4751 vehicle
- 1,7552 vehicles
- 1,0103 vehicles
- 3994 vehicles
- 2845+ vehicles
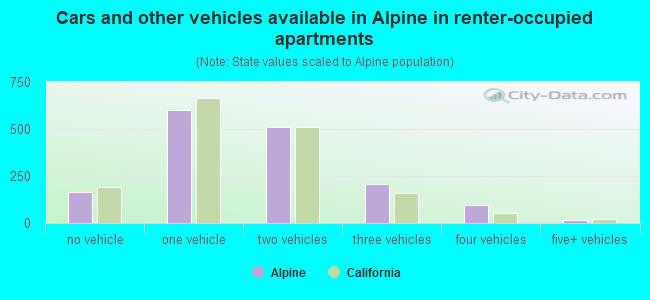
- Cars and other vehicles available in Alpine in renter-occupied apartments
- 165no vehicle
- 6021 vehicle
- 5132 vehicles
- 2063 vehicles
- 944 vehicles
- 185+ vehicles
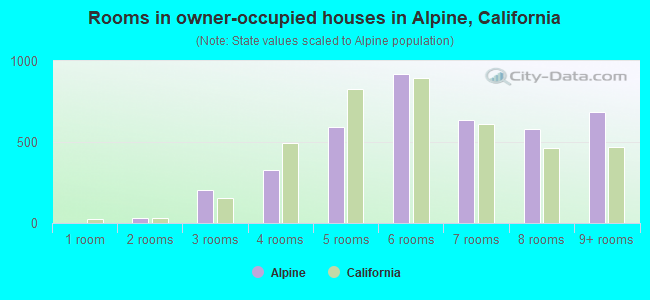
- Rooms in owner-occupied houses in Alpine, California
- 01 room
- 302 rooms
- 2063 rooms
- 3264 rooms
- 5905 rooms
- 9226 rooms
- 6347 rooms
- 5838 rooms
- 6869+ rooms
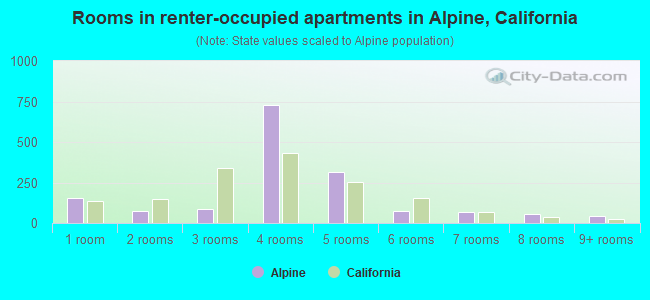
- Rooms in renter-occupied apartments in Alpine, California
- 1561 room
- 772 rooms
- 893 rooms
- 7304 rooms
- 3125 rooms
- 736 rooms
- 677 rooms
- 538 rooms
- 419+ rooms
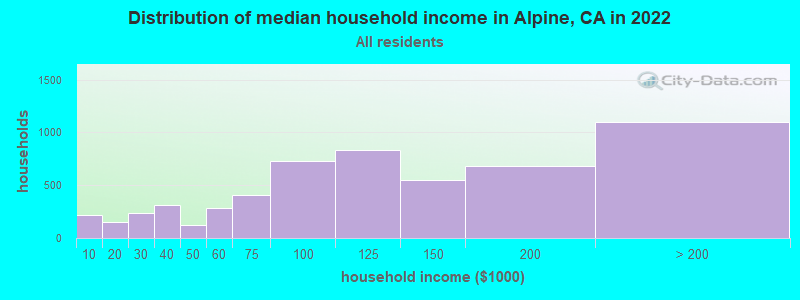
Alpine, CA household income distribution

- 213Less than $10,000
- 147$10,000 to $19,999
- 232$20,000 to $29,999
- 310$30,000 to $39,999
- 119$40,000 to $49,999
- 284$50,000 to $59,999
- 407$60,000 to $74,999
- 731$75,000 to $99,999
- 831$100,000 to $124,999
- 552$125,000 to $149,999
- 678$150,000 to $199,999
- 1,098$200,000 or more
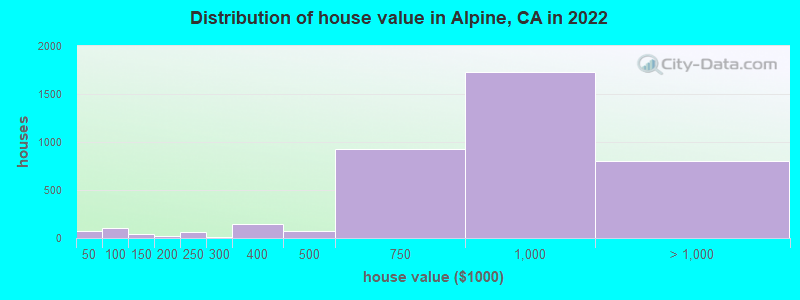
Home value of owner - occupied houses in 2022 in Alpine, CA
-
- 13Less than $10,000
- 50$20,000 to $24,999
- 4$40,000 to $49,999
- 17$60,000 to $69,999
- 24$70,000 to $79,999
- 32$80,000 to $89,999
- 22$90,000 to $99,999
- 12$100,000 to $124,999
- 25$125,000 to $149,999
- 17$150,000 to $174,999
- 67$200,000 to $249,999
- 9$250,000 to $299,999
- 145$300,000 to $399,999
- 77$400,000 to $499,999
- 925$500,000 to $749,999
- 1,726$750,000 to $999,999
- 575$1,000,000 to $1,499,999
- 143$1,500,000 to $1,999,999
- 88$2,000,000 or more
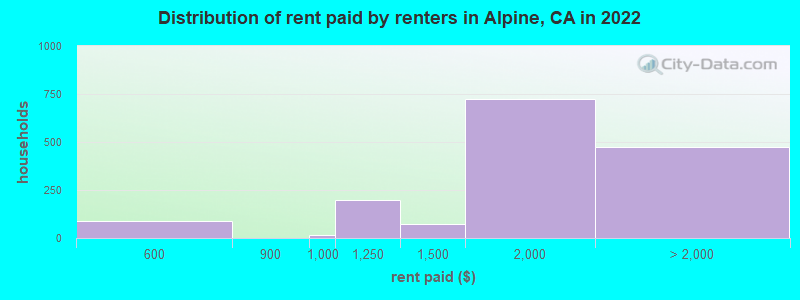
Rent paid by renters in 2022 in Alpine, CA
-
- 89$500 to $549
- 13$900 to $999
- 196$1,000 to $1,249
- 71$1,250 to $1,499
- 722$1,500 to $1,999
- 283$2,000 to $2,499
- 97$2,500 to $2,999
- 84$3,000 to $3,499
- 11$3,500 or more
Percentage of workers working in this county: 99.6%
Number of people working at home: 728 (10.0% of all workers)
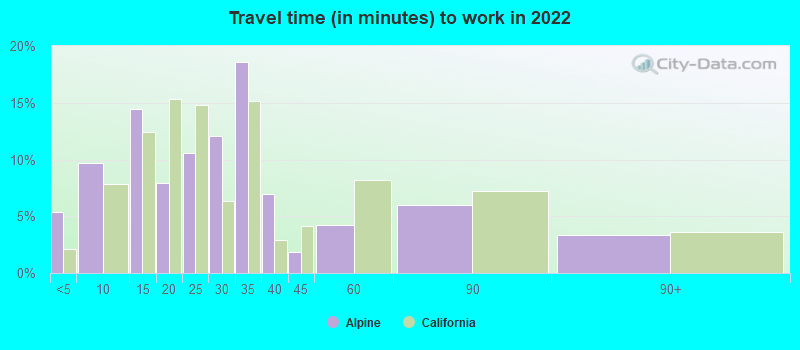
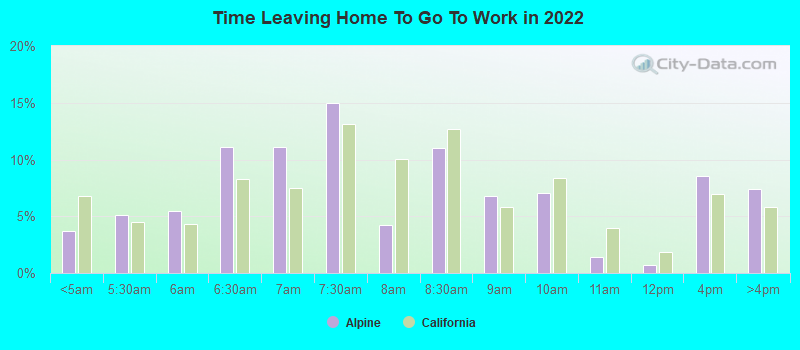
Travel time to work (commute)
- Less than 5 minutes: 224
- 5 to 9 minutes: 469
- 10 to 14 minutes: 761
- 15 to 19 minutes: 305
- 20 to 24 minutes: 858
- 25 to 29 minutes: 574
- 30 to 34 minutes: 1,111
- 35 to 39 minutes: 441
- 40 to 44 minutes: 463
- 45 to 59 minutes: 626
- 60 to 89 minutes: 529
- 90 or more minutes: 7
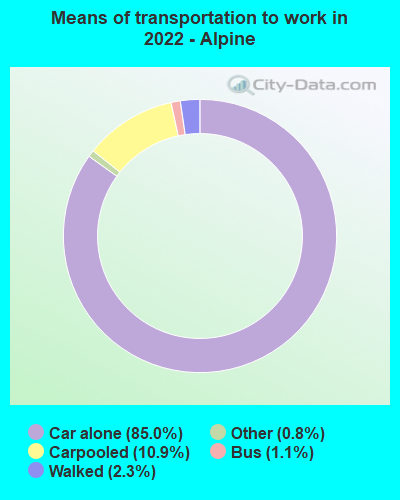
Means of transportation to work:
- Drove a car alone: 2,251 (66.8%)
- Carpooled: 300 (8.9%)
- Bus: 25 (0.7%)
- Taxi: 22 (0.7%)
- Walked: 66 (2.0%)
- Worked at home: 728 (21.6%)
- Unemployment by race in 2022
- Unemployment rate for White non-Hispanic residents
- 3.0%Males
- 5.8%Females
- Unemployment rate for Black residents
- 7.8%Males
- 24.0%Females
- Unemployment rate for Asian residents
- 2.9%Females
- Unemployment rate for other race residents
- 6.5%Males
- Unemployment rate for two or more race residents
- 18.8%Males
- Unemployment rate for Hispanic or Latino residents
- 9.9%Males
- 2.8%Females
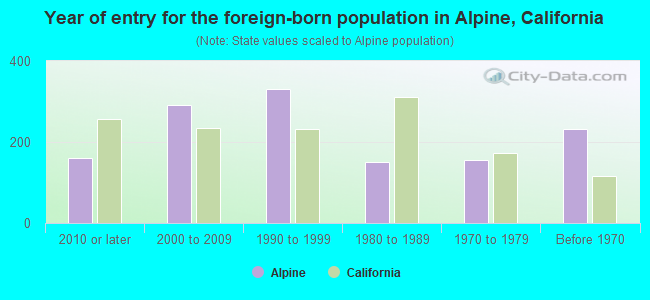
- Year of entry for the foreign-born population in Alpine, California
- 1612010 or later
- 2922000 to 2009
- 3321990 to 1999
- 1501980 to 1989
- 1551970 to 1979
- 232Before 1970
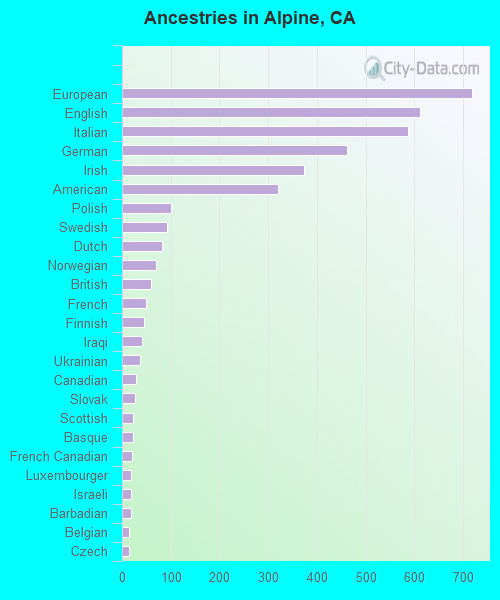
First ancestries reported:
- European: 717 (11.0%)
- English: 611 (9.4%)
- Italian: 587 (9.0%)
- German: 461 (7.1%)
- Irish: 374 (5.7%)
- American: 319 (4.9%)
- Polish: 101 (1.5%)
- Swedish: 93 (1.4%)
- Dutch: 83 (1.3%)
- Norwegian: 69 (1.1%)
- British: 59 (0.9%)
- French: 49 (0.8%)
- Finnish: 45 (0.7%)
- Iraqi: 41 (0.6%)
- Ukrainian: 37 (0.6%)
- Canadian: 28 (0.4%)
- Slovak: 27 (0.4%)
- Scottish: 23 (0.4%)
- Basque: 22 (0.3%)
- French Canadian: 20 (0.3%)
- Luxembourger: 19 (0.3%)
- Israeli: 18 (0.3%)
- Barbadian: 18 (0.3%)
- Belgian: 15 (0.2%)
- Czech: 15 (0.2%)
- Swiss: 14 (0.2%)
- Welsh: 14 (0.2%)
- Cajun: 10 (0.2%)
- Northern European: 10 (0.2%)
- Portuguese: 10 (0.2%)
- Scotch-Irish: 10 (0.2%)
- Austrian: 9 (0.1%)
- Eastern European: 8 (0.1%)
- Scandinavian: 8 (0.1%)
Most common places of birth for foreign-born residents (%):
| Alpine: | 43.9% (574) |
| California: | 37.2% (3,881,193) |
| Alpine: | 12.1% (158) |
| California: | 7.8% (818,297) |
| Alpine: | 9.4% (123) |
| California: | 1.2% (127,477) |
| Alpine: | 9.1% (119) |
| California: | 0.1% (5,643) |
| Alpine: | 4.4% (58) |
| California: | 0.7% (73,304) |
| Alpine: | 3.2% (42) |
| California: | 6.6% (684,672) |
| Alpine: | 3.2% (42) |
| California: | 3.0% (315,248) |
| Alpine: | 2.1% (28) |
| California: | 0.1% (9,241) |
| Alpine: | 2.0% (26) |
| California: | 0.5% (49,399) |
Place of birth for U.S.-born residents:
- This state: 11,115
- Other state: 3,383
- Northeast: 816
- Midwest: 1,143
- South: 612
- West: 794
86.0% of Alpine residents lived in the same house 1 years ago.
Out of people who lived in different houses, 44.1% lived in this county.
Out of people who lived in different counties, 16.4% lived in California.
| Alpine: | 86.0% |
| State average: | 88.9% |
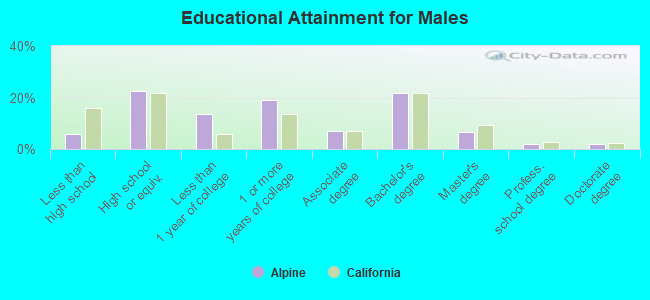
Education attainment for males 25 years and older:
- No schooling: 99
- Nursery to 4th grade: 21
- 5th and 6th grade: 0
- 7th and 8th grade: 0
- 9th grade: 11
- 10th grade: 33
- 11th grade: 30
- 12th grade, no diploma: 123
- High school graduate (or equivalency): 1,185
- Less than 1 year of college: 729
- Some college more than 1 year, no degree: 1,013
- Associate degree: 367
- Bachelor's degree: 1,154
- Master's degree: 341
- Professional school degree: 96
- Doctorate degree: 96
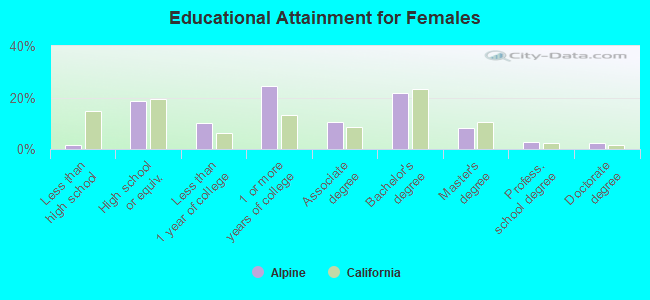
Education attainment for females 25 years and older:
- No schooling: 32
- Nursery to 4th grade: 0
- 5th and 6th grade: 0
- 7th and 8th grade: 4
- 9th grade: 0
- 10th grade: 6
- 11th grade: 18
- 12th grade, no diploma: 26
- High school graduate (or equivalency): 1,068
- Less than 1 year of college: 586
- Some college more than 1 year, no degree: 1,416
- Associate degree: 601
- Bachelor's degree: 1,250
- Master's degree: 481
- Professional school degree: 165
- Doctorate degree: 129
Housing units in structures:
- One, detached: 4,096
- One, attached: 235
- Two: 65
- 3 or 4: 96
- 5 to 9: 263
- 10 to 19: 265
- 20 to 49: 79
- 50 or more: 332
- Mobile homes: 284
- Boats, RVs, vans, etc.: 31
Median worth of mobile homes: $126,598
Housing units lacking complete kitchen facilities in 2022: 1.9%
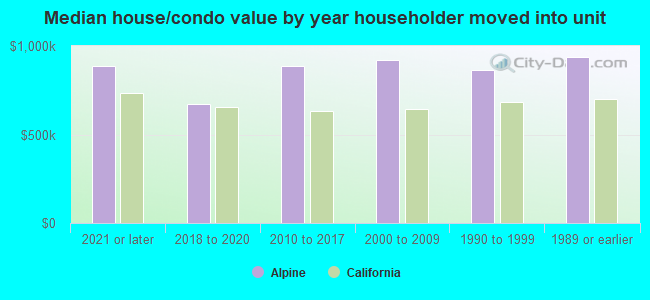
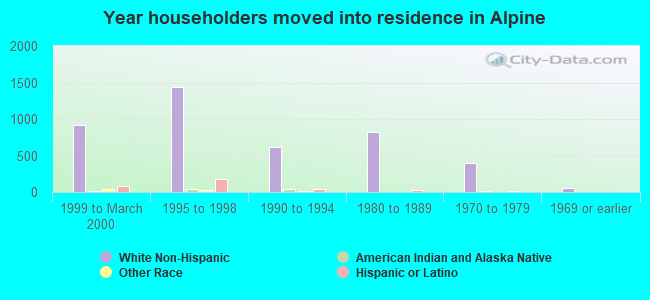
House/condo owner moved in on average 14 years ago
Renter moved in on average 2 years ago
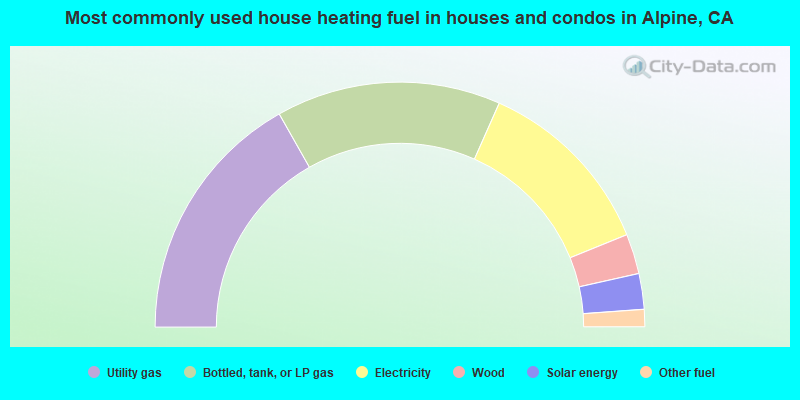
- 33.6%Utility gas
- 29.7%Bottled, tank, or LP gas
- 24.4%Electricity
- 5.3%Wood
- 4.7%Solar energy
- 2.3%Other fuel
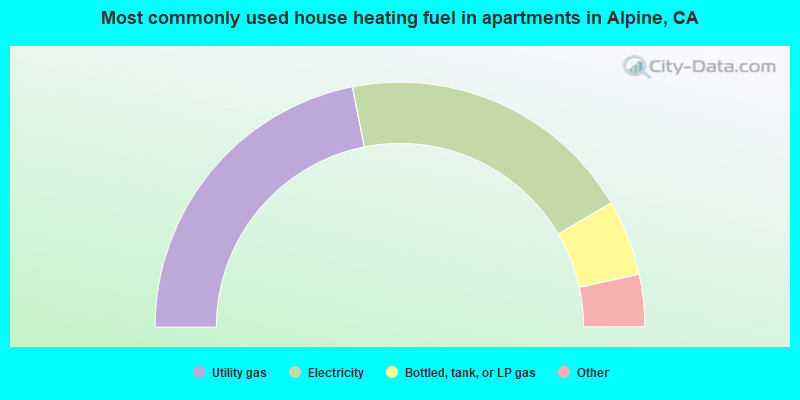
- 43.8%Utility gas
- 39.3%Electricity
- 10.0%Bottled, tank, or LP gas
- 3.6%No fuel used
- 2.5%Other fuel
- 0.8%Wood
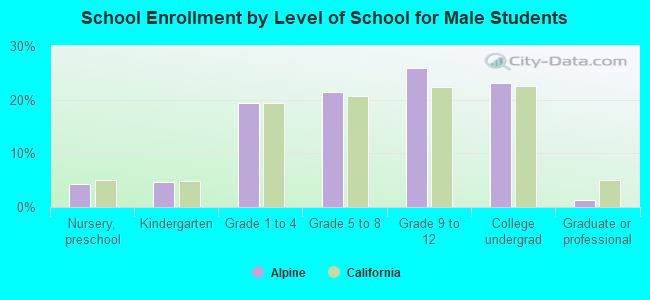
Private vs. public school enrollment:
| Here: | 23.5% |
| California: | 10.5% |
| Here: | 26.3% |
| California: | 8.5% |
| Here: | 19.9% |
| California: | 15.9% |