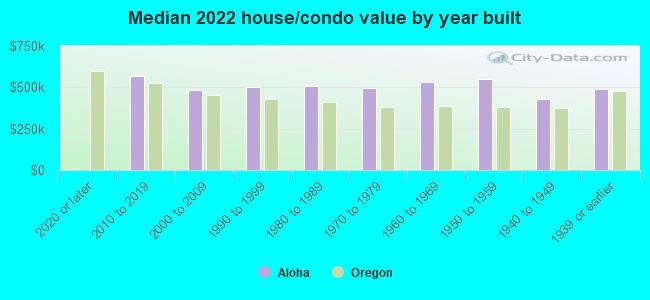
Aloha, OR (Oregon) Houses and Residents
| Aloha: | $509,120 |
| Oregon: | $475,600 |
Mean price in 2022:
Detached houses: $455,011
Here: $455,011 State: $562,872 Townhouses or other attached units: $330,248
Here: $330,248 State: $463,029 In 2-unit structures: $593,183
Here: $593,183 State: $505,105 In 5-or-more-unit structures: $203,051
Here: $203,051 State: $420,389 Mobile homes: $181,155
Here: $181,155 State: $214,044
Total population: 49,425 (Urban population: 42,097, Rural population: 0)
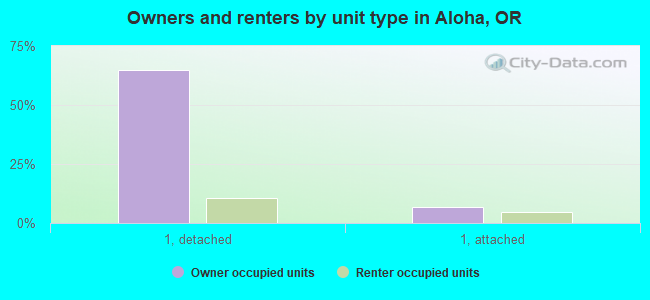
Houses: 19,638 (18,940 occupied: 12,721 owner occupied, 6,337 renter occupied)
| % of renters here: | 33% |
| State: | 37% |
Housing density: 2,663 houses/condos per square mile
Median price asked for vacant for-sale houses and condos in 2022: $431,911.
Median contract rent in 2022: $1,542 (lower quartile is $1,248, upper quartile is $1,886)
Median rent asked for vacant for-rent units in 2022: $1,622
Median gross rent in Aloha, OR in 2022: $1,751
Housing units in Aloha with a mortgage: 9,408 (1,101 second mortgage, 49 home equity loan, 937 both second mortgage and home equity loan)
Houses without a mortgage: 99
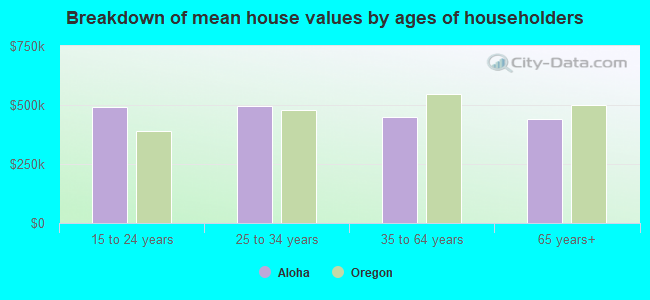
Median household income for houses/condos with a mortgage: $112,180
Median household income for apartments without a mortgage: $69,873
Median monthly housing costs: $1,763
Compare current foreclosures near Aloha, OR:
| Photo | Address | Area | Beds / Baths | Price | Details |
|---|---|---|---|---|---|

|
#1
SE Renada St
Portland, OR 97267
|
2,439 sq. feet
|
2 baths 3 beds |
$449,500
|
show details |

|
#2
SE 116th Ave
Portland, OR 97266
|
1,678 sq. feet
|
1 baths 4 beds |
$485,000
|
show details |

|
#3
SW 1st Ave Apt 2125
Portland, OR 97201
|
1,950 sq. feet
|
2 baths 3 beds |
$695,000
|
show details |

|
#4
W Burnside Rd Unit 527
Portland, OR 97210
|
1,288 sq. feet
|
2 baths 2 beds |
show details | |

|
#5
Carlson Rd
Vancouver, WA 98661
|
1,032 sq. feet
|
1 baths 3 beds |
show details | |

|
#6
SE 83rd Ave
Portland, OR 97216
|
1,510 sq. feet
|
1 baths 4 beds |
show details | |

|
#7
SE Brookwood Ave Apt 111
Hillsboro, OR 97123
|
- sq. feet
|
2 baths 3 beds |
show details | |

|
#8
SW Silent Fox Terrace
Sherwood, OR 97140
|
1,415 sq. feet
|
3 baths 2 beds |
show details | |

|
#9
SW Rein Rd
Sherwood, OR 97140
|
5,074 sq. feet
|
4 baths 7 beds |
show details | |

|
#10
NE Mallory Ave
Portland, OR 97211
|
2,118 sq. feet
|
2 baths 5 beds |
show details |
| Photo | Address | Area | Beds / Baths | Price | Details |
|---|---|---|---|---|---|

|
#11
SW Fallen Leaf St
Wilsonville, OR 97070
|
3,340 sq. feet
|
3 baths 4 beds |
show details | |

|
#12
Norris Rd
Vancouver, WA 98661
|
1,116 sq. feet
|
1 baths 3 beds |
show details | |

|
#13
SW Fradeen Ln
Portland, OR 97225
|
4,684 sq. feet
|
4 baths 3 beds |
show details | |

|
#14
Kenwood Rd
Lake Oswego, OR 97034
|
1,978 sq. feet
|
2 baths 3 beds |
show details | |

|
#15
NW Phillips Rd
Gaston, OR 97119
|
1,645 sq. feet
|
2 baths 3 beds |
show details | |

|
#16
SE Portland Ave
Portland, OR 97267
|
1,080 sq. feet
|
1 baths 3 beds |
show details | |

|
#17
NE 49th St
Vancouver, WA 98661
|
1,928 sq. feet
|
2 baths 3 beds |
show details | |

|
#18
SW Derby St
Beaverton, OR 97005
|
1,073 sq. feet
|
2 baths 3 beds |
show details | |

|
#19
SE Liebe St
Portland, OR 97266
|
606 sq. feet
|
1 baths 2 beds |
show details | |

|
#20
NE 66th Ave
Hillsboro, OR 97124
|
1,680 sq. feet
|
3 baths 3 beds |
show details |
| Photo | Address | Area | Beds / Baths | Price | Details |
|---|---|---|---|---|---|

|
#21
E 24th St
Vancouver, WA 98661
|
720 sq. feet
|
1 baths 2 beds |
show details | |

|
#22
NE Darby St
Hillsboro, OR 97124
|
1,876 sq. feet
|
2 baths 5 beds |
show details | |

|
#23
NW Brooks Rd
Portland, OR 97231
|
2,058 sq. feet
|
4 baths 4 beds |
show details | |

|
#24
NE Dog Ridge Rd
Newberg, OR 97132
|
4,208 sq. feet
|
3 baths 3 beds |
show details | |

|
#25
SW Bellavista Ct
Beaverton, OR 97007
|
4,064 sq. feet
|
2 baths 3 beds |
show details | |

|
#26
NE Kathryn St
Hillsboro, OR 97124
|
1,820 sq. feet
|
2 baths 4 beds |
show details | |

|
#27
SW Meadow St
Portland, OR 97223
|
- sq. feet
|
1 baths 3 beds |
show details | |

|
#28
O St
Vancouver, WA 98663
|
784 sq. feet
|
1 baths 1 beds |
show details | |

|
#29
NE 22nd Ct
Vancouver, WA 98665
|
3,073 sq. feet
|
4 baths 5 beds |
show details | |

|
#30
SE 16th Ave
Hillsboro, OR 97123
|
1,044 sq. feet
|
2 baths 4 beds |
show details |
| Photo | Address | Area | Beds / Baths | Price | Details |
|---|---|---|---|---|---|

|
#31
SW Perfecta Ave
Beaverton, OR 97005
|
1,552 sq. feet
|
2 baths 3 beds |
show details | |

|
#32
NE 23rd Ave
Vancouver, WA 98663
|
1,280 sq. feet
|
1 baths 3 beds |
show details | |

|
#33
Canal Cir
Lake Oswego, OR 97035
|
1,774 sq. feet
|
3 baths 3 beds |
show details | |

|
#34
NW Nelscott St
Portland, OR 97229
|
1,503 sq. feet
|
2 baths 3 beds |
show details | |

|
#35
2nd St
Oregon City, OR 97045
|
2,712 sq. feet
|
3 baths 2 beds |
show details | |

|
#36
NE Laura St
Hillsboro, OR 97124
|
1,014 sq. feet
|
2 baths 3 beds |
show details | |

|
#37
SE 76th Ave
Portland, OR 97206
|
1,504 sq. feet
|
1 baths 2 beds |
show details | |

|
#38
SW Courtside Dr Apt 26
Wilsonville, OR 97070
|
- sq. feet
|
1 baths 1 beds |
show details | |

|
#39
SE Wallace Rd
Portland, OR 97267
|
2,816 sq. feet
|
3 baths 3 beds |
show details | |

|
#40
NW Irving St Apt 320
Portland, OR 97209
|
- sq. feet
|
1 baths 1 beds |
show details |
| Photo | Address | Area | Beds / Baths | Price | Details |
|---|---|---|---|---|---|

|
#41
SE 73rd Ave
Portland, OR 97222
|
- sq. feet
|
1 baths 2 beds |
show details | |

|
#42
SE Talbert St
Clackamas, OR 97015
|
767 sq. feet
|
1 baths 1 beds |
show details | |

|
#43
NE Holman St
Portland, OR 97218
|
1,272 sq. feet
|
2 baths 2 beds |
show details | |

|
#44
Fairway Road
West Linn, OR 97068
|
2,037 sq. feet
|
2 baths 3 beds |
show details | |

|
#45
SE Brookwood Ave
Hillsboro, OR 97123
|
2,538 sq. feet
|
2 baths 3 beds |
show details | |

|
#46
SE Brandeis St
Clackamas, OR 97015
|
1,056 sq. feet
|
1 baths 3 beds |
show details | |

|
#47
SE Spruce St
Hillsboro, OR 97123
|
2,026 sq. feet
|
2 baths 3 beds |
show details | |

|
#48
SE Logan Ln
Dundee, OR 97115
|
1,200 sq. feet
|
2 baths 3 beds |
show details | |

|
#49
N Seward Ave
Portland, OR 97217
|
2,104 sq. feet
|
2 baths 3 beds |
show details | |

|
Check over 1 million property listings on Foreclosure.com!
|
browse all offers | |||

Latest news about housing in Aloha, OR collected exclusively by city-data.com from local newspapers, TV, and radio stations

 | McMinnville vs Newberg? Rental houses? (4 replies) |
| Apartment Suggestions near Aloha and Tanasbourne (26 replies) |
| Looking for apartments around Portland with view (14 replies) |
| Rent increase by $500 for our 2 bd apt. (69 replies) |
| Portland vs Seattle vs Bellingham for retired renter (47 replies) |
| the best of Beaverton/Aloha? (97 replies) |
Median year apartment built: 1986
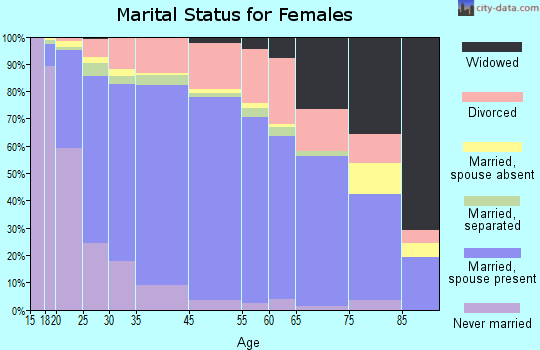
Household type by relationship:
Households: 53,588- Male householders: 9,496 (1,464 living alone), Female householders: 9,004 (1,980 living alone)
9,921 spouses (9,760 opposite-sex spouses), 1,936 unmarried partners, (1,837 opposite-sex unmarried partners), 15,250 children (14,313 natural, 323 adopted, 613 stepchildren), 1,136 grandchildren, 966 brothers or sisters, 1,457 parents, 133 foster children, 1,111 other relatives, 2,592 non-relatives
- In group quarters: 583
Size of family households: 5,015 2-persons, 3,136 3-persons, 2,647 4-persons, 1,500 5-persons, 492 6-persons, 211 7-or-more-persons.
Size of nonfamily households: 3,724 1-person, 1,727 2-persons, 204 3-persons, 70 4-persons, 131 5-persons, 24 7-or-more-persons.
7,220 married couples with children.
3,002 single-parent households (1,321 men, 1,681 women).
66.8% of residents of Aloha speak English at home.
19.7% of residents speak Spanish at home (70% speak English very well, 15% speak English well, 8% speak English not well, 7% don't speak English at all).
3.3% of residents speak other Indo-European language at home (69% speak English very well, 16% speak English well, 8% speak English not well, 7% don't speak English at all).
8.2% of residents speak Asian or Pacific Island language at home (52% speak English very well, 32% speak English well, 16% speak English not well, 1% don't speak English at all).
2.7% of residents speak other language at home (53% speak English very well, 28% speak English well, 19% speak English not well).
Foreign born population: 11,763 (22.0%)
(60.0% of them are naturalized citizens)
| Here: | 6.2 |
| State: | 6.2 |
| Here: | 4.5 |
| State: | 4.0 |
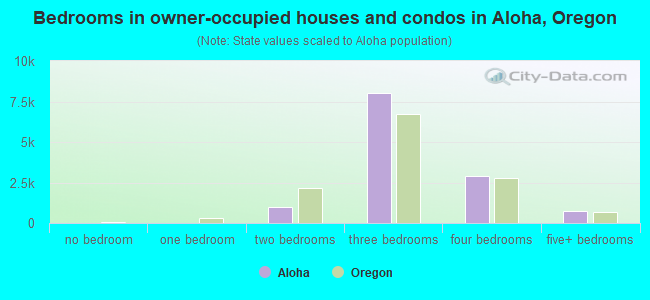
- Bedrooms in owner-occupied houses and condos in Aloha, Oregon
- 10no bedroom
- 01 bedroom
- 1,0082 bedrooms
- 8,0283 bedrooms
- 2,9114 bedrooms
- 7645+ bedrooms
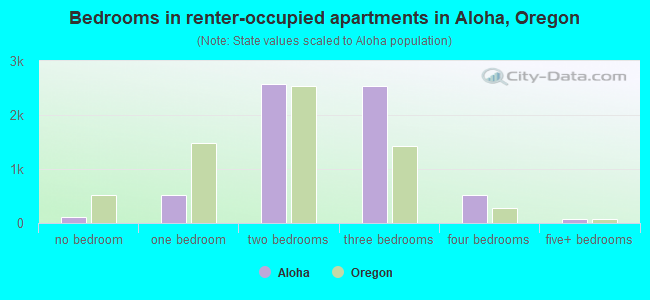
- Bedrooms in renter-occupied apartments in Aloha, Oregon
- 109no bedroom
- 5201 bedroom
- 2,5752 bedrooms
- 2,5433 bedrooms
- 5204 bedrooms
- 705+ bedrooms
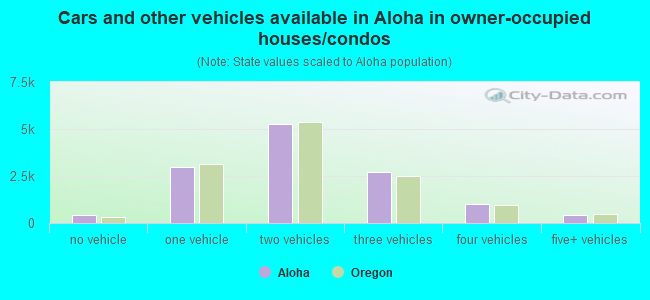
- Cars and other vehicles available in Aloha in owner-occupied houses/condos
- 401no vehicle
- 2,9781 vehicle
- 5,2412 vehicles
- 2,6893 vehicles
- 1,0004 vehicles
- 4135+ vehicles
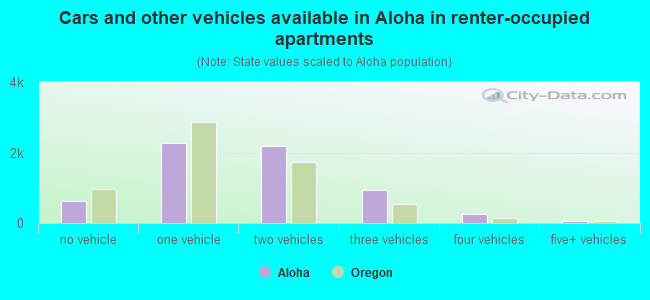
- Cars and other vehicles available in Aloha in renter-occupied apartments
- 617no vehicle
- 2,2761 vehicle
- 2,1792 vehicles
- 9373 vehicles
- 2684 vehicles
- 605+ vehicles
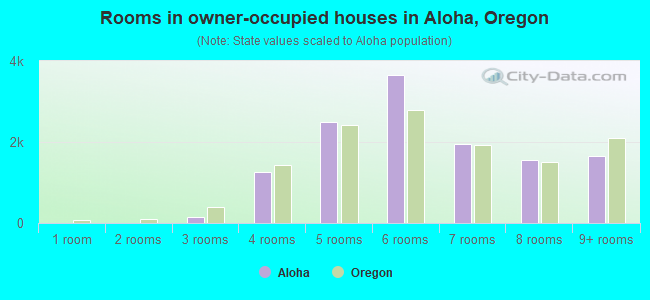
- Rooms in owner-occupied houses in Aloha, Oregon
- 101 room
- 02 rooms
- 1503 rooms
- 1,2554 rooms
- 2,4955 rooms
- 3,6626 rooms
- 1,9437 rooms
- 1,5488 rooms
- 1,6599+ rooms
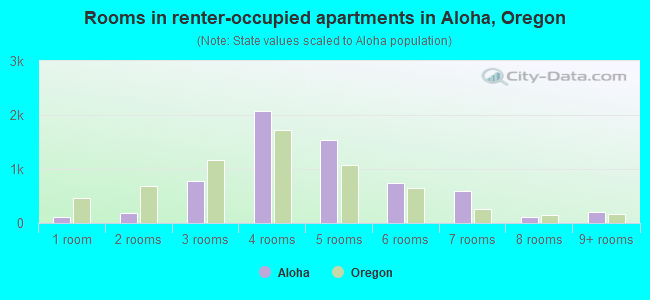
- Rooms in renter-occupied apartments in Aloha, Oregon
- 1091 room
- 1922 rooms
- 7873 rooms
- 2,0714 rooms
- 1,5355 rooms
- 7406 rooms
- 5907 rooms
- 1038 rooms
- 2109+ rooms
Aloha, OR household income distribution

- 433Less than $10,000
- 698$10,000 to $19,999
- 1,151$20,000 to $29,999
- 912$30,000 to $39,999
- 900$40,000 to $49,999
- 1,068$50,000 to $59,999
- 2,311$60,000 to $74,999
- 3,311$75,000 to $99,999
- 2,506$100,000 to $124,999
- 1,931$125,000 to $149,999
- 1,923$150,000 to $199,999
- 1,896$200,000 or more
Home value of owner - occupied houses in 2022 in Aloha, OR
-
- 160Less than $10,000
- 35$20,000 to $24,999
- 4$30,000 to $34,999
- 14$35,000 to $39,999
- 39$40,000 to $49,999
- 16$60,000 to $69,999
- 15$80,000 to $89,999
- 15$90,000 to $99,999
- 6$100,000 to $124,999
- 109$150,000 to $174,999
- 16$175,000 to $199,999
- 90$200,000 to $249,999
- 438$250,000 to $299,999
- 1,965$300,000 to $399,999
- 3,719$400,000 to $499,999
- 3,324$500,000 to $749,999
- 289$750,000 to $999,999
- 28$1,000,000 to $1,499,999
- 14$2,000,000 or more
Rent paid by renters in 2022 in Aloha, OR
-
- 20Less than $100
- 17$100 to $149
- 17$250 to $299
- 86$350 to $399
- 22$450 to $499
- 82$500 to $549
- 14$550 to $599
- 54$650 to $699
- 46$700 to $749
- 5$750 to $799
- 62$800 to $899
- 118$900 to $999
- 995$1,000 to $1,249
- 1,319$1,250 to $1,499
- 2,281$1,500 to $1,999
- 1,005$2,000 to $2,499
- 27$2,500 to $2,999
- 22$3,500 or more
- 157No cash rent
Percentage of workers working in this county: 84.5%
Number of people working at home: 6,247 (21.9% of all workers)
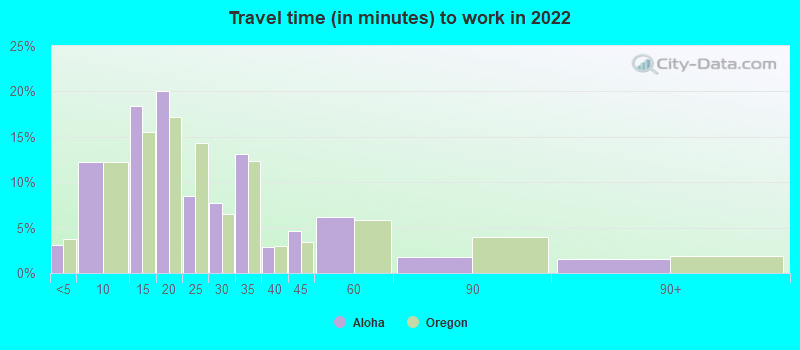
Travel time to work (commute)
- Less than 5 minutes: 256
- 5 to 9 minutes: 1,143
- 10 to 14 minutes: 4,008
- 15 to 19 minutes: 3,858
- 20 to 24 minutes: 3,428
- 25 to 29 minutes: 1,828
- 30 to 34 minutes: 2,890
- 35 to 39 minutes: 714
- 40 to 44 minutes: 1,352
- 45 to 59 minutes: 1,403
- 60 to 89 minutes: 670
- 90 or more minutes: 328
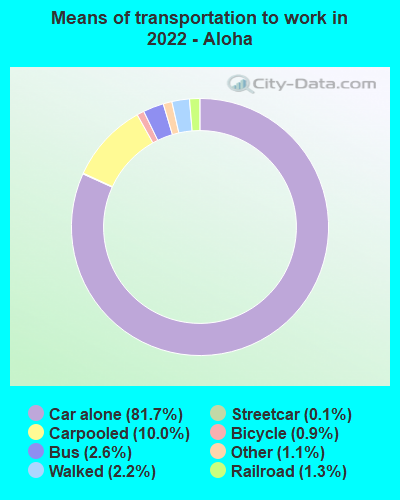
Means of transportation to work:
- Drove a car alone: 5,065 (45.1%)
- Carpooled: 544 (4.8%)
- Bus: 141 (1.3%)
- Subway or elevated rail: 3 (0.0%)
- Light rail, streetcar or trolley: 44 (0.4%)
- Taxi: 86 (0.8%)
- Bicycle: 30 (0.3%)
- Walked: 160 (1.4%)
- Worked at home: 6,247 (55.6%)
- Unemployment by race in 2022
- Unemployment rate for White non-Hispanic residents
- 2.4%Males
- 3.4%Females
- Unemployment rate for Black residents
- 21.5%Males
- 3.8%Females
- Unemployment rate for American Indian and Alaska Native residents
- 5.6%Males
- 7.1%Females
- Unemployment rate for Asian residents
- 1.2%Males
- 4.4%Females
- Unemployment rate for other race residents
- 0.9%Females
- Unemployment rate for two or more race residents
- 8.2%Males
- 1.6%Females
- Unemployment rate for Hispanic or Latino residents
- 6.3%Males
- 2.3%Females
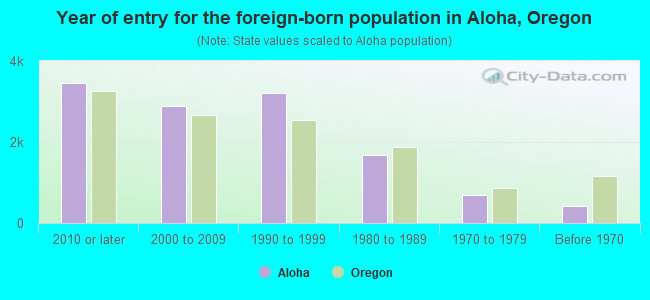
- Year of entry for the foreign-born population in Aloha, Oregon
- 3,4512010 or later
- 2,8932000 to 2009
- 3,2111990 to 1999
- 1,6761980 to 1989
- 6921970 to 1979
- 430Before 1970
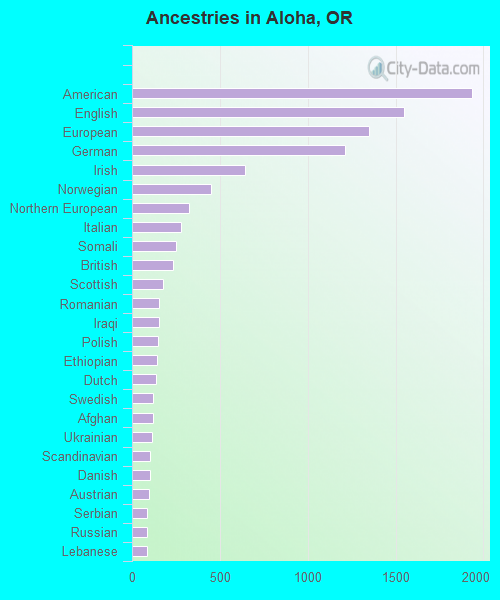
First ancestries reported:
- American: 1,935 (7.1%)
- English: 1,547 (5.7%)
- European: 1,348 (5.0%)
- German: 1,212 (4.5%)
- Irish: 645 (2.4%)
- Norwegian: 447 (1.7%)
- Northern European: 322 (1.2%)
- Italian: 277 (1.0%)
- Somali: 250 (0.9%)
- British: 231 (0.9%)
- Scottish: 175 (0.6%)
- Romanian: 155 (0.6%)
- Iraqi: 154 (0.6%)
- Polish: 147 (0.5%)
- Ethiopian: 141 (0.5%)
- Dutch: 134 (0.5%)
- Swedish: 122 (0.5%)
- Afghan: 117 (0.4%)
- Ukrainian: 115 (0.4%)
- Scandinavian: 105 (0.4%)
- Danish: 103 (0.4%)
- Austrian: 94 (0.3%)
- Serbian: 88 (0.3%)
- Russian: 87 (0.3%)
- Lebanese: 85 (0.3%)
- Palestinian: 85 (0.3%)
- Scotch-Irish: 77 (0.3%)
- African: 70 (0.3%)
- French: 65 (0.2%)
- Eastern European: 53 (0.2%)
- Hungarian: 52 (0.2%)
- French Canadian: 52 (0.2%)
- Slavic: 50 (0.2%)
- Armenian: 40 (0.1%)
- Nigerian: 40 (0.1%)
- Israeli: 34 (0.1%)
- Liberian: 34 (0.1%)
- Swiss: 21 (0.08%)
- Finnish: 20 (0.07%)
- Welsh: 19 (0.07%)
- Basque: 18 (0.07%)
- Canadian: 18 (0.07%)
- Turkish: 18 (0.07%)
- Croatian: 16 (0.06%)
- Greek: 15 (0.06%)
- Iranian: 12 (0.04%)
- Macedonian: 10 (0.04%)
- New Zealander: 9 (0.03%)
- Assyrian: 8 (0.03%)
- Celtic: 8 (0.03%)
- South African: 8 (0.03%)
- Bulgarian: 8 (0.03%)
- Belgian: 6 (0.02%)
- Czech: 6 (0.02%)
- Pennsylvania German: 6 (0.02%)
- Slovak: 5 (0.02%)
- Brazilian: 4 (0.01%)
Most common places of birth for foreign-born residents (%):
| Aloha: | 37.2% (4,402) |
| Oregon: | 33.9% (140,109) |
| Aloha: | 10.0% (1,184) |
| Oregon: | 5.5% (22,563) |
| Aloha: | 5.5% (656) |
| Oregon: | 3.5% (14,530) |
| Aloha: | 3.4% (397) |
| Oregon: | 4.7% (19,604) |
| Aloha: | 3.1% (372) |
| Oregon: | 0.6% (2,330) |
| Aloha: | 3.1% (370) |
| Oregon: | 1.7% (7,103) |
| Aloha: | 3.1% (368) |
| Oregon: | 5.2% (21,429) |
| Aloha: | 3.1% (365) |
| Oregon: | 0.4% (1,598) |
| Aloha: | 2.3% (267) |
| Oregon: | 0.7% (3,094) |
| Aloha: | 2.0% (235) |
| Oregon: | 2.8% (11,450) |
| Aloha: | 1.6% (194) |
| Oregon: | 0.3% (1,217) |
Place of birth for U.S.-born residents:
- This state: 21,663
- Other state: 19,474
- Northeast: 1,513
- Midwest: 3,075
- South: 2,478
- West: 12,373
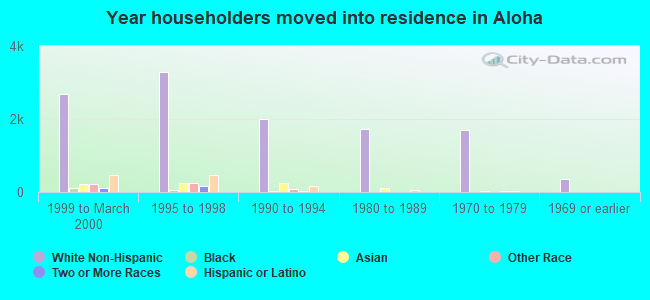
86.9% of Aloha residents lived in the same house 1 years ago.
Out of people who lived in different houses, 36.8% lived in this county.
Out of people who lived in different counties, 68.2% lived in Oregon.
| Aloha: | 86.9% |
| State average: | 85.5% |
Education attainment for males 25 years and older:
- No schooling: 593
- Nursery to 4th grade: 60
- 5th and 6th grade: 481
- 7th and 8th grade: 211
- 9th grade: 247
- 10th grade: 214
- 11th grade: 101
- 12th grade, no diploma: 467
- High school graduate (or equivalency): 4,846
- Less than 1 year of college: 842
- Some college more than 1 year, no degree: 2,581
- Associate degree: 2,213
- Bachelor's degree: 3,889
- Master's degree: 1,273
- Professional school degree: 95
- Doctorate degree: 447
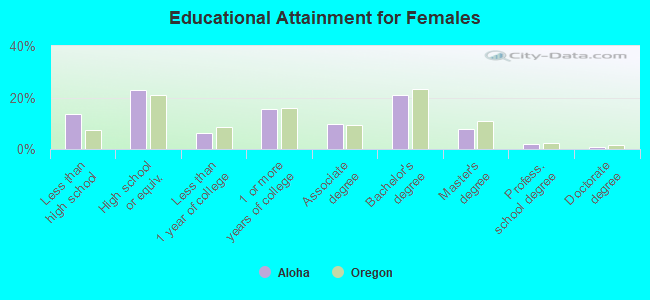
Education attainment for females 25 years and older:
- No schooling: 599
- Nursery to 4th grade: 91
- 5th and 6th grade: 697
- 7th and 8th grade: 192
- 9th grade: 173
- 10th grade: 164
- 11th grade: 368
- 12th grade, no diploma: 211
- High school graduate (or equivalency): 4,212
- Less than 1 year of college: 1,167
- Some college more than 1 year, no degree: 2,846
- Associate degree: 1,771
- Bachelor's degree: 3,870
- Master's degree: 1,408
- Professional school degree: 372
- Doctorate degree: 147
Housing units in structures:
- One, detached: 14,168
- One, attached: 2,270
- Two: 167
- 3 or 4: 877
- 5 to 9: 717
- 10 to 19: 673
- 20 to 49: 266
- 50 or more: 337
- Mobile homes: 160
Median worth of mobile homes: $363,376
Housing units lacking complete kitchen facilities in 2022: 1.0%
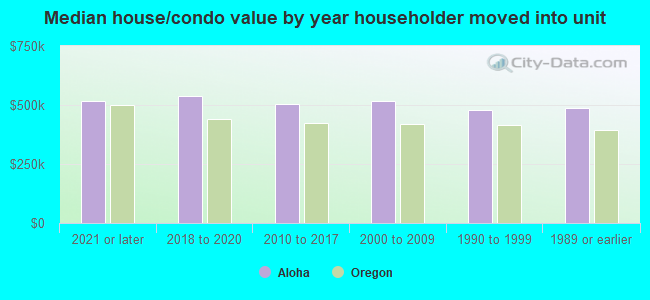
House/condo owner moved in on average 12 years ago
Renter moved in on average 3 years ago
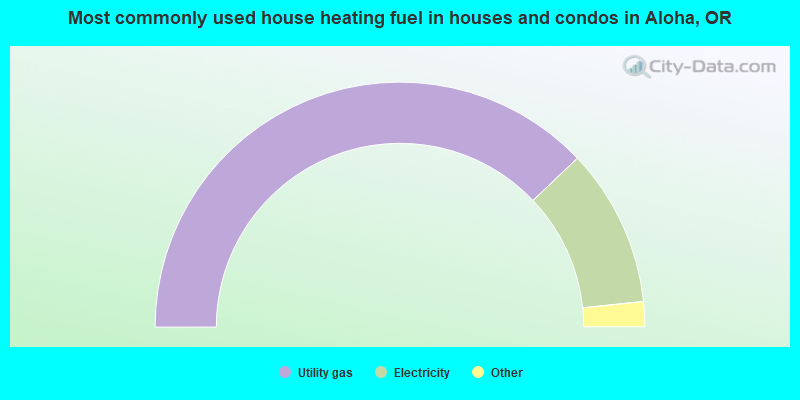
- 75.8%Utility gas
- 20.9%Electricity
- 1.6%Wood
- 1.0%Bottled, tank, or LP gas
- 0.3%No fuel used
- 0.3%Fuel oil, kerosene, etc.
- 0.1%Solar energy
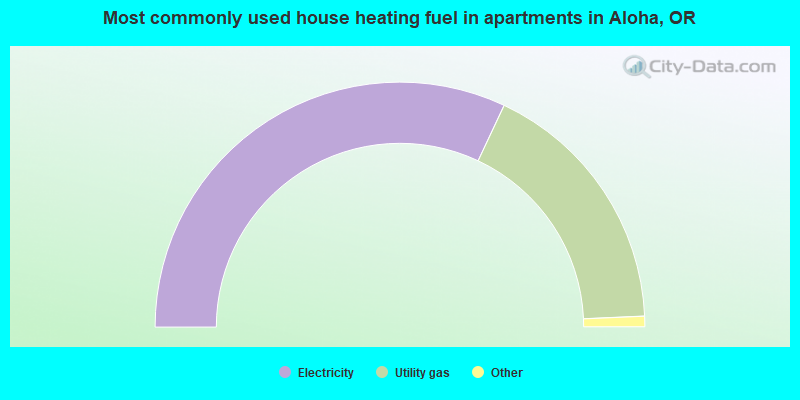
- 64.0%Electricity
- 34.6%Utility gas
- 0.8%Bottled, tank, or LP gas
- 0.7%No fuel used
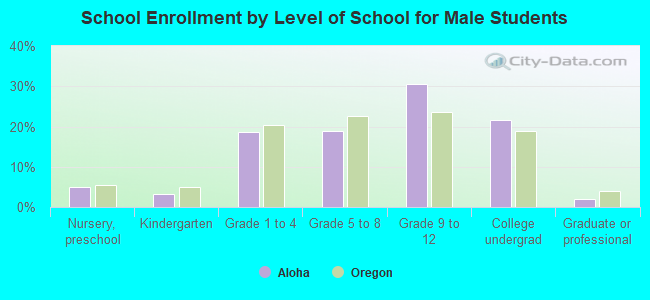
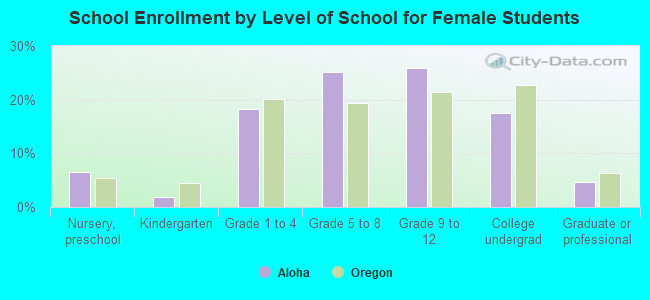
Private vs. public school enrollment:
| Here: | 10.8% |
| Oregon: | 13.7% |
| Here: | 7.5% |
| Oregon: | 8.8% |
| Here: | 15.9% |
| Oregon: | 17.7% |