Housing density: 2,024 houses/condos per square mile
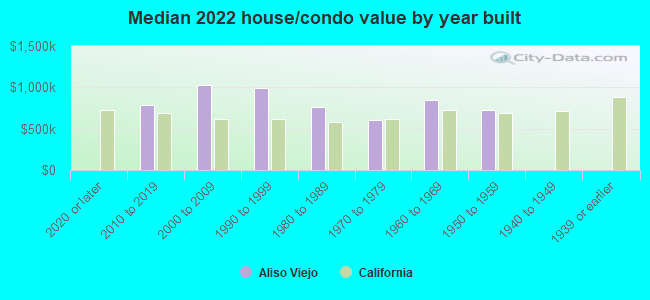
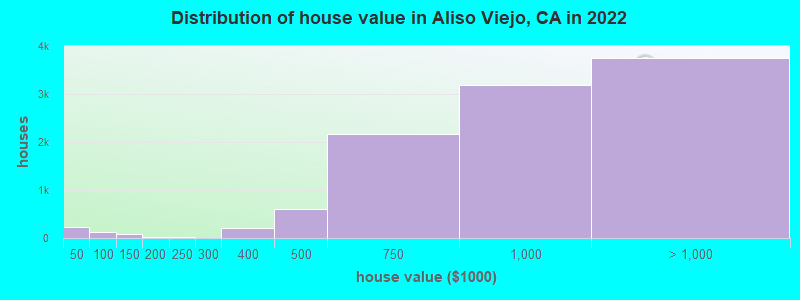
Median price asked for vacant for-sale houses and condos in 2022: $958,017.
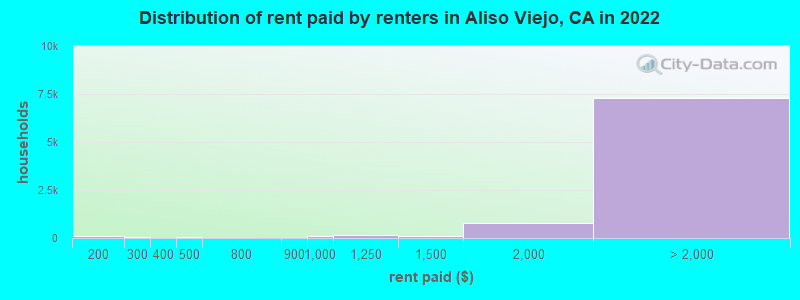
Median contract rent in 2022: over $2,000 (lower quartile is over $2,000, upper quartile is over $2,000)
Median rent asked for vacant for-rent units in 2022: $2,622
Median gross rent in Aliso Viejo, CA in 2022: over $2,000
Housing units in Aliso Viejo with a mortgage: 8,262 (969 second mortgage, 43 home equity loan, 813 both second mortgage and home equity loan) Houses without a mortgage: 16
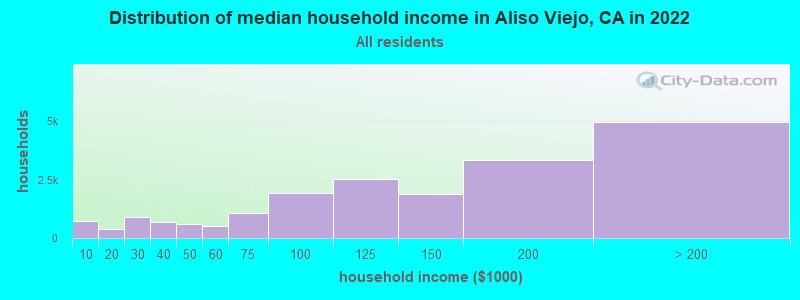
Median household income for houses/condos with a mortgage: $173,999
Median household income for apartments without a mortgage: $126,613
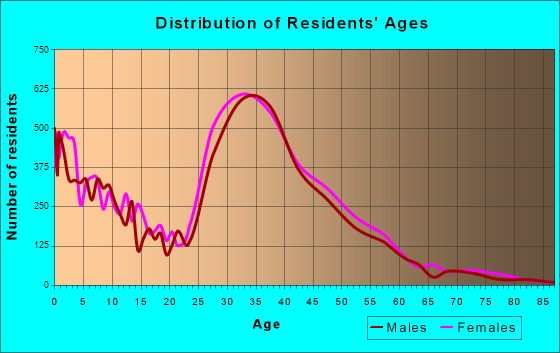
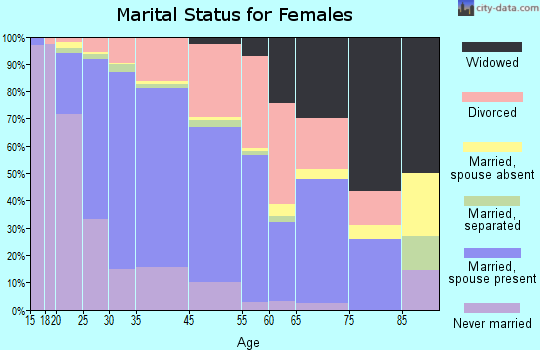
9,438 married couples with children.
2,078 single-parent households (564 men, 1,514 women).
64.0% of residents of Aliso Viejo speak English at home.
11.2% of residents speak Spanish at home (75% speak English very well, 15% speak English well, 8% speak English not well, 1% don't speak English at all).
13.6% of residents speak other Indo-European language at home (74% speak English very well, 15% speak English well, 9% speak English not well, 2% don't speak English at all).
9.4% of residents speak Asian or Pacific Island language at home (69% speak English very well, 23% speak English well, 6% speak English not well, 2% don't speak English at all).
1.7% of residents speak other language at home (77% speak English very well, 20% speak English well, 3% speak English not well).
Foreign born population: 12,699 (24.7%)
(63.5% of them are naturalized citizens)
Percentage of workers working in this county: 93.7% Number of people working at home: 7,597 (26.0% of all workers)
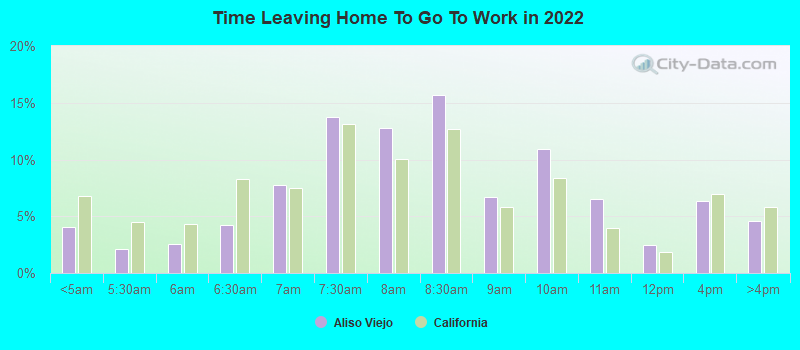
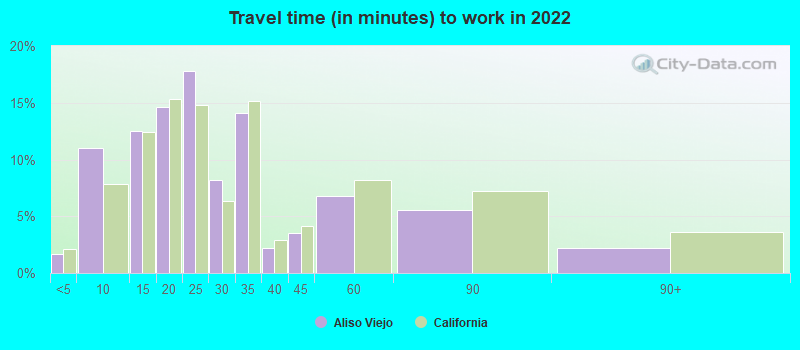
Travel time to work (commute)
Less than 5 minutes: 278
5 to 9 minutes: 2,274
10 to 14 minutes: 2,627
15 to 19 minutes: 3,651
20 to 24 minutes: 3,677
25 to 29 minutes: 1,757
30 to 34 minutes: 3,702
35 to 39 minutes: 773
40 to 44 minutes: 692
45 to 59 minutes: 1,299
60 to 89 minutes: 1,111
90 or more minutes: 355
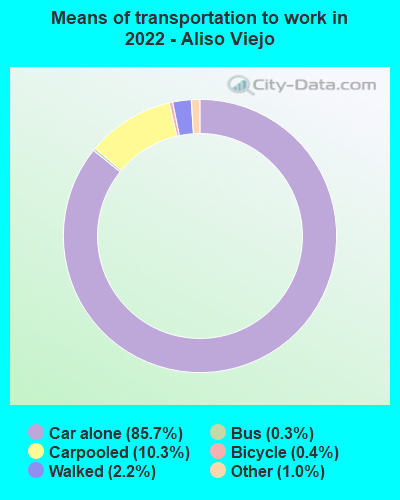
Means of transportation to work:
Drove a car alone: 13,452 (59.4%)
Carpooled: 1,750 (7.7%)
Bus: 46 (0.2%)
Taxi: 184 (0.8%)
Bicycle: 75 (0.3%)
Walked: 340 (1.5%)
Worked at home: 7,597 (33.5%)
Unemployment by race in 2022
Unemployment rate for White non-Hispanic residents
3.0%Males
2.4%Females
Unemployment rate for Black residents
17.0%Females
Unemployment rate for Asian residents
1.7%Males
2.5%Females
Unemployment rate for other race residents
4.7%Males
2.1%Females
Unemployment rate for two or more race residents
2.4%Males
7.0%Females
Unemployment rate for Hispanic or Latino residents
2.5%Males
2.0%Females
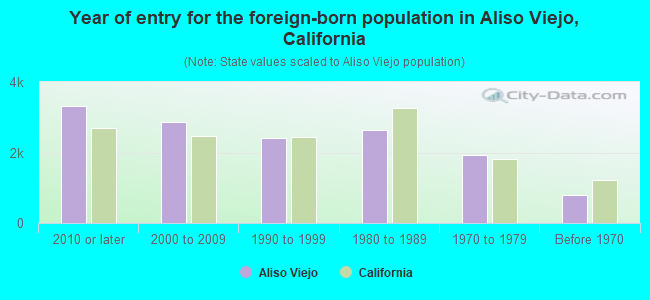
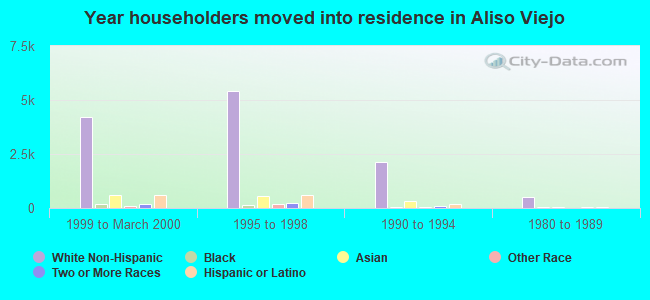
Year of entry for the foreign-born population in Aliso Viejo, California
3,3112010 or later
2,8702000 to 2009
2,4211990 to 1999
2,6331980 to 1989
1,9251970 to 1979
784Before 1970
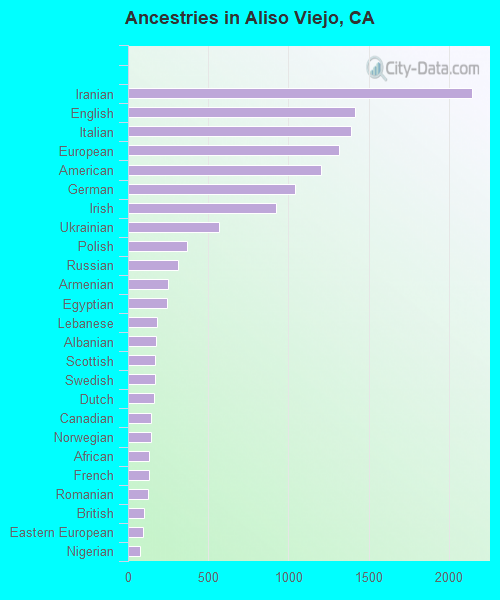
First ancestries reported:
Iranian: 2,143 (7.7%)
English: 1,413 (5.1%)
Italian: 1,392 (5.0%)
European: 1,317 (4.7%)
American: 1,202 (4.3%)
German: 1,040 (3.7%)
Irish: 925 (3.3%)
Ukrainian: 569 (2.0%)
Polish: 365 (1.3%)
Russian: 314 (1.1%)
Armenian: 250 (0.9%)
Egyptian: 241 (0.9%)
Lebanese: 178 (0.6%)
Albanian: 173 (0.6%)
Scottish: 170 (0.6%)
Swedish: 167 (0.6%)
Dutch: 163 (0.6%)
Canadian: 146 (0.5%)
Norwegian: 142 (0.5%)
African: 134 (0.5%)
French: 128 (0.5%)
Romanian: 123 (0.4%)
British: 97 (0.3%)
Eastern European: 95 (0.3%)
Nigerian: 77 (0.3%)
French Canadian: 69 (0.2%)
Hungarian: 64 (0.2%)
Yugoslavian: 62 (0.2%)
Portuguese: 57 (0.2%)
Scandinavian: 56 (0.2%)
Northern European: 52 (0.2%)
Sudanese: 52 (0.2%)
Turkish: 41 (0.1%)
Israeli: 40 (0.1%)
Scotch-Irish: 39 (0.1%)
Croatian: 32 (0.1%)
Danish: 29 (0.1%)
Syrian: 29 (0.1%)
Welsh: 28 (0.1%)
British West Indian: 23 (0.08%)
Barbadian: 22 (0.08%)
Afghan: 21 (0.08%)
Icelander: 18 (0.06%)
Lithuanian: 18 (0.06%)
Arab: 17 (0.06%)
Slavic: 15 (0.05%)
South African: 15 (0.05%)
Iraqi: 13 (0.05%)
Finnish: 12 (0.04%)
Belgian: 11 (0.04%)
Australian: 11 (0.04%)
Jamaican: 10 (0.04%)
Palestinian: 9 (0.03%)
Czech: 9 (0.03%)
Greek: 8 (0.03%)
Austrian: 8 (0.03%)
Belizean: 8 (0.03%)
Basque: 7 (0.03%)
Czechoslovakian: 2 (0.01%)
Most common places of birth for foreign-born residents (%):
Iran
Aliso Viejo:
17.3% (2,203)
California:
2.0% (206,004)
Mexico
Aliso Viejo:
13.7% (1,740)
California:
37.2% (3,881,193)
Philippines
Aliso Viejo:
8.2% (1,046)
California:
7.8% (818,297)
India
Aliso Viejo:
8.1% (1,030)
California:
5.2% (539,184)
China, excluding Hong Kong and Taiwan
Aliso Viejo:
4.0% (505)
California:
6.6% (684,672)
Vietnam
Aliso Viejo:
3.9% (495)
California:
4.9% (512,335)
Korea
Aliso Viejo:
3.7% (472)
California:
3.0% (315,248)
Japan
Aliso Viejo:
3.0% (386)
California:
1.0% (103,575)
Canada
Aliso Viejo:
2.7% (344)
California:
1.2% (127,477)
Taiwan
Aliso Viejo:
2.7% (340)
California:
1.7% (176,274)
Ukraine
Aliso Viejo:
2.3% (291)
California:
0.6% (60,761)
Lebanon
Aliso Viejo:
2.0% (258)
California:
0.3% (31,757)
Pakistan
Aliso Viejo:
1.9% (242)
California:
0.5% (49,399)
Colombia
Aliso Viejo:
1.9% (235)
California:
0.5% (55,249)
Italy
Aliso Viejo:
1.6% (197)
California:
0.3% (31,439)
England
Aliso Viejo:
1.5% (195)
California:
0.6% (57,953)
Germany
Aliso Viejo:
1.5% (193)
California:
0.7% (73,304)
Place of birth for U.S.-born residents:
This state: 27,212
Other state: 10,666
Northeast: 2,904
Midwest: 3,212
South: 1,995
West: 2,539
88.1% of Aliso Viejo residents lived in the same house 1 years ago. Out of people who lived in different houses, 41.7% lived in this county. Out of people who lived in different counties, 49.1% lived in California.
Aliso Viejo:
88.1%
State average:
88.9%
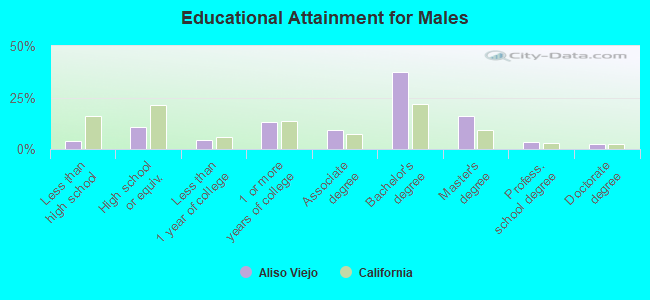
Education attainment for males 25 years and older:
No schooling: 182
Nursery to 4th grade: 51
5th and 6th grade: 0
7th and 8th grade: 18
9th grade: 69
10th grade: 16
11th grade: 78
12th grade, no diploma: 222
High school graduate (or equivalency): 1,809
Less than 1 year of college: 779
Some college more than 1 year, no degree: 2,192
Associate degree: 1,545
Bachelor's degree: 6,319
Master's degree: 2,670
Professional school degree: 558
Doctorate degree: 405
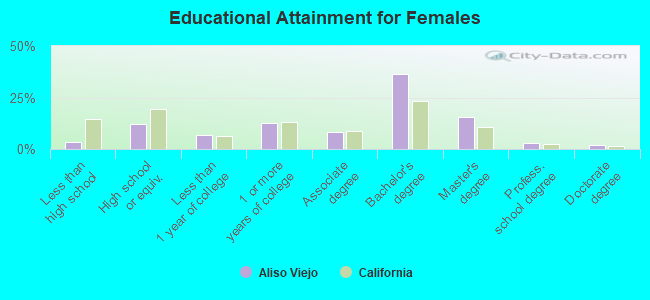
Education attainment for females 25 years and older:
No schooling: 267
Nursery to 4th grade: 68
5th and 6th grade: 84
7th and 8th grade: 0
9th grade: 33
10th grade: 8
11th grade: 80
12th grade, no diploma: 120
High school graduate (or equivalency): 2,202
Less than 1 year of college: 1,207
Some college more than 1 year, no degree: 2,283
Associate degree: 1,525
Bachelor's degree: 6,601
Master's degree: 2,814
Professional school degree: 557
Doctorate degree: 356
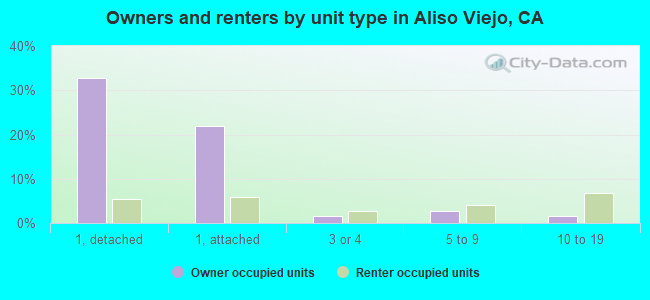
Housing units in structures:
One, detached: 7,323
One, attached: 5,394
Two: 71
3 or 4: 818
5 to 9: 1,410
10 to 19: 1,040
20 to 49: 724
50 or more: 3,723
Mobile homes: 187
Housing units lacking complete plumbing facilities in 2022: 0.3%
Housing units lacking complete kitchen facilities in 2022: 1.8%