Alhambra, CA (California) Houses and Residents
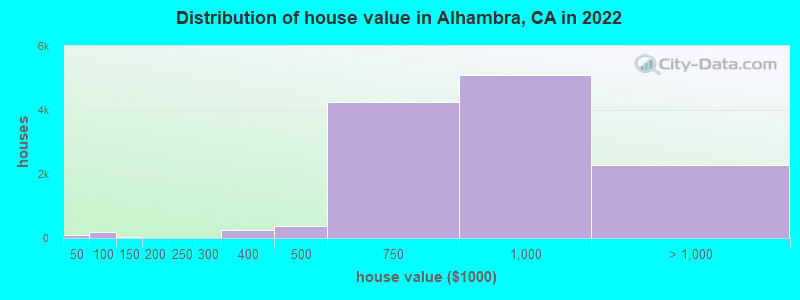
Estimated median house or condo value in 2022: $859,000 (it was $204,300 in 2000 )
Alhambra:
$859,000California:
$715,900
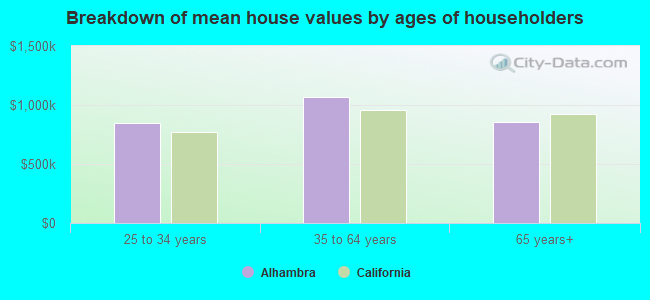
Lower value quartile - upper value quartile: $684,400 - $1,024,600Mean price in 2022: Detached houses: $959,805 Here:
$959,805State:
$988,808
Townhouses or other attached units: $738,588 Here:
$738,588State:
$838,546
In 2-unit structures: $705,532 Here:
$705,532State:
$1,138,100
In 3-to-4-unit structures: $520,941 Here:
$520,941State:
$824,253
In 5-or-more-unit structures: $605,569 Here:
$605,569State:
$730,996
Mobile homes: $698,439 Here:
$698,439State:
$184,506
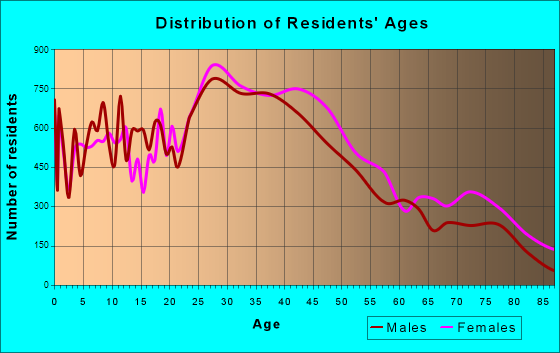
Total population: 85,569 (All urban)
Houses: 33,976 (31,579 occupied: 12,893 owner occupied, 18,686 renter occupied )
% of renters here:
59%State:
44%
Housing density: 4,458 houses/condos per square mile
Median price asked for vacant for-sale houses and condos in 2022: $740,716.
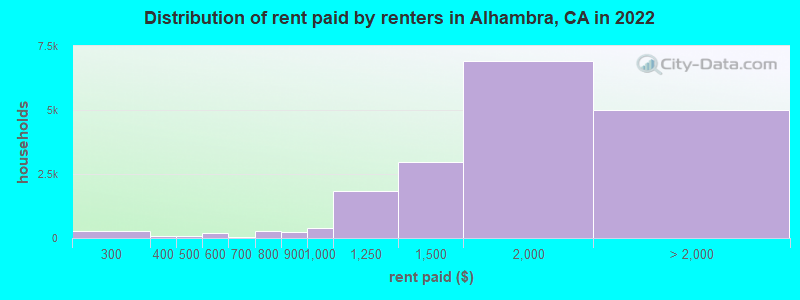
Median contract rent in 2022: $1,628 (lower quartile is $1,256, upper quartile is $1,953)
Median rent asked for vacant for-rent units in 2022: $2,205
Median gross rent in Alhambra, CA in 2022: $1,702
Housing units in Alhambra with a mortgage: 7,408 (648 second mortgage, 40 home equity loan, 560 both second mortgage and home equity loan )Houses without a mortgage: 85
Median household income for houses/condos with a mortgage: $110,641
Median household income for apartments without a mortgage: $71,362
Median monthly housing costs: $1,695
Data:
Median house or condo value ($)
Median house or condo value ($ change since 2000)
Median house or condo value ($) - White
Median house or condo value ($) - Black or African American
Median house or condo value ($) - Asian
Median house or condo value ($) - Hispanic or Latino
Median house or condo value ($) - American Indian and Alaska Native
Median house or condo value ($) - Multirace
Median house or condo value ($) - Other Race
Median price asked for mobile homes ($)
Household density (households per square mile)
Mean house or condo value by units in structure - 1, detached ($)
Mean house or condo value by units in structure - 1, attached ($)
Mean house or condo value by units in structure - 2 ($)
Mean house or condo value by units in structure by units in structure - 3 or 4 ($)
Mean house or condo value by units in structure - 5 or more ($)
Mean house or condo value by units in structure - Boat, RV, van, etc. ($)
Mean house or condo value by units in structure - Mobile home ($)
Median contract rent ($)
Median contract rent - Lower quartile ($)
Median contract rent - Upper quartile ($)
Median gross rent ($)
Urban houses (%)
Rural houses (%)
Houses occupied (%)
Houses occupied (% change since 2000)
Houses owner occupied (%)
Houses owner occupied (% change since 2000)
Houses renter occupied (%)
Houses renter occupied (% change since 2000)
Vacant housing units - For rent (%)
Vacant housing units - For rent (% change since 2000)
Vacant housing units - For sale only (%)
Vacant housing units - For sale only (% change since 2000)
Vacant housing units - Rented or sold, not occupied (%)
Vacant housing units - Rented or sold, not occupied (% change since 2000)
Vacant housing units - For seasonal, recreational, or occasional use (%)
Vacant housing units - For seasonal, recreational, or occasional use (% change since 2000)
Vacant housing units - For migrant workers (%)
Vacant housing units - For migrant workers (% change since 2000)
Vacant housing units - Other vacant (%)
Vacant housing units - Other vacant (% change since 2000)
Median monthly housing costs ($)
Median household income for houses/condos with a mortgage ($)
Median household income for houses/condos without a mortgage ($)
Median household income ($)
Median household income ($) - White
Median household income ($) - Black or African American
Median household income ($) - Asian
Median household income ($) - Hispanic or Latino
Median household income ($) - American Indian and Alaska Native
Median household income ($) - Multirace
Median household income ($) - Other Race
Mortgage status - with mortgage (%)
Mortgage status - with second mortgage (%)
Mortgage status - with home equity loan (%)
Mortgage status - with both second mortgage and home equity loan (%)
Mortgage status - without a mortgage (%)
Median year house/condo built
Median year apartment built
Household type by relationship - Male householder living alone (%)
Household type by relationship - Male householder not living alone (%)
Household type by relationship - Female householder living alone (%)
Household type by relationship - Female householder not living alone (%)
Household type by relationship - Opposite-Sex spouse (%)
Household type by relationship - Same-Sex spouse (%)
Household type by relationship - Opposite-Sex unmarried partner (%)
Household type by relationship - Same-Sex unmarried partner (%)
Household type by relationship - In group quarters (%)
Size of family households - 2-person household (%)
Size of family households - 3-person household (%)
Size of family households - 4-person household (%)
Size of family households - 5-person household (%)
Size of family households - 6-person household (%)
Size of family households - 7-or-more-person household (%)
Size of nonfamily households - 1-person household (%)
Size of nonfamily households - 2-person household (%)
Size of nonfamily households - 3-person household (%)
Size of nonfamily households - 4-person household (%)
Size of nonfamily households - 5-person household (%)
Size of nonfamily households - 6-person household (%)
Size of nonfamily households - 7-or-moreperson household (%)
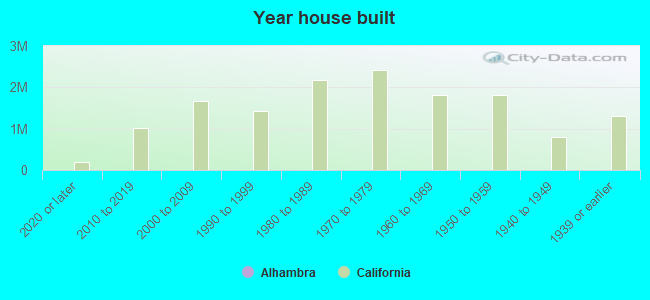
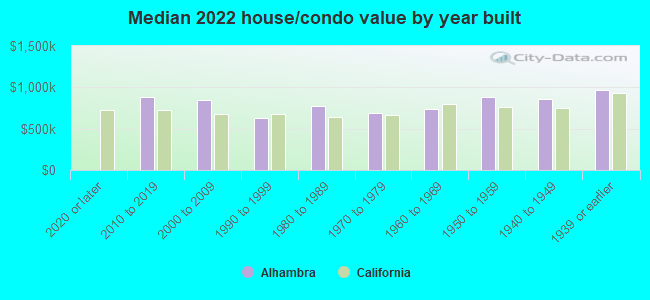
Year house built - Built 2010 or later (%)
Year house built - Built 2000 to 2009 (%)
Year house built - Built 1990 to 1999 (%)
Year house built - Built 1980 to 1989 (%)
Year house built - Built 1970 to 1979 (%)
Year house built - Built 1960 to 1969 (%)
Year house built - Built 1950 to 1959 (%)
Year house built - Built 1940 to 1949 (%)
Year house built - Built 1939 or earlier (%)
Median number of rooms in houses and condos
Median number of rooms in apartments
Median number of bedrooms in owner occupied houses
Mean number of bedrooms in owner occupied houses
Median number of bedrooms in renter occupied houses
Mean number of bedrooms in renter occupied houses
Median number of vehichles in owner occupied houses
Mean number of vehichles in owner occupied houses
Median number of vehichles in renter occupied houses
Mean number of vehichles in renter occupied houses
Rooms in owner-occupied houses - 1 room (%)
Rooms in owner-occupied houses - 2 rooms (%)
Rooms in owner-occupied houses - 3 rooms (%)
Rooms in owner-occupied houses - 4 rooms (%)
Rooms in owner-occupied houses - 5 rooms (%)
Rooms in owner-occupied houses - 6 rooms (%)
Rooms in owner-occupied houses - 7 rooms (%)
Rooms in owner-occupied houses - 8 rooms (%)
Rooms in owner-occupied houses - 9+ rooms (%)
Rooms in renter-occupied houses - 1 room (%)
Rooms in renter-occupied houses - 2 rooms (%)
Rooms in renter-occupied houses - 3 rooms (%)
Rooms in renter-occupied houses - 4 rooms (%)
Rooms in renter-occupied houses - 5 rooms (%)
Rooms in renter-occupied houses - 6 rooms (%)
Rooms in renter-occupied houses - 7 rooms (%)
Rooms in renter-occupied houses - 8 rooms (%)
Rooms in renter-occupied houses - 9+ rooms (%)
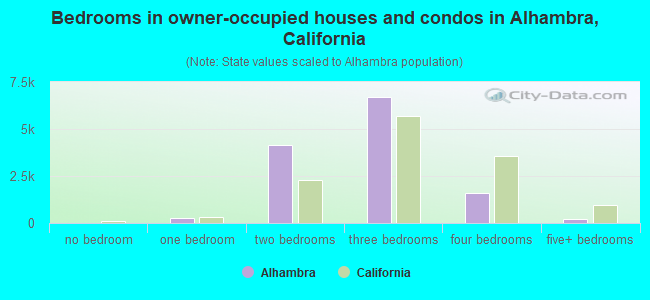
Bedrooms in owner-occupied houses - no bedrooms (%)
Bedrooms in owner-occupied houses - 1 bedroom (%)
Bedrooms in owner-occupied houses - 2 bedrooms (%)
Bedrooms in owner-occupied houses - 3 bedrooms (%)
Bedrooms in owner-occupied houses - 4 bedrooms (%)
Bedrooms in owner-occupied houses - 5+ bedrooms (%)
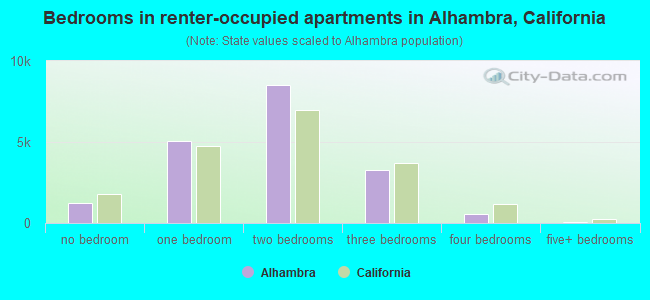
Bedrooms in renter-occupied houses - no bedrooms (%)
Bedrooms in renter-occupied houses - 1 bedroom (%)
Bedrooms in renter-occupied houses - 2 bedrooms (%)
Bedrooms in renter-occupied houses - 3 bedrooms (%)
Bedrooms in renter-occupied houses - 4 bedrooms (%)
Bedrooms in renter-occupied houses - 5+ bedrooms (%)
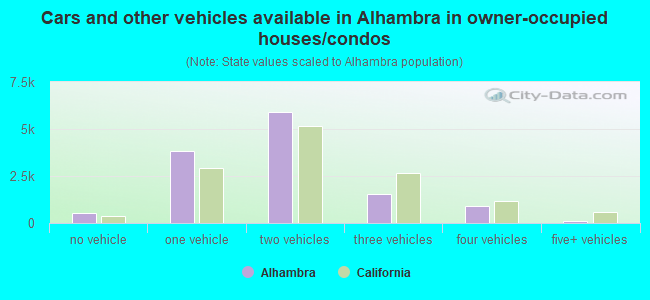
Vehicles available in owner-occupied houses - no vehicle available (%)
Vehicles available in owner-occupied houses - 1 vehicle available(%)
Vehicles available in owner-occupied houses - 2 Vehicles available (%)
Vehicles available in owner-occupied houses - 3 Vehicles available (%)
Vehicles available in owner-occupied houses - 4 Vehicles available (%)
Vehicles available in owner-occupied houses - 5+ Vehicles available (%)
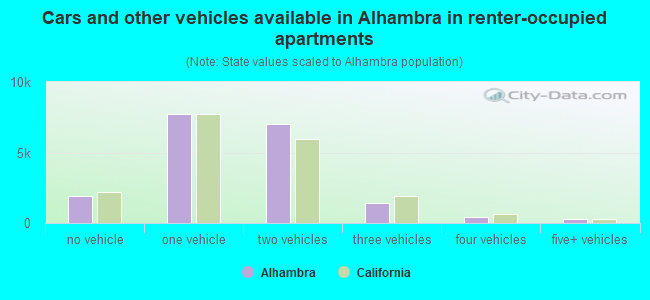
Vehicles available in renter-occupied houses - no vehicle available (%)
Vehicles available in renter-occupied houses - 1 vehicle available (%)
Vehicles available in renter-occupied houses - 2 Vehicles available (%)
Vehicles available in renter-occupied houses - 3 Vehicles available (%)
Vehicles available in renter-occupied houses - 4 Vehicles available (%)
Vehicles available in renter-occupied houses - 5+ Vehicles available (%)
Housing units in structures - 1, detached (%)
Housing units in structures - 1, attached (%)
Housing units in structures - 2 (%)
Housing units in structures - 3 or 4 (%)
Housing units in structures - 5 to 9 (%)
Housing units in structures - 10 to 19 (%)
Housing units in structures - 20 to 49 (%)
Housing units in structures - 50 or more (%)
Housing units in structures - Mobile home (%)
Housing units in structures - Boat, RV, van, etc. (%)
Housing units in structures - Owners - 1, detached (%)
Housing units in structures - Owners - 1, attached (%)
Housing units in structures - Owners - 2 (%)
Housing units in structures - Owners - 3 or 4 (%)
Housing units in structures - Owners - 5 to 9 (%)
Housing units in structures - Owners - 10 to 19 (%)
Housing units in structures - Owners - 20 to 49 (%)
Housing units in structures - Owners - 50 or more (%)
Housing units in structures - Owners - Mobile home (%)
Housing units in structures - Owners - Boat, RV, van, etc. (%)
Housing units in structures - Renters - 1, detached (%)
Housing units in structures - Renters - 1, attached (%)
Housing units in structures - Renters - 2 (%)
Housing units in structures - Renters - 3 or 4 (%)
Housing units in structures - Renters - 5 to 9 (%)
Housing units in structures - Renters - 10 to 19 (%)
Housing units in structures - Renters - 20 to 49 (%)
Housing units in structures - Renters - 50 or more (%)
Housing units in structures - Renters - Mobile home (%)
Housing units in structures - Renters - Boat, RV, van, etc. (%)
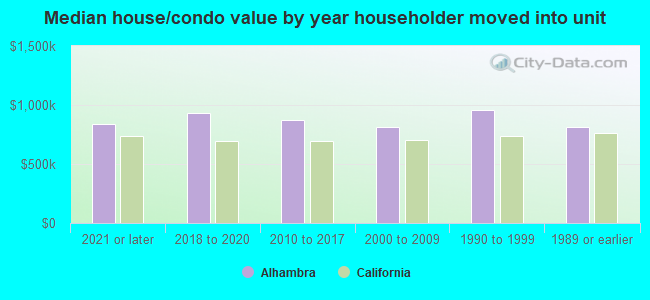
House/condo owner moved in on average (years ago)
Renter moved in on average (years ago)
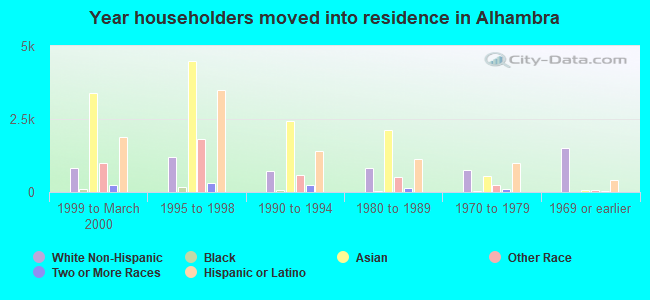
Year householder moved into unit - Moved in 1999 to March 2000 (%)
Year householder moved into unit - Moved in 1999 to March 2000 (%) - White
Year householder moved into unit - Moved in 1999 to March 2000 (%) - Black or African American
Year householder moved into unit - Moved in 1999 to March 2000 (%) - Asian
Year householder moved into unit - Moved in 1999 to March 2000 (%) - Hispanic or Latino
Year householder moved into unit - Moved in 1999 to March 2000 (%) - American Indian and Alaska Native
Year householder moved into unit - Moved in 1999 to March 2000 (%) - Multirace
Year householder moved into unit - Moved in 1999 to March 2000 (%) - Other Race
Year householder moved into unit - Moved in 1995 to 1998 (%)
Year householder moved into unit - Moved in 1995 to 1998 (%) - White
Year householder moved into unit - Moved in 1995 to 1998 (%) - Black or African American
Year householder moved into unit - Moved in 1995 to 1998 (%) - Asian
Year householder moved into unit - Moved in 1995 to 1998 (%) - Hispanic or Latino
Year householder moved into unit - Moved in 1995 to 1998 (%) - American Indian and Alaska Native
Year householder moved into unit - Moved in 1995 to 1998 (%) - Multirace
Year householder moved into unit - Moved in 1995 to 1998 (%) - Other Race
Year householder moved into unit - Moved in 1990 to 1994 (%)
Year householder moved into unit - Moved in 1990 to 1994 (%) - White
Year householder moved into unit - Moved in 1990 to 1994 (%) - Black or African American
Year householder moved into unit - Moved in 1990 to 1994 (%) - Asian
Year householder moved into unit - Moved in 1990 to 1994 (%) - Hispanic or Latino
Year householder moved into unit - Moved in 1990 to 1994 (%) - American Indian and Alaska Native
Year householder moved into unit - Moved in 1990 to 1994 (%) - Multirace
Year householder moved into unit - Moved in 1990 to 1994 (%) - Other Race
Year householder moved into unit - Moved in 1980 to 1989 (%)
Year householder moved into unit - Moved in 1980 to 1989 (%) - White
Year householder moved into unit - Moved in 1980 to 1989 (%) - Black or African American
Year householder moved into unit - Moved in 1980 to 1989 (%) - Asian
Year householder moved into unit - Moved in 1980 to 1989 (%) - Hispanic or Latino
Year householder moved into unit - Moved in 1980 to 1989 (%) - American Indian and Alaska Native
Year householder moved into unit - Moved in 1980 to 1989 (%) - Multirace
Year householder moved into unit - Moved in 1980 to 1989 (%) - Other Race
Year householder moved into unit - Moved in 1970 to 1979 (%)
Year householder moved into unit - Moved in 1970 to 1979 (%) - White
Year householder moved into unit - Moved in 1970 to 1979 (%) - Black or African American
Year householder moved into unit - Moved in 1970 to 1979 (%) - Asian
Year householder moved into unit - Moved in 1970 to 1979 (%) - Hispanic or Latino
Year householder moved into unit - Moved in 1970 to 1979 (%) - American Indian and Alaska Native
Year householder moved into unit - Moved in 1970 to 1979 (%) - Multirace
Year householder moved into unit - Moved in 1970 to 1979 (%) - Other Race
Year householder moved into unit - Moved in 1969 or earlier (%)
Year householder moved into unit - Moved in 1969 or earlier (%) - White
Year householder moved into unit - Moved in 1969 or earlier (%) - Black or African American
Year householder moved into unit - Moved in 1969 or earlier (%) - Asian
Year householder moved into unit - Moved in 1969 or earlier (%) - Hispanic or Latino
Year householder moved into unit - Moved in 1969 or earlier (%) - American Indian and Alaska Native
Year householder moved into unit - Moved in 1969 or earlier (%) - Multirace
Year householder moved into unit - Moved in 1969 or earlier (%) - Other Race
Housing units lacking complete plumbing facilities (%)
Housing units lacking complete kitchen facilities (%)
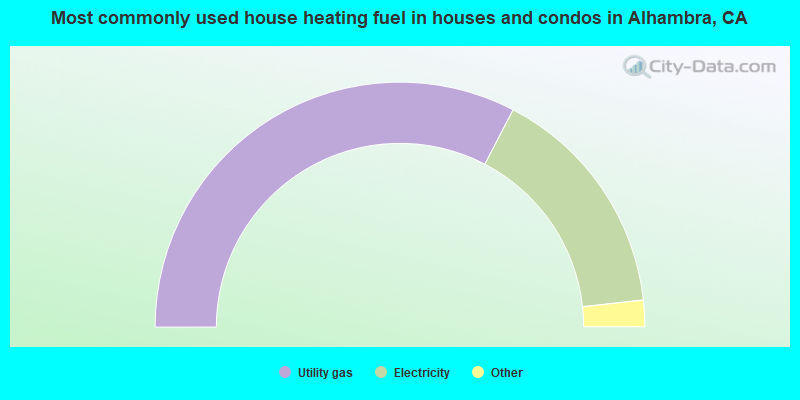
House heating fuel used in houses and condos - Utility gas (%)
House heating fuel used in houses and condos - Bottled, tank, or LP gas (%)
House heating fuel used in houses and condos - Electricity (%)
House heating fuel used in houses and condos - Fuel oil, kerosene, etc. (%)
House heating fuel used in houses and condos - Coal or coke (%)
House heating fuel used in houses and condos - Wood (%)
House heating fuel used in houses and condos - Solar energy (%)
House heating fuel used in houses and condos - Other fuel (%)
House heating fuel used in houses and condos - No fuel used (%)
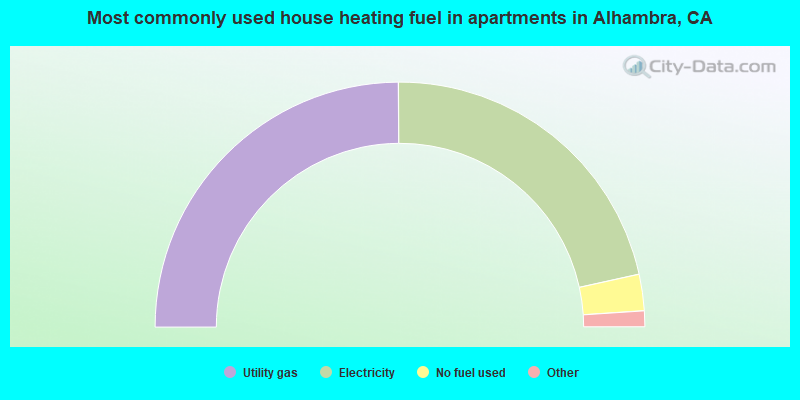
House heating fuel used in apartments - Utility gas (%)
House heating fuel used in apartments - Bottled, tank, or LP gas (%)
House heating fuel used in apartments - Electricity (%)
House heating fuel used in apartments - Fuel oil, kerosene, etc. (%)
House heating fuel used in apartments - Coal or coke (%)
House heating fuel used in apartments - Wood (%)
House heating fuel used in apartments - Solar energy (%)
House heating fuel used in apartments - Other fuel (%)
House heating fuel used in apartments - No fuel used (%)
Latest news about housing in Alhambra, CA collected exclusively by city-data.com from local newspapers, TV, and radio stations
Median year house/condo built: 1949Median year apartment built: 1968Household type by relationship:
Households: 80,264
Male householders: 16,573 (3,582 living alone ), Female householders: 15,006 (4,352 living alone )13,614 spouses (13,323 opposite-sex spouses ), 2,404 unmarried partners , (2,404 opposite-sex unmarried partners ), 19,424 children (18,544 natural , 390 adopted , 490 stepchildren ), 299 grandchildren , 2,230 brothers or sisters , 5,812 parents , 0 foster children , 1,753 other relatives , 2,403 non-relatives In group quarters: 746
Size of family households: 8,943 2-persons , 5,810 3-persons , 3,600 4-persons , 1,634 5-persons , 713 6-persons , 246 7-or-more-persons .
Size of nonfamily households: 7,934 1-person , 2,189 2-persons , 303 3-persons , 207 4-persons .
8,144 married couples with children. single-parent households (1,210 men , 2,142 women ).
29.3% of residents of Alhambra speak English at home. of residents speak Spanish at home (71% speak English very well , 17% speak English well , 10% speak English not well , 1% don't speak English at all ).of residents speak other Indo-European language at home (73% speak English very well , 19% speak English well , 3% speak English not well , 5% don't speak English at all ).of residents speak Asian or Pacific Island language at home (34% speak English very well , 25% speak English well , 30% speak English not well , 11% don't speak English at all ).
Foreign born population: 38,007 (47.4%)of them are naturalized citizens )
Median number of rooms in houses and condos:
Median number of rooms in apartments
Owner-occupied Renter-occupied
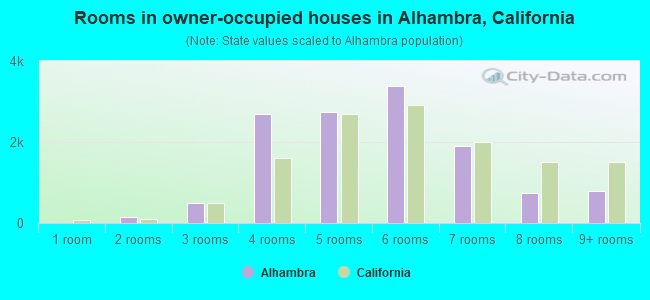
Rooms in owner-occupied houses in Alhambra, California
0 1 room 150 2 rooms 501 3 rooms 2,684 4 rooms 2,748 5 rooms 3,377 6 rooms 1,905 7 rooms 743 8 rooms 785 9+ rooms
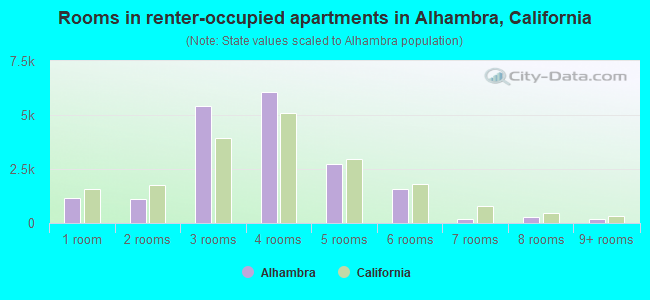
Rooms in renter-occupied apartments in Alhambra, California
1,140 1 room 1,101 2 rooms 5,439 3 rooms 6,075 4 rooms 2,709 5 rooms 1,568 6 rooms 203 7 rooms 275 8 rooms 176 9+ rooms
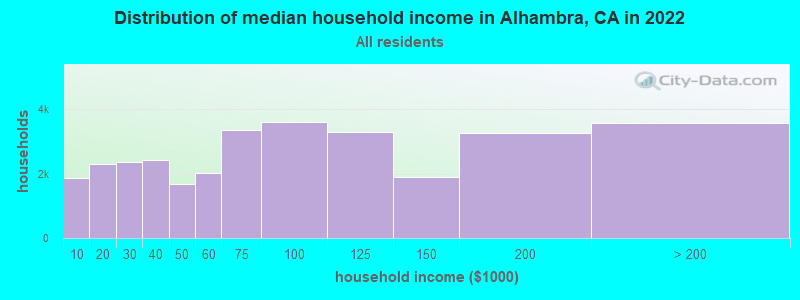
Alhambra, CA household income distribution 1,850 Less than $10,0002,307 $10,000 to $19,9992,360 $20,000 to $29,9992,412 $30,000 to $39,9991,674 $40,000 to $49,9992,030 $50,000 to $59,9993,344 $60,000 to $74,9993,598 $75,000 to $99,9993,292 $100,000 to $124,9991,878 $125,000 to $149,9993,259 $150,000 to $199,9993,575 $200,000 or more
Home value of owner - occupied houses in 2022 in Alhambra, CA 64 Less than $10,0003 $20,000 to $24,9997 $30,000 to $34,99918 $40,000 to $49,99920 $50,000 to $59,999134 $60,000 to $69,9994 $70,000 to $79,99941 $100,000 to $124,9997 $175,000 to $199,9998 $200,000 to $249,9995 $250,000 to $299,999244 $300,000 to $399,999376 $400,000 to $499,9994,244 $500,000 to $749,9995,080 $750,000 to $999,9991,776 $1,000,000 to $1,499,999310 $1,500,000 to $1,999,999193 $2,000,000 or moreRent paid by renters in 2022 in Alhambra, CA 13 $150 to $199228 $200 to $24949 $250 to $29963 $300 to $3495 $350 to $39952 $400 to $44914 $450 to $499175 $500 to $54931 $550 to $59934 $600 to $64914 $650 to $69997 $700 to $749193 $750 to $799217 $800 to $899375 $900 to $9991,846 $1,000 to $1,2492,968 $1,250 to $1,4996,906 $1,500 to $1,9992,804 $2,000 to $2,499976 $2,500 to $2,999328 $3,000 to $3,499244 $3,500 or more627 No cash rent
Percentage of workers working in this county: 97.0%Number of people working at home: 5,865 (14.4% of all workers )
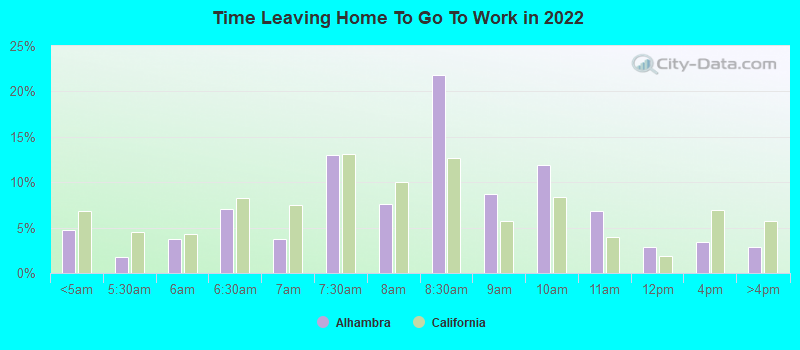
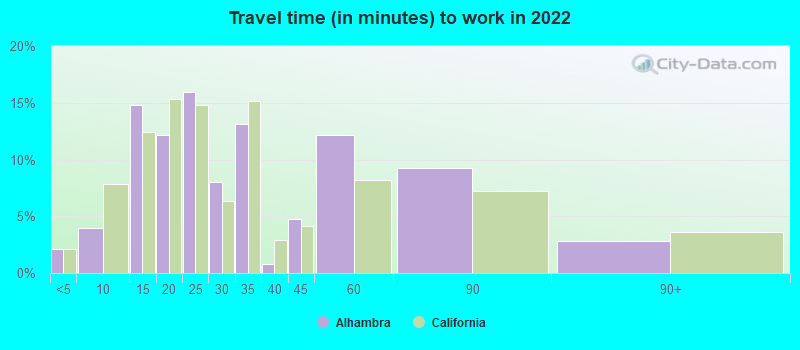
Travel time to work (commute)
Less than 5 minutes: 2835 to 9 minutes: 97210 to 14 minutes: 4,60615 to 19 minutes: 2,91020 to 24 minutes: 5,01525 to 29 minutes: 2,86230 to 34 minutes: 7,85835 to 39 minutes: 74240 to 44 minutes: 1,45845 to 59 minutes: 3,77560 to 89 minutes: 2,41790 or more minutes: 855
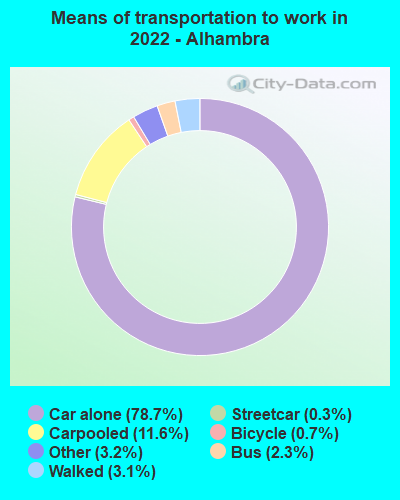
Means of transportation to work:
Drove a car alone: 19,297 (63.5%)Carpooled: 3,146 (10.4%)Bus : 514 (1.7%)Subway or elevated rail : 63 (0.2%)Long-distance train or commuter rail : 8 (0.0%)Taxi: 849 (2.8%)Bicycle: 174 (0.6%)Walked: 816 (2.7%)Worked at home: 5,865 (19.3%)
Unemployment by race in 2022
Unemployment rate for White non-Hispanic residents 6.9% Males6.0% FemalesUnemployment rate for Black residents 4.9% Males11.0% FemalesUnemployment rate for American Indian and Alaska Native residents 5.6% Males11.3% FemalesUnemployment rate for Asian residents 7.6% Males2.5% FemalesUnemployment rate for other race residents 2.5% Males2.8% FemalesUnemployment rate for two or more race residents 3.5% Males5.3% FemalesUnemployment rate for Hispanic or Latino residents 1.9% Males5.3% Females
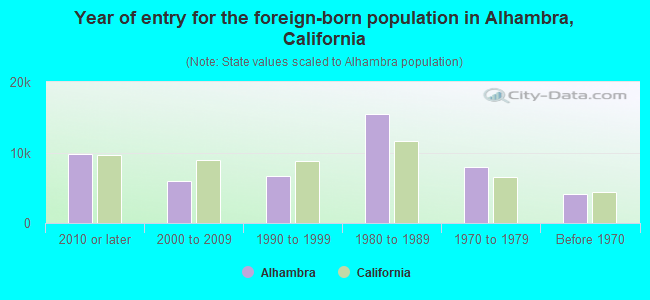
Year of entry for the foreign-born population in Alhambra, California
9,746 2010 or later 5,981 2000 to 2009 6,690 1990 to 1999 15,475 1980 to 1989 7,947 1970 to 1979 4,080 Before 1970
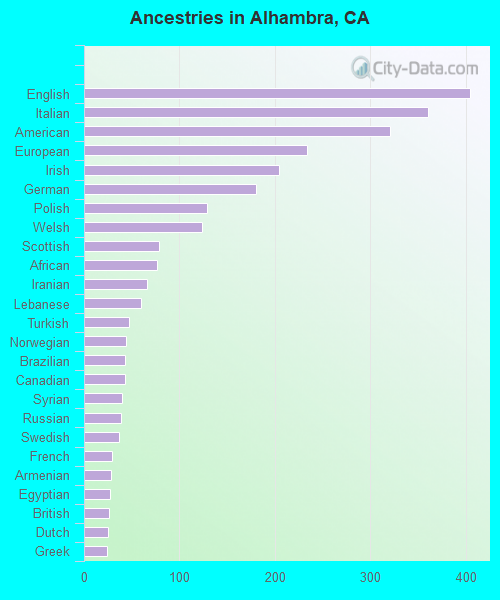
First ancestries reported:
English: 404 (0.7%)
Italian: 360 (0.7%)
American: 321 (0.6%)
European: 234 (0.4%)
Irish: 204 (0.4%)
German: 180 (0.3%)
Polish: 129 (0.2%)
Welsh: 124 (0.2%)
Scottish: 79 (0.1%)
African: 76 (0.1%)
Iranian: 66 (0.1%)
Lebanese: 60 (0.1%)
Turkish: 47 (0.09%)
Norwegian: 44 (0.08%)
Brazilian: 43 (0.08%)
Canadian: 43 (0.08%)
Syrian: 40 (0.07%)
Russian: 39 (0.07%)
Swedish: 37 (0.07%)
French: 29 (0.05%)
Armenian: 28 (0.05%)
Egyptian: 27 (0.05%)
British: 26 (0.05%)
Dutch: 25 (0.05%)
Greek: 24 (0.04%)
Hungarian: 23 (0.04%)
Portuguese: 20 (0.04%)
Icelander: 17 (0.03%)
Swiss: 16 (0.03%)
Afghan: 16 (0.03%)
Ethiopian: 16 (0.03%)
Scotch-Irish: 14 (0.03%)
Romanian: 10 (0.02%)
Czech: 8 (0.01%)
Ukrainian: 8 (0.01%)
Bulgarian: 4 (0.01%)
Israeli: 3 (0.01%) Most common places of birth for foreign-born residents (%): China, excluding Hong Kong and Taiwan Alhambra:
35.6% (13,188)California:
6.6% (684,672)
Vietnam Alhambra:
14.5% (5,358)California:
4.9% (512,335)
Mexico Alhambra:
12.7% (4,689)California:
37.2% (3,881,193)
Hong Kong Alhambra:
6.6% (2,452)California:
1.0% (105,215)
Taiwan Alhambra:
5.6% (2,071)California:
1.7% (176,274)
Philippines Alhambra:
4.3% (1,602)California:
7.8% (818,297)
El Salvador Alhambra:
3.2% (1,185)California:
4.2% (440,287)
Cambodia Alhambra:
1.8% (649)California:
0.5% (51,974)
Place of birth for U.S.-born residents:
This state: 35,643Other state: 5,539Northeast: 968Midwest: 1,588South: 1,908West: 1,075 90.3% of Alhambra residents lived in the same house 1 years ago.
Out of people who lived in different houses, 45.8% lived in this county.
Out of people who lived in different counties, 68.1% lived in California.
Alhambra:
90.3%State average:
88.9%
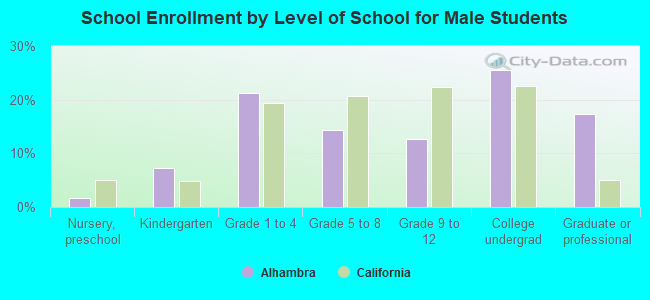
Education attainment for males 25 years and older:
No schooling: 1,638Nursery to 4th grade: 3425th and 6th grade: 1907th and 8th grade: 889th grade: 54110th grade: 19111th grade: 13912th grade, no diploma: 509High school graduate (or equivalency): 6,988Less than 1 year of college: 1,089Some college more than 1 year, no degree: 3,308Associate degree: 2,643Bachelor's degree: 8,087Master's degree: 2,941Professional school degree: 517Doctorate degree: 738
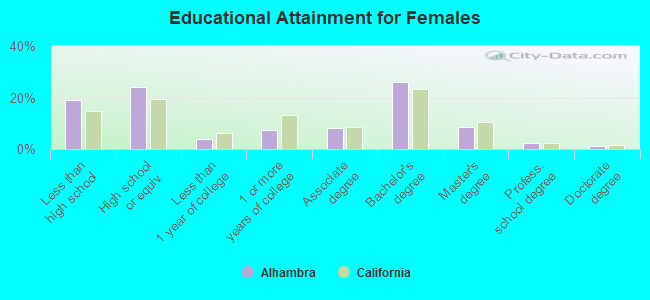
Education attainment for females 25 years and older:
No schooling: 2,271Nursery to 4th grade: 5345th and 6th grade: 8647th and 8th grade: 7279th grade: 34610th grade: 16811th grade: 26712th grade, no diploma: 914High school graduate (or equivalency): 7,745Less than 1 year of college: 1,214Some college more than 1 year, no degree: 2,319Associate degree: 2,657Bachelor's degree: 8,329Master's degree: 2,702Professional school degree: 688Doctorate degree: 435
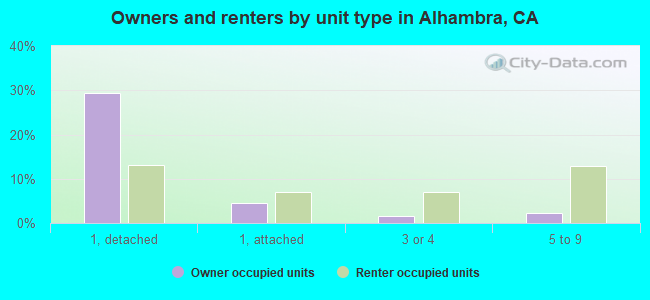
Housing units in structures:
One, detached: 14,365One, attached: 4,133Two: 1,2393 or 4: 3,0375 to 9: 5,02110 to 19: 1,91520 to 49: 2,12850 or more: 1,992Mobile homes: 146Housing units lacking complete plumbing facilities in 2022: 1.1%Housing units lacking complete kitchen facilities in 2022: 3.9%House/condo owner moved in on average 14 years ago
Renter moved in on average 5 years ago
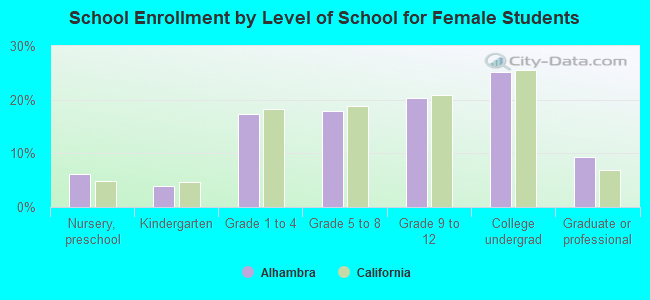
Private vs. public school enrollment:
Students in private schools in grades 1 to 8 (elementary and middle school): 675 Here:
11.2%California:
10.5%
Students in private schools in grades 9 to 12 (high school): 472 Here:
17.0%California:
8.5%
Students in private undergraduate colleges: 609 Here:
14.1%California:
15.9%