Alcoa, TN (Tennessee) Houses and Residents
| Alcoa: | $266,023 |
| Tennessee: | $284,800 |
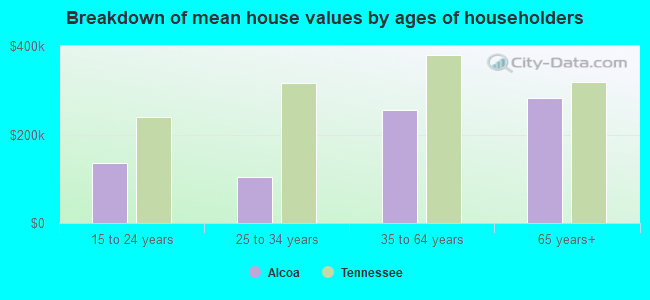
Mean price in 2022:
Detached houses: $297,969
Here: $297,969 State: $374,382 Townhouses or other attached units: $282,326
Here: $282,326 State: $354,101 Mobile homes: $81,920
Here: $81,920 State: $101,421
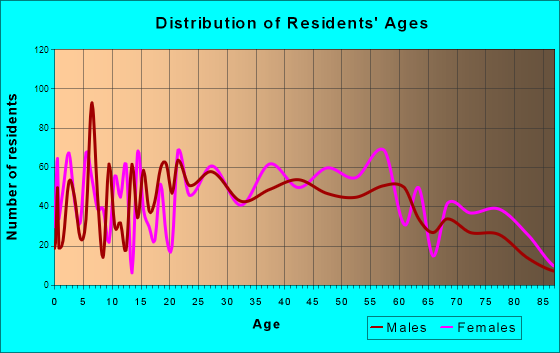
Total population: 8,753 (Urban population: 7,476, Rural population: 39 (all nonfarm))
Houses: 5,203 (4,582 occupied: 3,037 owner occupied, 1,649 renter occupied)
| % of renters here: | 35% |
| State: | 33% |
Housing density: 377 houses/condos per square mile
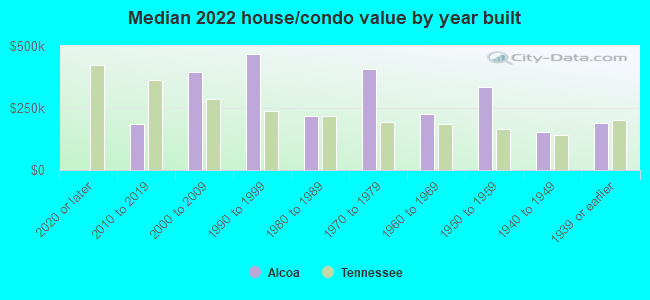
Median price asked for vacant for-sale houses and condos in 2022: $443,544.
Median contract rent in 2022: $793 (lower quartile is $597, upper quartile is $1,182)
Median rent asked for vacant for-rent units in 2022: $972
Median gross rent in Alcoa, TN in 2022: $944
Housing units in Alcoa with a mortgage: 1,639 (189 second mortgage, 96 home equity loan, 118 both second mortgage and home equity loan)
Houses without a mortgage: 16
Median household income for houses/condos with a mortgage: $85,129
Median household income for apartments without a mortgage: $61,450
Median monthly housing costs: $826
Compare current foreclosures near Alcoa, TN:
| Photo | Address | Area | Beds / Baths | Price | Details |
|---|---|---|---|---|---|

|
#1
W Fulton St
Alcoa, TN 37701
|
625 sq. feet
|
1 baths 2 beds |
show details | |

|
#2
Grant St
Alcoa, TN 37701
|
1,412 sq. feet
|
1 baths - beds |
show details | |

|
#3
Garfield St
Alcoa, TN 37701
|
2,132 sq. feet
|
1 baths - beds |
show details | |

|
#4
E Edison St
Alcoa, TN 37701
|
759 sq. feet
|
1 baths - beds |
show details | |

|
#5
W Newcomen St
Alcoa, TN 37701
|
1,272 sq. feet
|
2 baths - beds |
show details | |

|
#6
Glascock St
Alcoa, TN 37701
|
1,401 sq. feet
|
2 baths - beds |
show details | |

|
#7
W Stephenson St
Alcoa, TN 37701
|
993 sq. feet
|
2 baths - beds |
show details | |

|
#8
W Stephenson St
Alcoa, TN 37701
|
714 sq. feet
|
1 baths - beds |
show details | |

|
#9
Ford St
Alcoa, TN 37701
|
1,248 sq. feet
|
1 baths - beds |
show details | |

|
#10
E Bell St
Alcoa, TN 37701
|
1,000 sq. feet
|
1 baths - beds |
show details |
| Photo | Address | Area | Beds / Baths | Price | Details |
|---|---|---|---|---|---|

|
#11
Bessie Harvey Ave
Alcoa, TN 37701
|
2,268 sq. feet
|
1 baths - beds |
show details | |

|
#12
W Howe St
Alcoa, TN 37701
|
851 sq. feet
|
1 baths - beds |
show details | |

|
#13
Hayes St
Alcoa, TN 37701
|
1,032 sq. feet
|
1 baths - beds |
show details | |

|
#14
W Fulton St
Alcoa, TN 37701
|
608 sq. feet
|
1 baths - beds |
show details | |

|
#15
Harrison St
Alcoa, TN 37701
|
- sq. feet
|
- baths - beds |
show details | |

|
#16
Center St
Alcoa, TN 37701
|
- sq. feet
|
- baths - beds |
show details | |

|
#17
W Stephenson St
Alcoa, TN 37701
|
- sq. feet
|
- baths - beds |
show details | |

|
#18
Clingman View Dr
Alcoa, TN 37701
|
- sq. feet
|
- baths - beds |
show details | |

|
#19
W Edison St
Alcoa, TN 37701
|
- sq. feet
|
- baths - beds |
show details | |

|
#20
Mcarthur Rd Apt 7
Alcoa, TN 37701
|
- sq. feet
|
- baths - beds |
show details |
| Photo | Address | Area | Beds / Baths | Price | Details |
|---|---|---|---|---|---|

|
#21
Cochran St
Alcoa, TN 37701
|
- sq. feet
|
- baths - beds |
show details | |

|
#22
Lindsay St
Alcoa, TN 37701
|
- sq. feet
|
- baths - beds |
show details | |

|
#23
Hickey Rd
Knoxville, TN 37932
|
1,144 sq. feet
|
2 baths 3 beds |
show details | |

|
#24
Wallace Rd
Knoxville, TN 37919
|
2,174 sq. feet
|
1 baths 4 beds |
show details | |

|
#25
Willow View Ln
Knoxville, TN 37922
|
1,742 sq. feet
|
3 baths 4 beds |
show details | |

|
#26
Yearling Rd
Knoxville, TN 37932
|
2,142 sq. feet
|
2 baths 3 beds |
show details | |

|
#27
Grenada Blvd
Knoxville, TN 37922
|
2,508 sq. feet
|
2 baths 3 beds |
show details | |

|
#28
Wilnoty Dr
Knoxville, TN 37931
|
1,580 sq. feet
|
2 baths 3 beds |
show details | |

|
#29
Bowers Park Cir
Knoxville, TN 37920
|
1,203 sq. feet
|
2 baths 3 beds |
show details | |

|
#30
Arthur Ave
Maryville, TN 37804
|
836 sq. feet
|
1 baths 3 beds |
show details |
| Photo | Address | Area | Beds / Baths | Price | Details |
|---|---|---|---|---|---|

|
#31
Calderwood Hwy
Maryville, TN 37801
|
1,271 sq. feet
|
2 baths 2 beds |
show details | |

|
#32
Eagle Glen Dr
Knoxville, TN 37922
|
3,664 sq. feet
|
3 baths 4 beds |
show details | |

|
#33
Gilbert Ln
Knoxville, TN 37920
|
2,698 sq. feet
|
2 baths 5 beds |
show details | |

|
#34
Farmstead Ln
Powell, TN 37849
|
2,160 sq. feet
|
2 baths 3 beds |
show details | |

|
#35
Goose Creek Rd
Seymour, TN 37865
|
3,206 sq. feet
|
3 baths 2 beds |
show details | |

|
#36
Old Niles Ferry Pike
Greenback, TN 37742
|
1,689 sq. feet
|
2 baths 3 beds |
show details | |

|
#37
Glen Iris Ln
Knoxville, TN 37934
|
3,249 sq. feet
|
3 baths 4 beds |
show details | |

|
#38
Ironwood Rd
Knoxville, TN 37921
|
1,370 sq. feet
|
1 baths 3 beds |
show details | |

|
#39
Trousdale Rd
Knoxville, TN 37921
|
1,336 sq. feet
|
1 baths 3 beds |
show details | |

|
#40
E Oklahoma Ave
Knoxville, TN 37917
|
1,162 sq. feet
|
1 baths 3 beds |
show details |
| Photo | Address | Area | Beds / Baths | Price | Details |
|---|---|---|---|---|---|

|
#41
Mohawk Cir
Seymour, TN 37865
|
2,354 sq. feet
|
2 baths - beds |
show details | |

|
#42
Kingsmore Dr
Knoxville, TN 37921
|
1,118 sq. feet
|
2 baths 3 beds |
show details | |

|
#43
Kingsmore Dr
Knoxville, TN 37921
|
1,272 sq. feet
|
2 baths 3 beds |
show details | |

|
#44
N 4th Ave
Knoxville, TN 37917
|
925 sq. feet
|
1 baths 2 beds |
show details | |

|
#45
Hawk Crest Ln
Knoxville, TN 37921
|
2,465 sq. feet
|
2 baths 3 beds |
show details | |

|
#46
Chukar Rd
Knoxville, TN 37923
|
1,326 sq. feet
|
2 baths 3 beds |
show details | |

|
#47
Maple Grove Way
Knoxville, TN 37921
|
1,442 sq. feet
|
2 baths 3 beds |
show details | |

|
#48
Miles Ct
Knoxville, TN 37923
|
1,244 sq. feet
|
2 baths 3 beds |
show details | |

|
#49
Sails Way
Knoxville, TN 37932
|
966 sq. feet
|
1 baths 2 beds |
show details | |

|
Check over 1 million property listings on Foreclosure.com!
|
browse all offers | |||

Latest news about housing in Alcoa, TN collected exclusively by city-data.com from local newspapers, TV, and radio stations

 | Apartments in Downtown Maryville Tennessee (5 replies) |
| Our new future home? (49 replies) |
| Igor Blevin's, "A Native Californian in Knoxville" (220 replies) |
| Alcoa, TN (2 replies) |
| Suggestions On Decent Area With Cheap Rental Within 30 Minutes from the City (17 replies) |
| Best Way To Find Rentals in Knoxville/Area Suggestions (1 reply) |
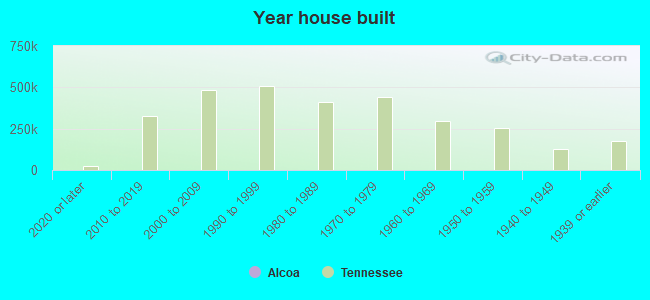
Median year apartment built: 1984
Household type by relationship:
Households: 11,422- Male householders: 2,215 (808 living alone), Female householders: 2,373 (833 living alone)
1,847 spouses (1,828 opposite-sex spouses), 351 unmarried partners, (348 opposite-sex unmarried partners), 3,130 children (2,843 natural, 167 adopted, 119 stepchildren), 308 grandchildren, 190 brothers or sisters, 321 parents, 12 foster children, 248 other relatives, 394 non-relatives
- In group quarters: 27
Size of family households: 1,490 2-persons, 508 3-persons, 395 4-persons, 212 5-persons, 297 6-persons, 37 7-or-more-persons.
Size of nonfamily households: 1,613 1-person, 164 2-persons.
1,334 married couples with children.
809 single-parent households (379 men, 430 women).
91.1% of residents of Alcoa speak English at home.
6.9% of residents speak Spanish at home (36% speak English very well, 17% speak English well, 29% speak English not well, 17% don't speak English at all).
1.9% of residents speak other Indo-European language at home (58% speak English very well, 27% speak English well, 15% speak English not well).
Foreign born population: 889 (7.8%)
(36.7% of them are naturalized citizens)
| Here: | 5.9 |
| State: | 6.5 |
| Here: | 4.3 |
| State: | 4.4 |
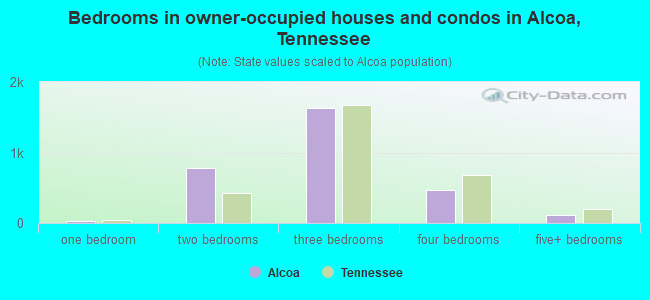
- Bedrooms in owner-occupied houses and condos in Alcoa, Tennessee
- 0no bedroom
- 351 bedroom
- 7872 bedrooms
- 1,6263 bedrooms
- 4744 bedrooms
- 1175+ bedrooms
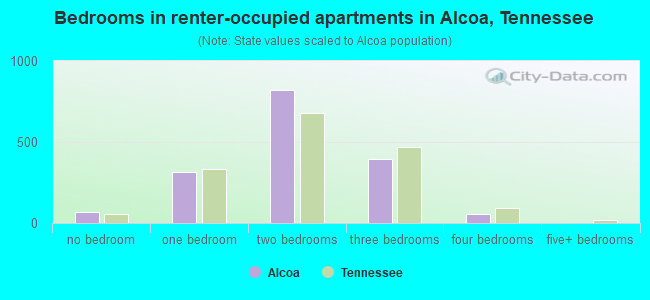
- Bedrooms in renter-occupied apartments in Alcoa, Tennessee
- 65no bedroom
- 3131 bedroom
- 8232 bedrooms
- 3923 bedrooms
- 564 bedrooms
- 05+ bedrooms
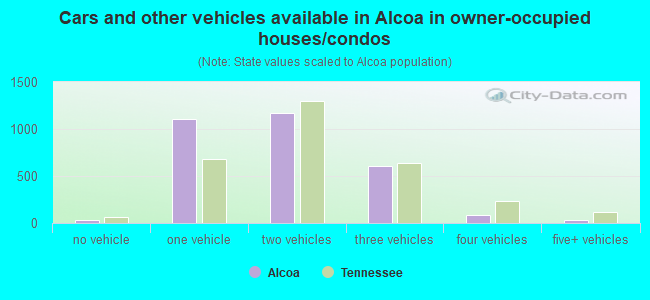
- Cars and other vehicles available in Alcoa in owner-occupied houses/condos
- 35no vehicle
- 1,1101 vehicle
- 1,1662 vehicles
- 6073 vehicles
- 864 vehicles
- 345+ vehicles
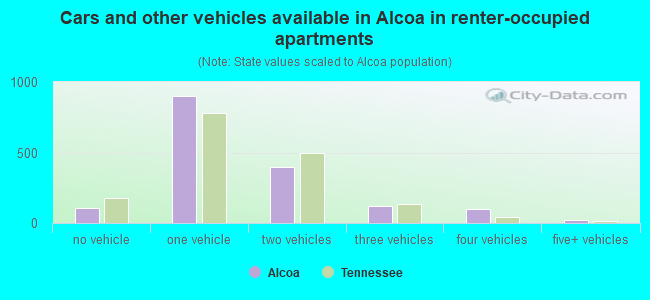
- Cars and other vehicles available in Alcoa in renter-occupied apartments
- 109no vehicle
- 8991 vehicle
- 3992 vehicles
- 1203 vehicles
- 1014 vehicles
- 225+ vehicles
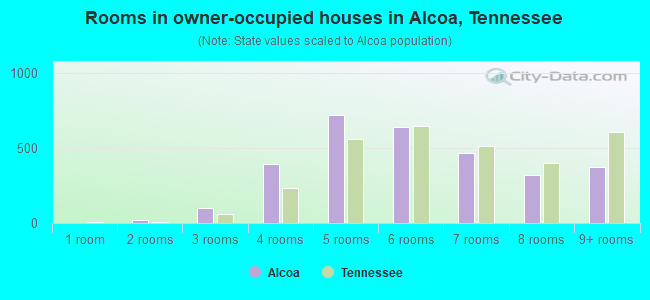
- Rooms in owner-occupied houses in Alcoa, Tennessee
- 01 room
- 202 rooms
- 1023 rooms
- 3924 rooms
- 7225 rooms
- 6416 rooms
- 4657 rooms
- 3228 rooms
- 3739+ rooms
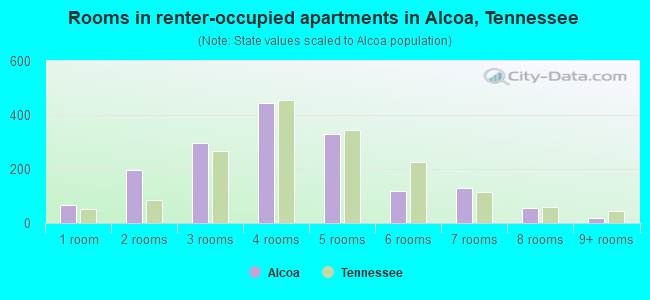
- Rooms in renter-occupied apartments in Alcoa, Tennessee
- 651 room
- 1962 rooms
- 2953 rooms
- 4454 rooms
- 3285 rooms
- 1196 rooms
- 1297 rooms
- 548 rooms
- 199+ rooms
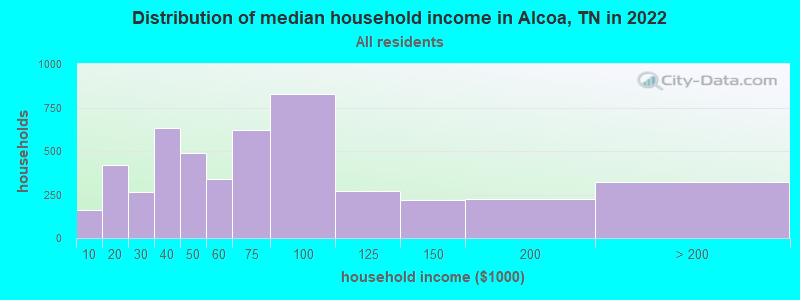
Alcoa, TN household income distribution

- 162Less than $10,000
- 421$10,000 to $19,999
- 264$20,000 to $29,999
- 635$30,000 to $39,999
- 490$40,000 to $49,999
- 337$50,000 to $59,999
- 623$60,000 to $74,999
- 825$75,000 to $99,999
- 271$100,000 to $124,999
- 221$125,000 to $149,999
- 226$150,000 to $199,999
- 319$200,000 or more
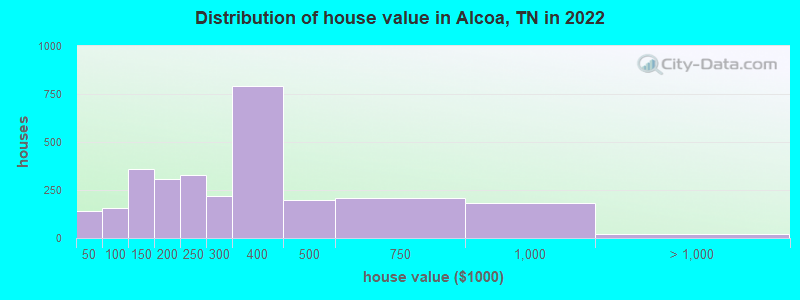
Home value of owner - occupied houses in 2022 in Alcoa, TN
-
- 90Less than $10,000
- 5$15,000 to $19,999
- 12$35,000 to $39,999
- 33$40,000 to $49,999
- 63$50,000 to $59,999
- 16$70,000 to $79,999
- 22$80,000 to $89,999
- 18$90,000 to $99,999
- 68$100,000 to $124,999
- 290$125,000 to $149,999
- 158$150,000 to $174,999
- 147$175,000 to $199,999
- 328$200,000 to $249,999
- 221$250,000 to $299,999
- 789$300,000 to $399,999
- 195$400,000 to $499,999
- 209$500,000 to $749,999
- 179$750,000 to $999,999
- 22$1,000,000 to $1,499,999
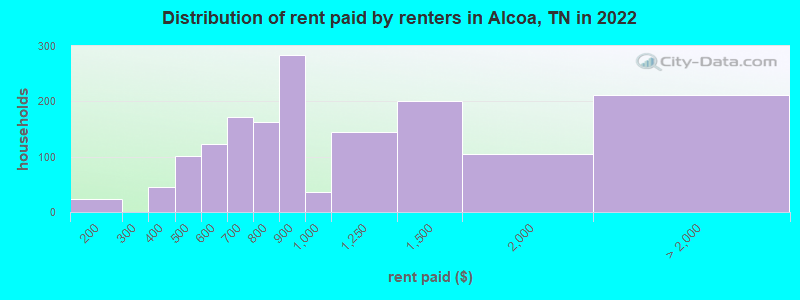
Rent paid by renters in 2022 in Alcoa, TN
-
- 7$100 to $149
- 16$150 to $199
- 44$300 to $349
- 71$400 to $449
- 28$450 to $499
- 70$500 to $549
- 51$550 to $599
- 93$600 to $649
- 77$650 to $699
- 152$700 to $749
- 11$750 to $799
- 283$800 to $899
- 35$900 to $999
- 144$1,000 to $1,249
- 201$1,250 to $1,499
- 103$1,500 to $1,999
- 67$2,000 to $2,499
- 143No cash rent
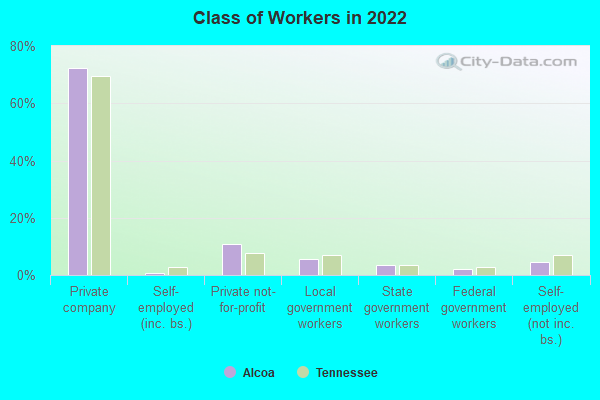
Percentage of workers working in this county: 67.9%
Number of people working at home: 745 (12.5% of all workers)

Travel time to work (commute)
- Less than 5 minutes: 74
- 5 to 9 minutes: 878
- 10 to 14 minutes: 1,087
- 15 to 19 minutes: 581
- 20 to 24 minutes: 553
- 25 to 29 minutes: 432
- 30 to 34 minutes: 486
- 35 to 39 minutes: 189
- 40 to 44 minutes: 4
- 45 to 59 minutes: 391
- 60 to 89 minutes: 179
- 90 or more minutes: 115
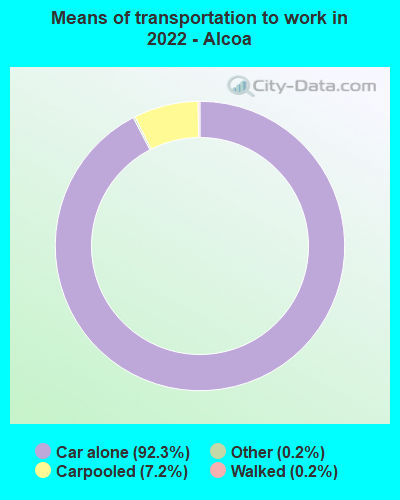
Means of transportation to work:
- Drove a car alone: 13,231 (84.8%)
- Carpooled: 1,097 (7.0%)
- Bus: 8 (0.1%)
- Taxi: 35 (0.2%)
- Walked: 33 (0.2%)
- Worked at home: 745 (4.8%)
- Unemployment by race in 2022
- Unemployment rate for White non-Hispanic residents
- 3.5%Males
- 3.8%Females
- Unemployment rate for Black residents
- 7.9%Males
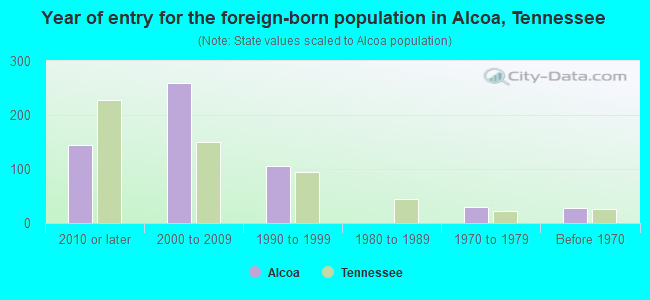
- Year of entry for the foreign-born population in Alcoa, Tennessee
- 1442010 or later
- 2592000 to 2009
- 1061990 to 1999
- 01980 to 1989
- 301970 to 1979
- 28Before 1970
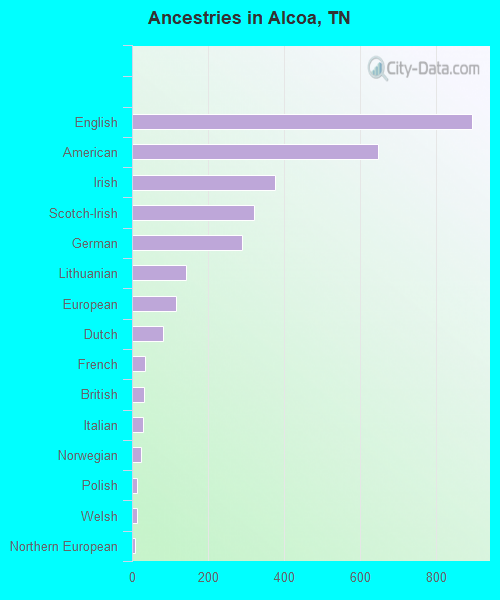
First ancestries reported:
- English: 896 (16.7%)
- American: 649 (12.1%)
- Irish: 376 (7.0%)
- Scotch-Irish: 321 (6.0%)
- German: 290 (5.4%)
- Lithuanian: 141 (2.6%)
- European: 116 (2.2%)
- Dutch: 82 (1.5%)
- French: 34 (0.6%)
- British: 31 (0.6%)
- Italian: 29 (0.5%)
- Norwegian: 23 (0.4%)
- Polish: 14 (0.3%)
- Welsh: 12 (0.2%)
- Northern European: 9 (0.2%)
- Scottish: 8 (0.1%)
Most common places of birth for foreign-born residents (%):
| Alcoa: | 44.0% (398) |
| Tennessee: | 23.0% (86,435) |
| Alcoa: | 12.2% (110) |
| Tennessee: | 6.1% (23,079) |
| Alcoa: | 11.2% (101) |
| Tennessee: | 1.2% (4,587) |
| Alcoa: | 6.0% (54) |
| Tennessee: | 2.7% (10,313) |
| Alcoa: | 5.2% (47) |
| Tennessee: | 2.2% (8,261) |
| Alcoa: | 5.2% (47) |
| Tennessee: | 0.2% (618) |
| Alcoa: | 3.9% (35) |
| Tennessee: | 2.7% (10,295) |
| Alcoa: | 2.9% (26) |
| Tennessee: | 5.7% (21,286) |
| Alcoa: | 1.8% (16) |
| Tennessee: | 2.3% (8,490) |
| Alcoa: | 1.8% (16) |
| Tennessee: | 0.2% (920) |
Place of birth for U.S.-born residents:
- This state: 6,704
- Other state: 3,752
- Northeast: 445
- Midwest: 1,012
- South: 2,037
- West: 214
91.7% of Alcoa residents lived in the same house 1 years ago.
Out of people who lived in different houses, 39.9% lived in this county.
Out of people who lived in different counties, 42.3% lived in Tennessee.
| Alcoa: | 91.7% |
| State average: | 87.0% |
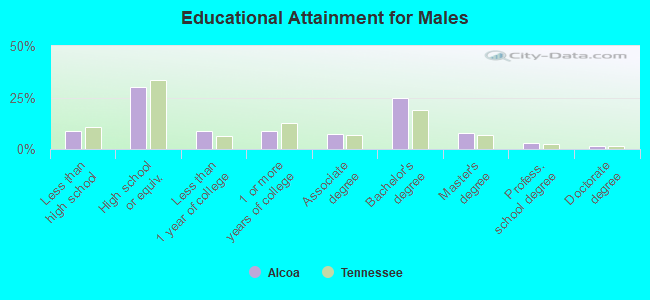
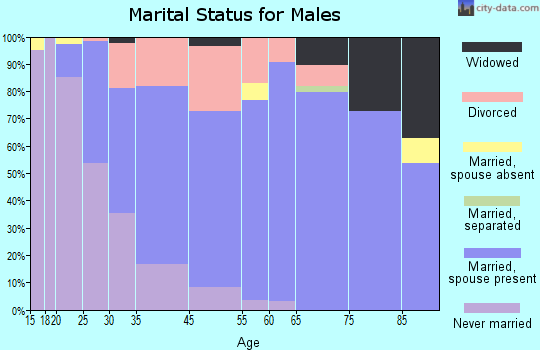
Education attainment for males 25 years and older:
- No schooling: 28
- Nursery to 4th grade: 0
- 5th and 6th grade: 0
- 7th and 8th grade: 0
- 9th grade: 98
- 10th grade: 0
- 11th grade: 128
- 12th grade, no diploma: 101
- High school graduate (or equivalency): 1,242
- Less than 1 year of college: 356
- Some college more than 1 year, no degree: 356
- Associate degree: 305
- Bachelor's degree: 1,034
- Master's degree: 319
- Professional school degree: 127
- Doctorate degree: 53
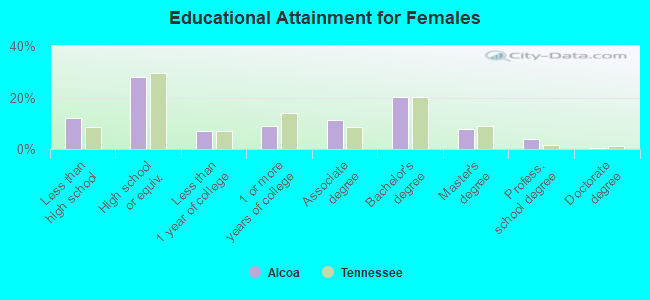
Education attainment for females 25 years and older:
- No schooling: 0
- Nursery to 4th grade: 0
- 5th and 6th grade: 0
- 7th and 8th grade: 21
- 9th grade: 146
- 10th grade: 295
- 11th grade: 22
- 12th grade, no diploma: 32
- High school graduate (or equivalency): 1,189
- Less than 1 year of college: 304
- Some college more than 1 year, no degree: 377
- Associate degree: 481
- Bachelor's degree: 866
- Master's degree: 334
- Professional school degree: 162
- Doctorate degree: 22
Housing units in structures:
- One, detached: 3,656
- One, attached: 22
- Two: 124
- 3 or 4: 302
- 5 to 9: 181
- 10 to 19: 267
- 20 to 49: 355
- 50 or more: 27
- Mobile homes: 265
Median worth of mobile homes: $48,223
Housing units lacking complete kitchen facilities in 2022: 1.3%
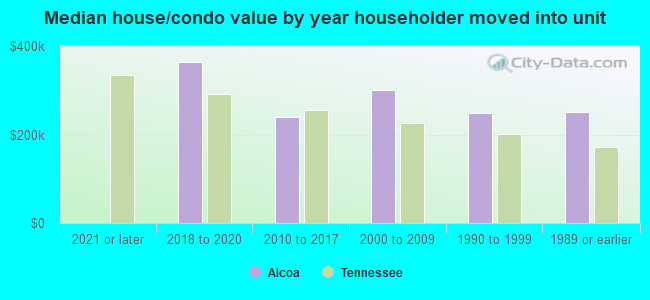
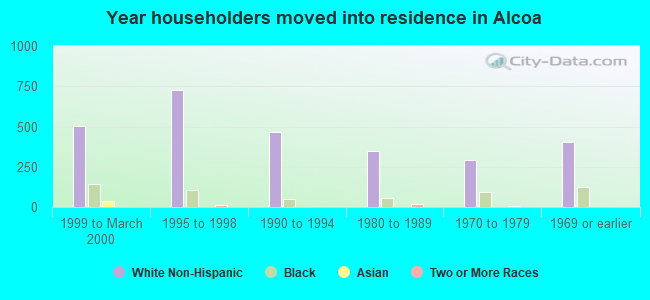
House/condo owner moved in on average 7 years ago
Renter moved in on average 3 years ago
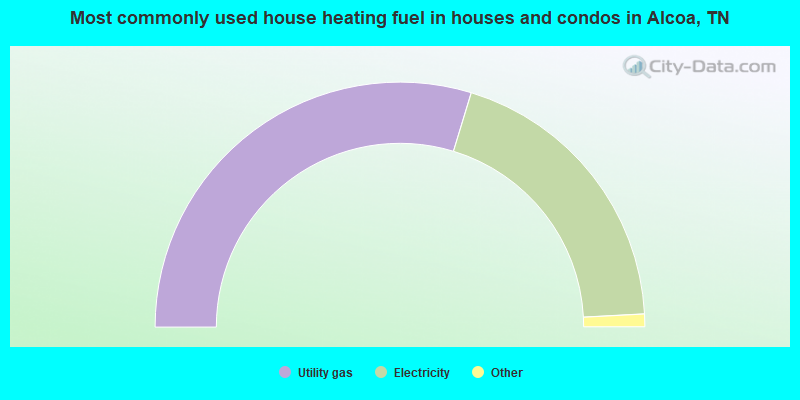
- 59.4%Utility gas
- 38.9%Electricity
- 1.1%Bottled, tank, or LP gas
- 0.6%No fuel used
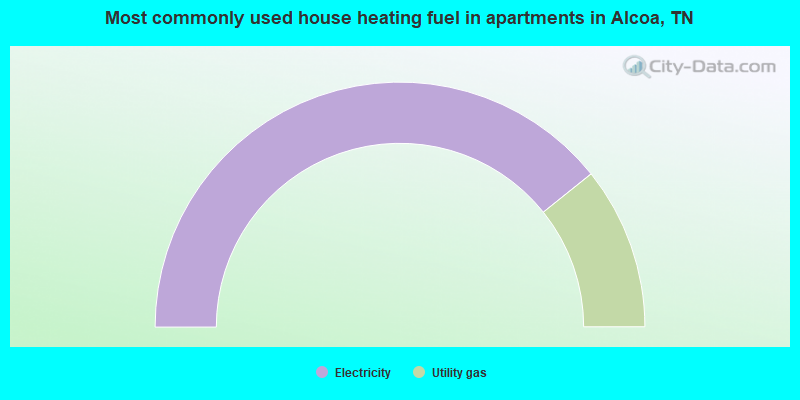
- 78.5%Electricity
- 21.5%Utility gas
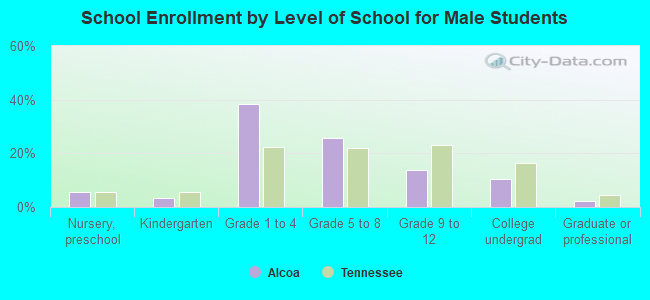
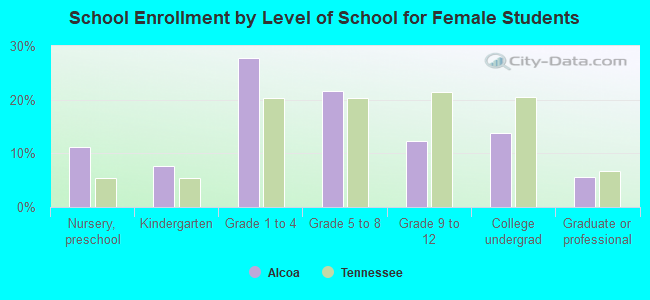
Private vs. public school enrollment:
| Here: | 8.1% |
| Tennessee: | 15.0% |
| Here: | 15.8% |
| Tennessee: | 16.2% |
| Here: | 22.4% |
| Tennessee: | 23.5% |