Albany, NY (New York) Houses and Residents
Estimated median house or condo value in 2022: $221,100 (it was $97,000 in 2000 )
Albany:
$221,100New York:
$400,400
Lower value quartile - upper value quartile: $153,500 - $277,100Mean price in 2022: Detached houses: $256,783 Here:
$256,783State:
$476,719
Townhouses or other attached units: $220,712 Here:
$220,712State:
$699,270
In 2-unit structures: $168,299 Here:
$168,299State:
$713,077
In 3-to-4-unit structures: $132,675 Here:
$132,675State:
$764,568
In 5-or-more-unit structures: $220,122 Here:
$220,122State:
$912,009
Mobile homes: $128,209 Here:
$128,209State:
$88,925
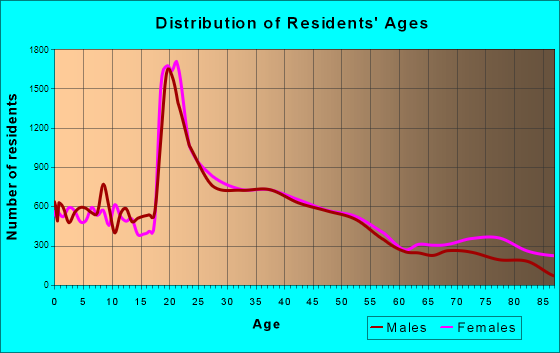
Total population: 98,566 (Urban population: 95,658, Rural population: 0)
Houses: 50,529 (43,179 occupied: 14,336 owner occupied, 28,843 renter occupied )
% of renters here:
67%State:
46%
Housing density: 2,364 houses/condos per square mile
Median price asked for vacant for-sale houses and condos in 2022: $122,623.
Median contract rent in 2022: $914 (lower quartile is $672, upper quartile is $1,210)
Median rent asked for vacant for-rent units in 2022: $892
Median gross rent in Albany, NY in 2022: $1,042
Housing units in Albany with a mortgage: 9,548 (1,220 second mortgage, 0 home equity loan, 1,220 both second mortgage and home equity loan )Houses without a mortgage: 893
Median household income for houses/condos with a mortgage: $116,923
Median household income for apartments without a mortgage: $76,990
Median monthly housing costs: $1,129
Data:
Median house or condo value ($)
Median house or condo value ($ change since 2000)
Median house or condo value ($) - White
Median house or condo value ($) - Black or African American
Median house or condo value ($) - Asian
Median house or condo value ($) - Hispanic or Latino
Median house or condo value ($) - American Indian and Alaska Native
Median house or condo value ($) - Multirace
Median house or condo value ($) - Other Race
Median price asked for mobile homes ($)
Household density (households per square mile)
Mean house or condo value by units in structure - 1, detached ($)
Mean house or condo value by units in structure - 1, attached ($)
Mean house or condo value by units in structure - 2 ($)
Mean house or condo value by units in structure by units in structure - 3 or 4 ($)
Mean house or condo value by units in structure - 5 or more ($)
Mean house or condo value by units in structure - Boat, RV, van, etc. ($)
Mean house or condo value by units in structure - Mobile home ($)
Median contract rent ($)
Median contract rent - Lower quartile ($)
Median contract rent - Upper quartile ($)
Median gross rent ($)
Urban houses (%)
Rural houses (%)
Houses occupied (%)
Houses occupied (% change since 2000)
Houses owner occupied (%)
Houses owner occupied (% change since 2000)
Houses renter occupied (%)
Houses renter occupied (% change since 2000)
Vacant housing units - For rent (%)
Vacant housing units - For rent (% change since 2000)
Vacant housing units - For sale only (%)
Vacant housing units - For sale only (% change since 2000)
Vacant housing units - Rented or sold, not occupied (%)
Vacant housing units - Rented or sold, not occupied (% change since 2000)
Vacant housing units - For seasonal, recreational, or occasional use (%)
Vacant housing units - For seasonal, recreational, or occasional use (% change since 2000)
Vacant housing units - For migrant workers (%)
Vacant housing units - For migrant workers (% change since 2000)
Vacant housing units - Other vacant (%)
Vacant housing units - Other vacant (% change since 2000)
Median monthly housing costs ($)
Median household income for houses/condos with a mortgage ($)
Median household income for houses/condos without a mortgage ($)
Median household income ($)
Median household income ($) - White
Median household income ($) - Black or African American
Median household income ($) - Asian
Median household income ($) - Hispanic or Latino
Median household income ($) - American Indian and Alaska Native
Median household income ($) - Multirace
Median household income ($) - Other Race
Mortgage status - with mortgage (%)
Mortgage status - with second mortgage (%)
Mortgage status - with home equity loan (%)
Mortgage status - with both second mortgage and home equity loan (%)
Mortgage status - without a mortgage (%)
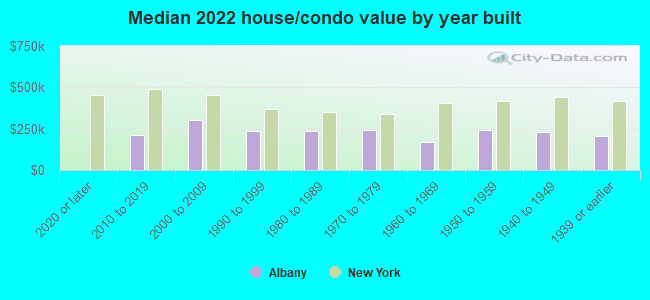
Median year house/condo built
Median year apartment built
Household type by relationship - Male householder living alone (%)
Household type by relationship - Male householder not living alone (%)
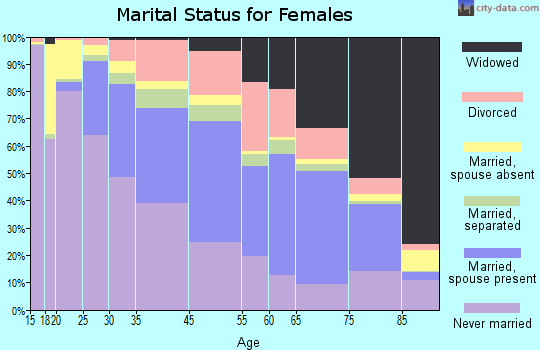
Household type by relationship - Female householder living alone (%)
Household type by relationship - Female householder not living alone (%)
Household type by relationship - Opposite-Sex spouse (%)
Household type by relationship - Same-Sex spouse (%)
Household type by relationship - Opposite-Sex unmarried partner (%)
Household type by relationship - Same-Sex unmarried partner (%)
Household type by relationship - In group quarters (%)
Size of family households - 2-person household (%)
Size of family households - 3-person household (%)
Size of family households - 4-person household (%)
Size of family households - 5-person household (%)
Size of family households - 6-person household (%)
Size of family households - 7-or-more-person household (%)
Size of nonfamily households - 1-person household (%)
Size of nonfamily households - 2-person household (%)
Size of nonfamily households - 3-person household (%)
Size of nonfamily households - 4-person household (%)
Size of nonfamily households - 5-person household (%)
Size of nonfamily households - 6-person household (%)
Size of nonfamily households - 7-or-moreperson household (%)
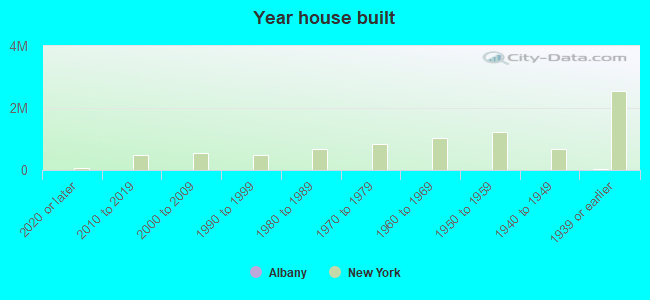
Year house built - Built 2010 or later (%)
Year house built - Built 2000 to 2009 (%)
Year house built - Built 1990 to 1999 (%)
Year house built - Built 1980 to 1989 (%)
Year house built - Built 1970 to 1979 (%)
Year house built - Built 1960 to 1969 (%)
Year house built - Built 1950 to 1959 (%)
Year house built - Built 1940 to 1949 (%)
Year house built - Built 1939 or earlier (%)
Median number of rooms in houses and condos
Median number of rooms in apartments
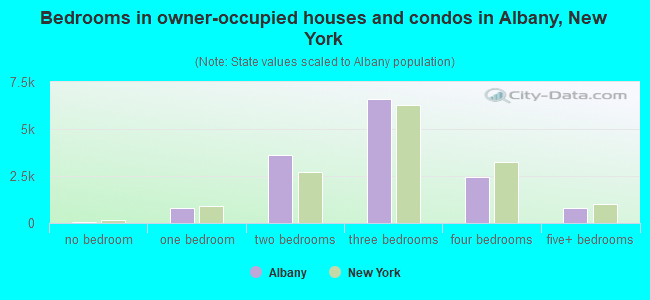
Median number of bedrooms in owner occupied houses
Mean number of bedrooms in owner occupied houses
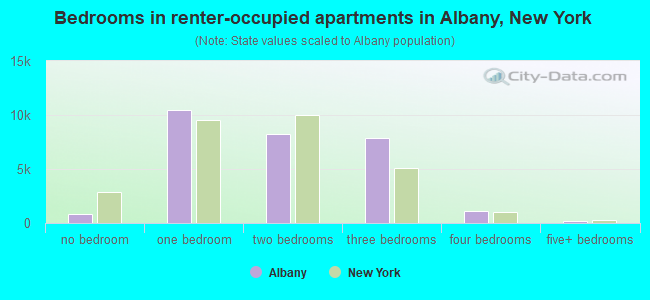
Median number of bedrooms in renter occupied houses
Mean number of bedrooms in renter occupied houses
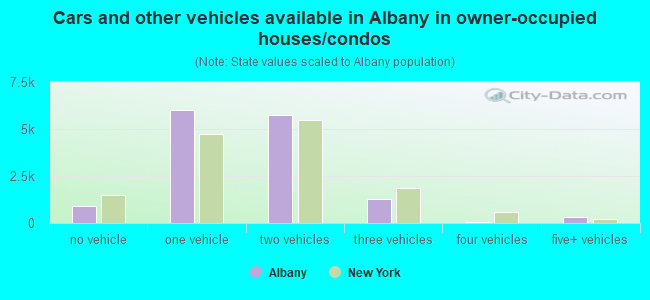
Median number of vehichles in owner occupied houses
Mean number of vehichles in owner occupied houses
Median number of vehichles in renter occupied houses
Mean number of vehichles in renter occupied houses
Rooms in owner-occupied houses - 1 room (%)
Rooms in owner-occupied houses - 2 rooms (%)
Rooms in owner-occupied houses - 3 rooms (%)
Rooms in owner-occupied houses - 4 rooms (%)
Rooms in owner-occupied houses - 5 rooms (%)
Rooms in owner-occupied houses - 6 rooms (%)
Rooms in owner-occupied houses - 7 rooms (%)
Rooms in owner-occupied houses - 8 rooms (%)
Rooms in owner-occupied houses - 9+ rooms (%)
Rooms in renter-occupied houses - 1 room (%)
Rooms in renter-occupied houses - 2 rooms (%)
Rooms in renter-occupied houses - 3 rooms (%)
Rooms in renter-occupied houses - 4 rooms (%)
Rooms in renter-occupied houses - 5 rooms (%)
Rooms in renter-occupied houses - 6 rooms (%)
Rooms in renter-occupied houses - 7 rooms (%)
Rooms in renter-occupied houses - 8 rooms (%)
Rooms in renter-occupied houses - 9+ rooms (%)
Bedrooms in owner-occupied houses - no bedrooms (%)
Bedrooms in owner-occupied houses - 1 bedroom (%)
Bedrooms in owner-occupied houses - 2 bedrooms (%)
Bedrooms in owner-occupied houses - 3 bedrooms (%)
Bedrooms in owner-occupied houses - 4 bedrooms (%)
Bedrooms in owner-occupied houses - 5+ bedrooms (%)
Bedrooms in renter-occupied houses - no bedrooms (%)
Bedrooms in renter-occupied houses - 1 bedroom (%)
Bedrooms in renter-occupied houses - 2 bedrooms (%)
Bedrooms in renter-occupied houses - 3 bedrooms (%)
Bedrooms in renter-occupied houses - 4 bedrooms (%)
Bedrooms in renter-occupied houses - 5+ bedrooms (%)
Vehicles available in owner-occupied houses - no vehicle available (%)
Vehicles available in owner-occupied houses - 1 vehicle available(%)
Vehicles available in owner-occupied houses - 2 Vehicles available (%)
Vehicles available in owner-occupied houses - 3 Vehicles available (%)
Vehicles available in owner-occupied houses - 4 Vehicles available (%)
Vehicles available in owner-occupied houses - 5+ Vehicles available (%)
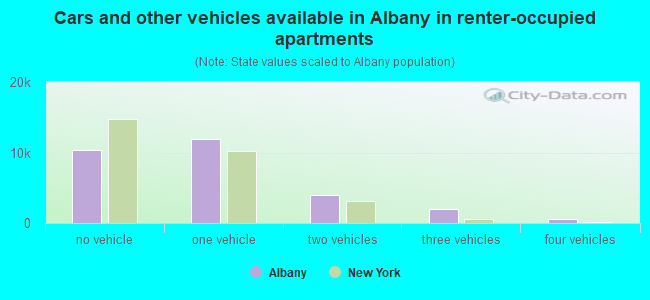
Vehicles available in renter-occupied houses - no vehicle available (%)
Vehicles available in renter-occupied houses - 1 vehicle available (%)
Vehicles available in renter-occupied houses - 2 Vehicles available (%)
Vehicles available in renter-occupied houses - 3 Vehicles available (%)
Vehicles available in renter-occupied houses - 4 Vehicles available (%)
Vehicles available in renter-occupied houses - 5+ Vehicles available (%)
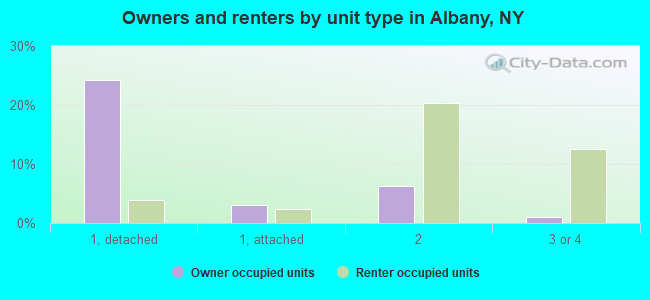
Housing units in structures - 1, detached (%)
Housing units in structures - 1, attached (%)
Housing units in structures - 2 (%)
Housing units in structures - 3 or 4 (%)
Housing units in structures - 5 to 9 (%)
Housing units in structures - 10 to 19 (%)
Housing units in structures - 20 to 49 (%)
Housing units in structures - 50 or more (%)
Housing units in structures - Mobile home (%)
Housing units in structures - Boat, RV, van, etc. (%)
Housing units in structures - Owners - 1, detached (%)
Housing units in structures - Owners - 1, attached (%)
Housing units in structures - Owners - 2 (%)
Housing units in structures - Owners - 3 or 4 (%)
Housing units in structures - Owners - 5 to 9 (%)
Housing units in structures - Owners - 10 to 19 (%)
Housing units in structures - Owners - 20 to 49 (%)
Housing units in structures - Owners - 50 or more (%)
Housing units in structures - Owners - Mobile home (%)
Housing units in structures - Owners - Boat, RV, van, etc. (%)
Housing units in structures - Renters - 1, detached (%)
Housing units in structures - Renters - 1, attached (%)
Housing units in structures - Renters - 2 (%)
Housing units in structures - Renters - 3 or 4 (%)
Housing units in structures - Renters - 5 to 9 (%)
Housing units in structures - Renters - 10 to 19 (%)
Housing units in structures - Renters - 20 to 49 (%)
Housing units in structures - Renters - 50 or more (%)
Housing units in structures - Renters - Mobile home (%)
Housing units in structures - Renters - Boat, RV, van, etc. (%)
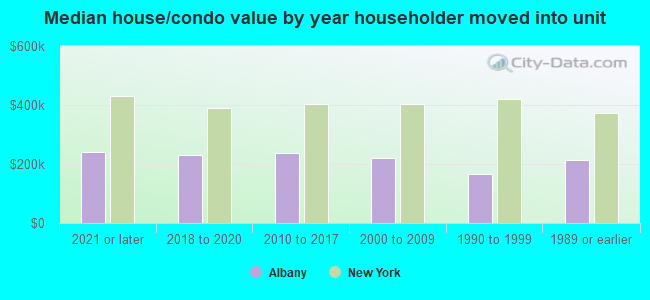
House/condo owner moved in on average (years ago)
Renter moved in on average (years ago)
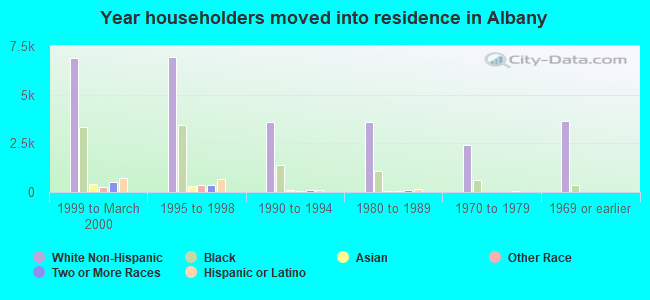
Year householder moved into unit - Moved in 1999 to March 2000 (%)
Year householder moved into unit - Moved in 1999 to March 2000 (%) - White
Year householder moved into unit - Moved in 1999 to March 2000 (%) - Black or African American
Year householder moved into unit - Moved in 1999 to March 2000 (%) - Asian
Year householder moved into unit - Moved in 1999 to March 2000 (%) - Hispanic or Latino
Year householder moved into unit - Moved in 1999 to March 2000 (%) - American Indian and Alaska Native
Year householder moved into unit - Moved in 1999 to March 2000 (%) - Multirace
Year householder moved into unit - Moved in 1999 to March 2000 (%) - Other Race
Year householder moved into unit - Moved in 1995 to 1998 (%)
Year householder moved into unit - Moved in 1995 to 1998 (%) - White
Year householder moved into unit - Moved in 1995 to 1998 (%) - Black or African American
Year householder moved into unit - Moved in 1995 to 1998 (%) - Asian
Year householder moved into unit - Moved in 1995 to 1998 (%) - Hispanic or Latino
Year householder moved into unit - Moved in 1995 to 1998 (%) - American Indian and Alaska Native
Year householder moved into unit - Moved in 1995 to 1998 (%) - Multirace
Year householder moved into unit - Moved in 1995 to 1998 (%) - Other Race
Year householder moved into unit - Moved in 1990 to 1994 (%)
Year householder moved into unit - Moved in 1990 to 1994 (%) - White
Year householder moved into unit - Moved in 1990 to 1994 (%) - Black or African American
Year householder moved into unit - Moved in 1990 to 1994 (%) - Asian
Year householder moved into unit - Moved in 1990 to 1994 (%) - Hispanic or Latino
Year householder moved into unit - Moved in 1990 to 1994 (%) - American Indian and Alaska Native
Year householder moved into unit - Moved in 1990 to 1994 (%) - Multirace
Year householder moved into unit - Moved in 1990 to 1994 (%) - Other Race
Year householder moved into unit - Moved in 1980 to 1989 (%)
Year householder moved into unit - Moved in 1980 to 1989 (%) - White
Year householder moved into unit - Moved in 1980 to 1989 (%) - Black or African American
Year householder moved into unit - Moved in 1980 to 1989 (%) - Asian
Year householder moved into unit - Moved in 1980 to 1989 (%) - Hispanic or Latino
Year householder moved into unit - Moved in 1980 to 1989 (%) - American Indian and Alaska Native
Year householder moved into unit - Moved in 1980 to 1989 (%) - Multirace
Year householder moved into unit - Moved in 1980 to 1989 (%) - Other Race
Year householder moved into unit - Moved in 1970 to 1979 (%)
Year householder moved into unit - Moved in 1970 to 1979 (%) - White
Year householder moved into unit - Moved in 1970 to 1979 (%) - Black or African American
Year householder moved into unit - Moved in 1970 to 1979 (%) - Asian
Year householder moved into unit - Moved in 1970 to 1979 (%) - Hispanic or Latino
Year householder moved into unit - Moved in 1970 to 1979 (%) - American Indian and Alaska Native
Year householder moved into unit - Moved in 1970 to 1979 (%) - Multirace
Year householder moved into unit - Moved in 1970 to 1979 (%) - Other Race
Year householder moved into unit - Moved in 1969 or earlier (%)
Year householder moved into unit - Moved in 1969 or earlier (%) - White
Year householder moved into unit - Moved in 1969 or earlier (%) - Black or African American
Year householder moved into unit - Moved in 1969 or earlier (%) - Asian
Year householder moved into unit - Moved in 1969 or earlier (%) - Hispanic or Latino
Year householder moved into unit - Moved in 1969 or earlier (%) - American Indian and Alaska Native
Year householder moved into unit - Moved in 1969 or earlier (%) - Multirace
Year householder moved into unit - Moved in 1969 or earlier (%) - Other Race
Housing units lacking complete plumbing facilities (%)
Housing units lacking complete kitchen facilities (%)
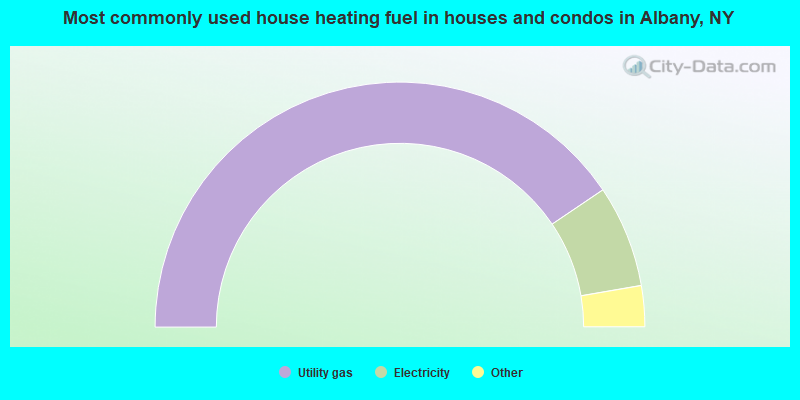
House heating fuel used in houses and condos - Utility gas (%)
House heating fuel used in houses and condos - Bottled, tank, or LP gas (%)
House heating fuel used in houses and condos - Electricity (%)
House heating fuel used in houses and condos - Fuel oil, kerosene, etc. (%)
House heating fuel used in houses and condos - Coal or coke (%)
House heating fuel used in houses and condos - Wood (%)
House heating fuel used in houses and condos - Solar energy (%)
House heating fuel used in houses and condos - Other fuel (%)
House heating fuel used in houses and condos - No fuel used (%)
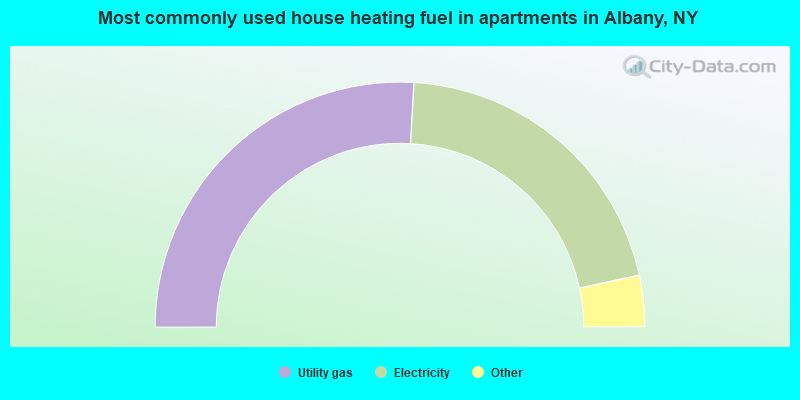
House heating fuel used in apartments - Utility gas (%)
House heating fuel used in apartments - Bottled, tank, or LP gas (%)
House heating fuel used in apartments - Electricity (%)
House heating fuel used in apartments - Fuel oil, kerosene, etc. (%)
House heating fuel used in apartments - Coal or coke (%)
House heating fuel used in apartments - Wood (%)
House heating fuel used in apartments - Solar energy (%)
House heating fuel used in apartments - Other fuel (%)
House heating fuel used in apartments - No fuel used (%)
Latest news about housing in Albany, NY collected exclusively by city-data.com from local newspapers, TV, and radio stations
Median year house/condo built: 1944Median year apartment built: 1954Household type by relationship:
Households: 100,832
Male householders: 21,329 (8,984 living alone ), Female householders: 21,850 (9,071 living alone )10,058 spouses (9,702 opposite-sex spouses ), 6,074 unmarried partners , (5,251 opposite-sex unmarried partners ), 18,110 children (17,160 natural , 368 adopted , 582 stepchildren ), 3,822 grandchildren , 1,045 brothers or sisters , 357 parents , 174 foster children , 663 other relatives , 6,179 non-relatives In group quarters: 11,171
Size of family households: 7,395 2-persons , 5,704 3-persons , 2,413 4-persons , 1,070 5-persons , 507 6-persons , 337 7-or-more-persons .
Size of nonfamily households: 18,055 1-person , 5,978 2-persons , 1,079 3-persons , 641 4-persons .
5,374 married couples with children. single-parent households (1,910 men , 2,872 women ).
82.4% of residents of Albany speak English at home. of residents speak Spanish at home (62% speak English very well , 32% speak English well , 6% speak English not well , 1% don't speak English at all ).of residents speak other Indo-European language at home (68% speak English very well , 23% speak English well , 7% speak English not well , 2% don't speak English at all ).of residents speak Asian or Pacific Island language at home (56% speak English very well , 16% speak English well , 15% speak English not well , 14% don't speak English at all ).of residents speak other language at home (79% speak English very well , 16% speak English well , 5% speak English not well ).
Foreign born population: 11,756 (11.7%)of them are naturalized citizens )
Median number of rooms in houses and condos:
Median number of rooms in apartments
Owner-occupied Renter-occupied
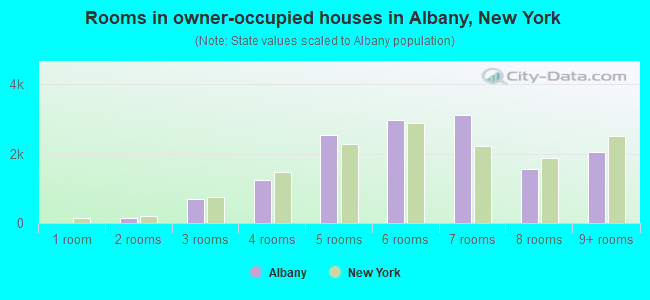
Rooms in owner-occupied houses in Albany, New York
0 1 room 156 2 rooms 694 3 rooms 1,233 4 rooms 2,542 5 rooms 2,987 6 rooms 3,119 7 rooms 1,554 8 rooms 2,051 9+ rooms
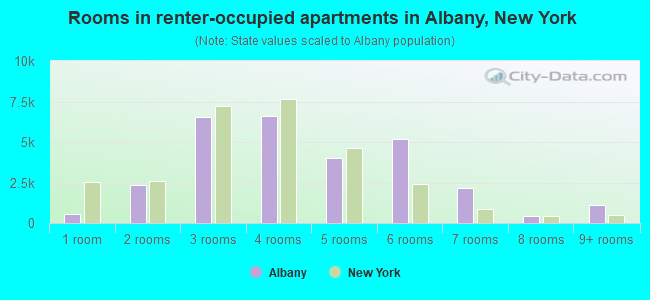
Rooms in renter-occupied apartments in Albany, New York
526 1 room 2,323 2 rooms 6,516 3 rooms 6,613 4 rooms 3,993 5 rooms 5,159 6 rooms 2,153 7 rooms 442 8 rooms 1,118 9+ rooms
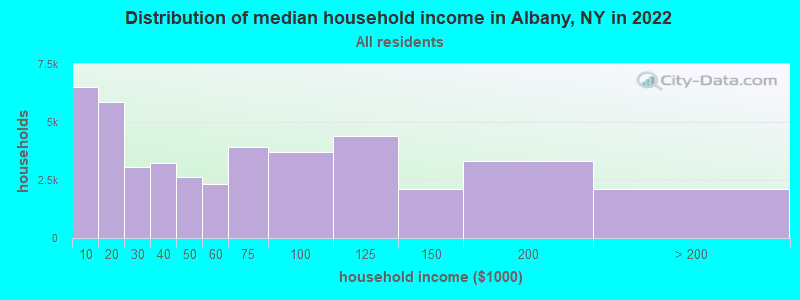
Albany, NY household income distribution 6,490 Less than $10,0005,853 $10,000 to $19,9993,073 $20,000 to $29,9993,222 $30,000 to $39,9992,645 $40,000 to $49,9992,315 $50,000 to $59,9993,904 $60,000 to $74,9993,702 $75,000 to $99,9994,407 $100,000 to $124,9992,108 $125,000 to $149,9993,335 $150,000 to $199,9992,125 $200,000 or more
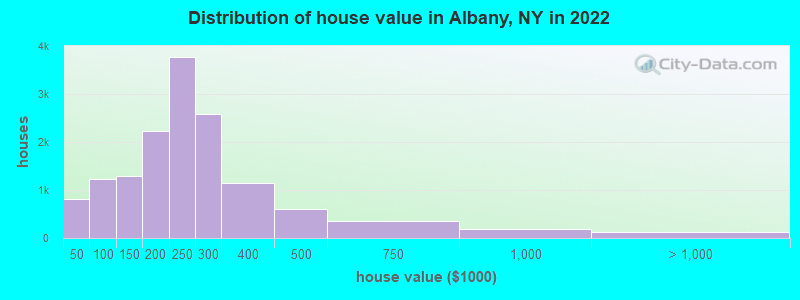
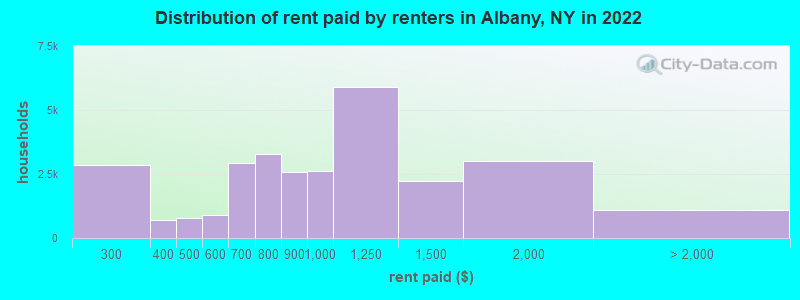
Home value of owner - occupied houses in 2022 in Albany, NY 618 Less than $10,00060 $20,000 to $24,99944 $25,000 to $29,99943 $30,000 to $34,99955 $35,000 to $39,999322 $60,000 to $69,999288 $70,000 to $79,999238 $80,000 to $89,999391 $90,000 to $99,999587 $100,000 to $124,999708 $125,000 to $149,9991,649 $150,000 to $174,999571 $175,000 to $199,9993,776 $200,000 to $249,9992,589 $250,000 to $299,9991,146 $300,000 to $399,999598 $400,000 to $499,999351 $500,000 to $749,999183 $750,000 to $999,99947 $1,000,000 to $1,499,99972 $2,000,000 or moreRent paid by renters in 2022 in Albany, NY 1,608 $200 to $2491,248 $250 to $299687 $300 to $349555 $400 to $449222 $450 to $499327 $500 to $549583 $550 to $5991,211 $600 to $6491,708 $650 to $6991,248 $700 to $7492,024 $750 to $7992,594 $800 to $8992,625 $900 to $9995,884 $1,000 to $1,2492,218 $1,250 to $1,4993,025 $1,500 to $1,999610 $2,000 to $2,499278 $2,500 to $2,99989 $3,000 to $3,49942 $3,500 or more57 No cash rent
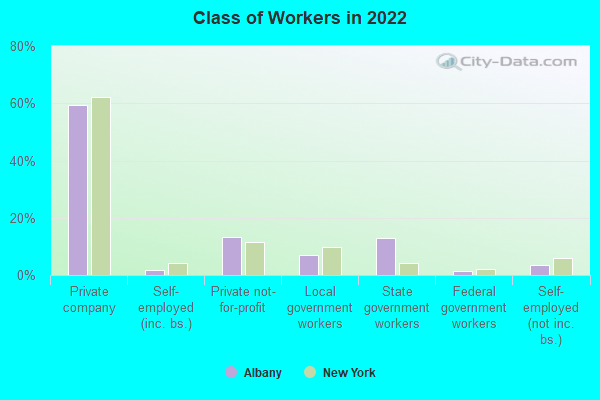
Percentage of workers working in this county: 79.0%Number of people working at home: 6,828 (14.0% of all workers )
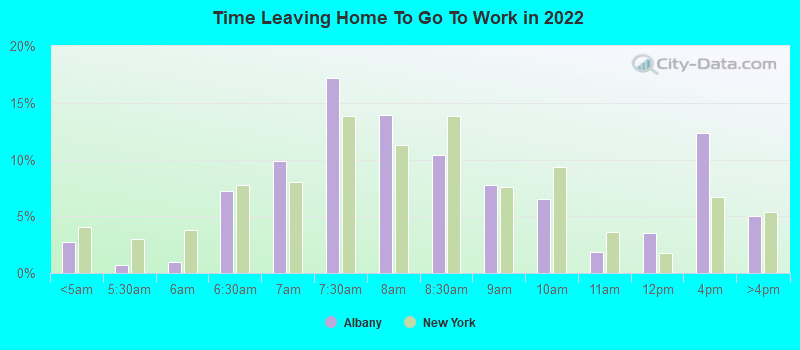
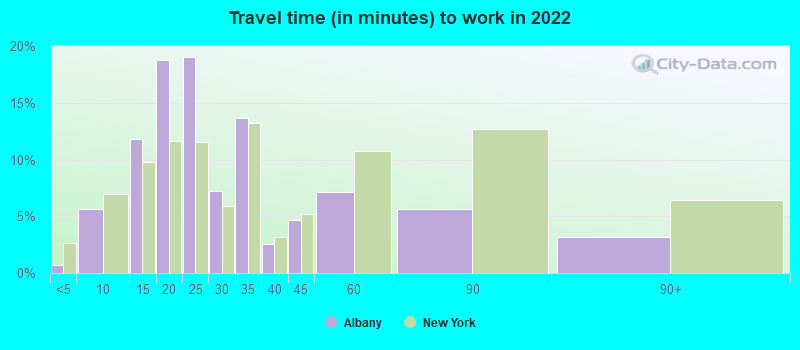
Travel time to work (commute)
Less than 5 minutes: 4195 to 9 minutes: 3,55410 to 14 minutes: 9,43215 to 19 minutes: 8,97820 to 24 minutes: 7,85425 to 29 minutes: 1,99630 to 34 minutes: 3,89335 to 39 minutes: 69040 to 44 minutes: 1,62145 to 59 minutes: 47460 to 89 minutes: 2,11590 or more minutes: 734
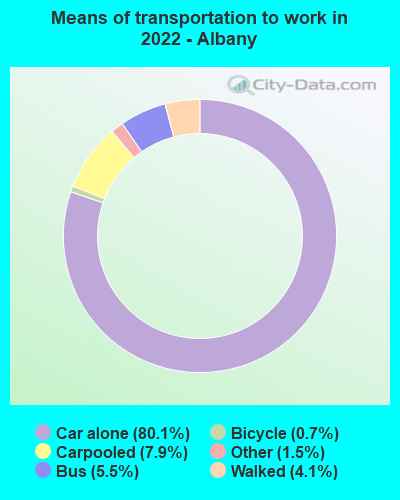
Means of transportation to work:
Drove a car alone: 69,648 (74.8%)Carpooled: 6,873 (7.4%)Bus : 4,795 (5.2%)Subway or elevated rail : 50 (0.1%)Long-distance train or commuter rail : 77 (0.1%)Light rail, streetcar or trolley : 74 (0.1%)Taxi: 1,272 (1.4%)Bicycle: 621 (0.7%)Walked: 3,579 (3.8%)Worked at home: 6,092 (6.5%)
Unemployment by race in 2022
Unemployment rate for White non-Hispanic residents 6.1% Males5.8% FemalesUnemployment rate for Black residents 26.0% Males7.8% FemalesUnemployment rate for American Indian and Alaska Native residents 28.9% FemalesUnemployment rate for Asian residents 6.3% Males4.7% FemalesUnemployment rate for other race residents 4.6% Males5.1% FemalesUnemployment rate for two or more race residents 10.2% Males9.7% FemalesUnemployment rate for Hispanic or Latino residents 9.5% Males15.0% Females
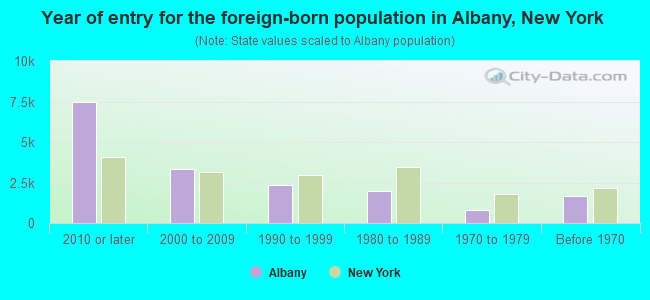
Year of entry for the foreign-born population in Albany, New York
7,466 2010 or later 3,332 2000 to 2009 2,340 1990 to 1999 1,997 1980 to 1989 825 1970 to 1979 1,691 Before 1970
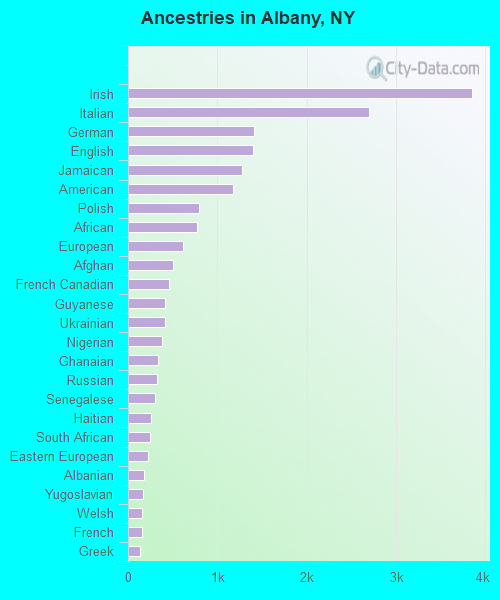
First ancestries reported:
Irish: 3,847 (8.5%)
Italian: 2,697 (6.0%)
German: 1,408 (3.1%)
English: 1,396 (3.1%)
Jamaican: 1,280 (2.8%)
American: 1,180 (2.6%)
Polish: 798 (1.8%)
African: 774 (1.7%)
European: 615 (1.4%)
Afghan: 502 (1.1%)
French Canadian: 463 (1.0%)
Guyanese: 418 (0.9%)
Ukrainian: 413 (0.9%)
Nigerian: 384 (0.9%)
Ghanaian: 337 (0.7%)
Russian: 328 (0.7%)
Senegalese: 299 (0.7%)
Haitian: 258 (0.6%)
South African: 248 (0.5%)
Eastern European: 225 (0.5%)
Albanian: 179 (0.4%)
Yugoslavian: 170 (0.4%)
Welsh: 159 (0.4%)
French: 154 (0.3%)
Greek: 133 (0.3%)
Scotch-Irish: 129 (0.3%)
Hungarian: 113 (0.3%)
Croatian: 110 (0.2%)
Scandinavian: 100 (0.2%)
Iraqi: 100 (0.2%)
West Indian: 90 (0.2%)
Trinidadian and Tobagonian: 89 (0.2%)
Syrian: 80 (0.2%)
Danish: 72 (0.2%)
British: 69 (0.2%)
Turkish: 65 (0.1%)
German Russian: 64 (0.1%)
Scottish: 63 (0.1%)
Northern European: 54 (0.1%)
Bulgarian: 45 (0.10%)
Celtic: 45 (0.10%)
Czech: 42 (0.09%)
Brazilian: 41 (0.09%)
Austrian: 38 (0.08%)
Romanian: 36 (0.08%)
Swedish: 36 (0.08%)
Armenian: 34 (0.08%)
Canadian: 33 (0.07%)
Belgian: 30 (0.07%)
Dutch: 30 (0.07%)
Barbadian: 28 (0.06%)
Israeli: 24 (0.05%)
Portuguese: 21 (0.05%)
Egyptian: 21 (0.05%)
Finnish: 20 (0.04%)
Sudanese: 19 (0.04%)
Norwegian: 18 (0.04%)
Slovak: 18 (0.04%)
British West Indian: 15 (0.03%)
Iranian: 8 (0.02%)
Serbian: 7 (0.02%)
Slovene: 6 (0.01%)
Bahamian: 6 (0.01%)
Most common places of birth for foreign-born residents (%): Jamaica Albany:
7.1% (1,041)New York:
5.0% (227,557)
China, excluding Hong Kong and Taiwan Albany:
6.5% (949)New York:
9.1% (410,910)
Guyana Albany:
6.2% (906)New York:
3.8% (172,129)
Dominican Republic Albany:
5.7% (826)New York:
11.1% (501,040)
Burma (Myanmar) Albany:
4.4% (640)New York:
0.4% (16,179)
Philippines Albany:
4.1% (590)New York:
2.0% (91,070)
Pakistan Albany:
3.9% (570)New York:
1.4% (62,442)
India Albany:
3.8% (551)New York:
3.5% (158,432)
Afghanistan Albany:
3.3% (479)New York:
0.2% (8,745)
Ecuador Albany:
2.9% (417)New York:
3.9% (177,448)
Bangladesh Albany:
2.5% (359)New York:
2.6% (117,288)
Tanzania Albany:
2.4% (352)New York:
0.0% (1,858)
Canada Albany:
2.2% (324)New York:
1.3% (59,107)
Iraq Albany:
2.0% (288)New York:
0.1% (6,152)
Nigeria Albany:
1.9% (283)New York:
0.7% (33,746)
Ukraine Albany:
1.9% (277)New York:
1.7% (78,421)
Korea Albany:
1.9% (270)New York:
1.8% (82,786)
Italy Albany:
1.7% (250)New York:
1.8% (81,374)
Germany Albany:
1.7% (242)New York:
0.9% (38,713)
El Salvador Albany:
1.6% (240)New York:
2.4% (108,067)
Ghana Albany:
1.6% (232)New York:
0.9% (39,058)
Place of birth for U.S.-born residents:
This state: 71,889Other state: 15,698Northeast: 7,281Midwest: 683South: 4,518West: 3,216 76.5% of Albany residents lived in the same house 1 years ago.
Out of people who lived in different houses, 25.4% lived in this county.
Out of people who lived in different counties, 85.4% lived in New York.
Albany:
76.5%State average:
89.6%
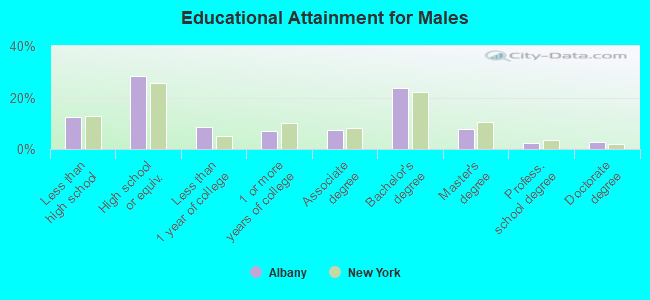
Education attainment for males 25 years and older:
No schooling: 784Nursery to 4th grade: 1395th and 6th grade: 827th and 8th grade: 6959th grade: 39010th grade: 39411th grade: 45612th grade, no diploma: 882High school graduate (or equivalency): 8,728Less than 1 year of college: 2,591Some college more than 1 year, no degree: 2,118Associate degree: 2,249Bachelor's degree: 7,280Master's degree: 2,430Professional school degree: 701Doctorate degree: 839
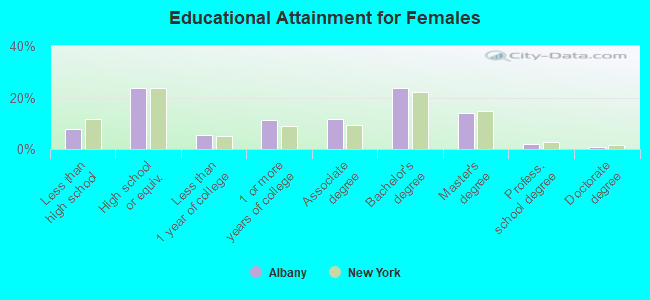
Education attainment for females 25 years and older:
No schooling: 85Nursery to 4th grade: 05th and 6th grade: 1697th and 8th grade: 449th grade: 9310th grade: 24011th grade: 44412th grade, no diploma: 1,258High school graduate (or equivalency): 7,240Less than 1 year of college: 1,612Some college more than 1 year, no degree: 3,396Associate degree: 3,535Bachelor's degree: 7,281Master's degree: 4,312Professional school degree: 617Doctorate degree: 267
Housing units in structures:
One, detached: 12,550One, attached: 3,120Two: 14,7993 or 4: 6,7455 to 9: 4,66510 to 19: 2,54220 to 49: 1,81850 or more: 4,152Mobile homes: 138Housing units lacking complete plumbing facilities in 2022: 0.8%Housing units lacking complete kitchen facilities in 2022: 0.5%House/condo owner moved in on average 14 years ago
Renter moved in on average 3 years ago
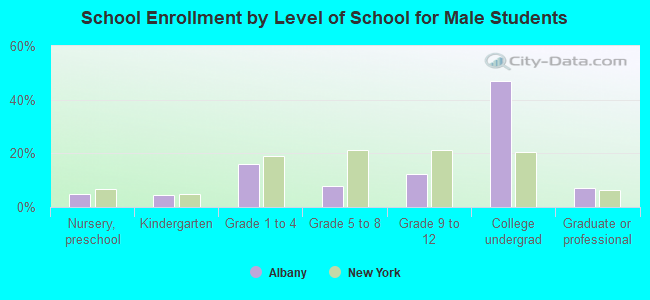
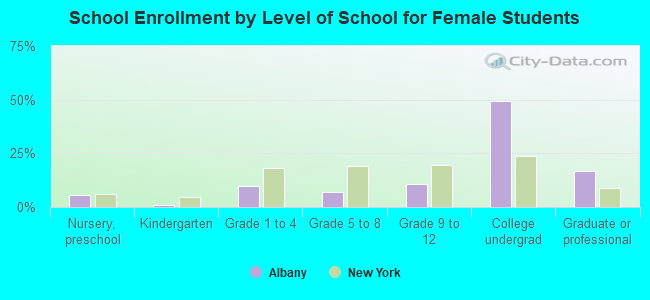
Private vs. public school enrollment:
Students in private schools in grades 1 to 8 (elementary and middle school): 615 Students in private schools in grades 9 to 12 (high school): 428 Students in private undergraduate colleges: 2,924