| Fire incidents reported |
|---|
| Sreet name | Count |
|---|
| MAIN ST | 66 | | KINGSTON ST | 10 | | CHURCH ST | 6 | | FRED RODGERS DR | 6 | | LATROBE ST | 6 | | YOUNGSTOWN RIDGE RD | 6 | | 6TH ST | 4 | | EDGEWATER TERRACE | 4 | | FROSTY LANE | 4 | | FROSTY RD | 4 | | MAJORSKY WAY | 4 | | MANOR AVE | 4 | | PURITON AVE | 4 | | ROUTE 982 UNITY | 4 | | SOLOMAN TEMPLE RD | 4 | | YOUNGSTOWN RD | 4 | | ALANTIS DRIVE | 2 | | ANN ST | 2 | | ANNE ST. | 2 | | ARNOLD PALMER DRIVE | 2 | | ATLANTIS RD | 2 | | BEACHWOOD DR | 2 | | BEATTY COUNTY RD | 2 | | BETHAL CHURCH RD | 2 | | BOXWOOD DR | 2 |
| | | Fire incidents reported |
|---|
| Sreet name | Count |
|---|
| BUTINA LANE | 2 | | C ST | 2 | | CURRY HILL RD | 2 | | EDGEWATER VLG | 2 | | FROSTY LN | 2 | | GEORGE ST | 2 | | HENRY RD | 2 | | HILLCREST DR | 2 | | KINGSTON ST | 2 | | MACEY RD | 2 | | MAIN ST. | 2 | | MAIN STREET | 2 | | NATIONAL LANE LN | 2 | | NEWMEYER RD | 2 | | NORTH SUMMIT ST | 2 | | PINE VALLEY | 2 | | PINE VALLEY LANE | 2 | | QUARTZ LANE | 2 | | RIDILLA RD | 2 | | ROUTE 30 EAST BOUND | 2 | | RT. 981 | 2 | | SCHULTZ LANE | 2 | | SOLMON TEMPLE ROAD | 2 | | SOLOMON TEMPLE RD | 2 | | TRESTLE LN | 2 |
|
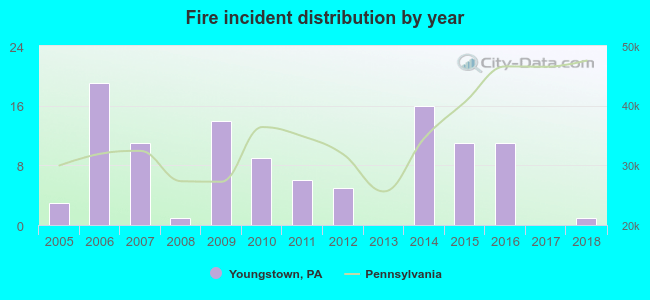 Based on the data from the years 2005 - 2018 the average number of fires per year is 8. The highest number of fire incidents - 19 took place in 2006, and the least - 0 in 2013. The data has a decreasing trend.
 31.8% incidents where reported in the morning and 68.2% in the evening. The most fires (20.6%) took place on Sunday, and the least (10.3%) on Monday.
 According to the 107 reports from years 2005 - 2018 most fires (16.8%) took place during February, and the least (1.9%) in September.
 Out of all 216 cases reported during the years 2005 - 2018, the most belonged to the categories: Fire (49.5%), Overpressure Rupture (17.6%), and Rescue & EMS (15.7%).
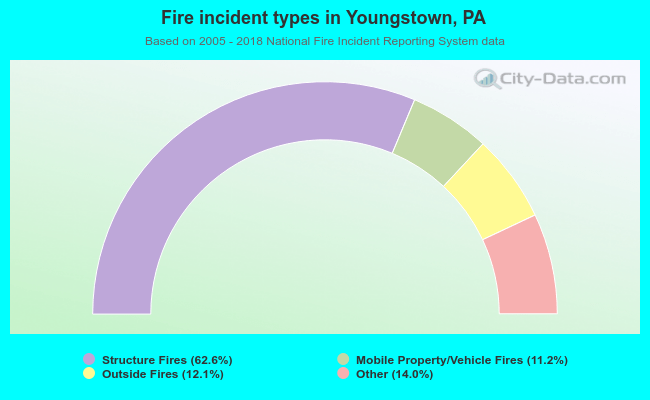 When looking into fire subcategories, the most reports belonged to: Structure Fires (62.6%), and Other (14.0%).